FINANCIAL LEVERAGE AND CAPITAL STRUCTURE POLICY Chapter 16


Theory of Capital")

Theory The proposition that the value of the firm is independent")


RE + (D/V)RD RE = RA")


(RM – Rf) CAPM: RE")

? RE =")


- Slides: 46
FINANCIAL LEVERAGE AND CAPITAL STRUCTURE POLICY Chapter 16 Reem Alnuaim
Course Roadmap Chapte Topic r Focus 15 Raising Capital All 14 Cost of Capital All 9 Net Present Value and Other Investment Criteria All 11 Project Analysis and Evaluation All 16 Financial Leverage and Capital All Structure Policy 10 Making Capital Investment Decision All 17 Dividends Theory All Exam Mid-Term
Capital Restructuring What is meant by capital restructuring What is the primary goal of financial managers? Can leverage help in achieving such goals?
Capital Restructuring We are going to look at how changes in capital structure affect the value of the firm, all else equal Capital restructuring involves changing the amount of leverage a firm has without changing the firm’s assets The firm can increase leverage by issuing debt and repurchasing outstanding shares The firm can decrease leverage by issuing new shares and retiring outstanding debt
Capital Restructuring How should a firm go about choosing its debt– equity ratio? We assume that the guiding principle is to choose the course of action that maximizes the value of a share of stock. When it comes to capital structure decisions, this is essentially the same thing as maximizing the value of the whole firm, and, for convenience, we will tend to frame our discussion in terms of firm value
FIRM VALUE AND STOCK VALUE: AN EXAMPLE The following example illustrates that the capital structure that maximizes the value of the Firm is the one financial managers should choose for the shareholders, so there is no conflict in our goals. To begin, suppose the market value of the J. J. Sprint Company is $1, 000. The company currently has no debt, and J. J. Sprint’s 100 shares sell for $10 each. Further suppose that J. J. Sprint restructures itself by borrowing $500 and then paying out the proceeds to shareholders as an extra dividend of $500/ 100 = $5 per share. This restructuring will change the capital structure of the firm with no direct effect on the firm’s assets. The immediate effect will be to increase debt and decrease equity
for ease of presentation, we describe the impact of leverage in terms of its effects on earnings per share, EPS, and return on equity, ROE. These are, of course, accounting numbers and, as such, are not our primary concern. Using cash flows instead of these accounting numbers would lead to precisely the same conclusions, but a little more work would be needed. We discuss the impact on market values in a subsequent section.
Choosing a Capital Structure What is the primary goal of financial managers? � Maximize stockholder wealth We want to choose the capital structure that will maximize stockholder wealth We can maximize stockholder wealth by maximizing the value of the firm or minimizing the WACC
Financial Leverage The extent to which a firm relies on debt The more debt financing a firm uses in its capital structure, the more financial leverage it employs
Break-Even EBIT Find EBIT where EPS is the same under both the current and proposed capital structures If we expect EBIT to be greater than the breakeven point, then leverage is beneficial to our stockholders If we expect EBIT to be less than the break-even point, then leverage is detrimental to our stockholders
Ex 1 Page 569 Maynard, Inc. , has no debt outstanding and a total market value of 250, 000$. EBIT are projected to be 28, 000$ if economic conditions are normal. If there is strong expansion in the economy, then EBIT will be 30 percent higher. If there is a recession, then EBIT will be 50 percent lower. Maynard is considering a 90, 000$ debt issue with a 7 percent interest rate. The proceeds will be used to repurchase a share of stock. There are currently 5, 000 shares outstanding. Ignore taxes for this problem A. Calculate EPS under each of the three economic scenarios before any debt is issued. Also calculate the percentage changes in EPS when the economy expands or enters a recession. B. Repeat part (a) assuming that the economy goes with recapitalization. What do you observe?
Ex 4 Page 542 James Corporation is comparing two different capital structures: an all equity plan (plan I) and a levered plan (plan II). Under plan I, the company would have 160, 000 shares of stock outstanding. Under plan II, there would be 80, 000 shares of stock outstanding and 2. 8$ million in debt outstanding. The interest rate on the debt is 8 percent and there are no taxes. A. If EBIT is 350, 000$, which plan will result in the higher EPS? B. If EBIT is 500, 000$, which plan will result in the higher EPS? C. What is the break-even EBIT?
Corporate borrowing & home made leverage homemade leverage: The use of personal borrowing to change the overall amount of financial leverage to which the individual is exposed.
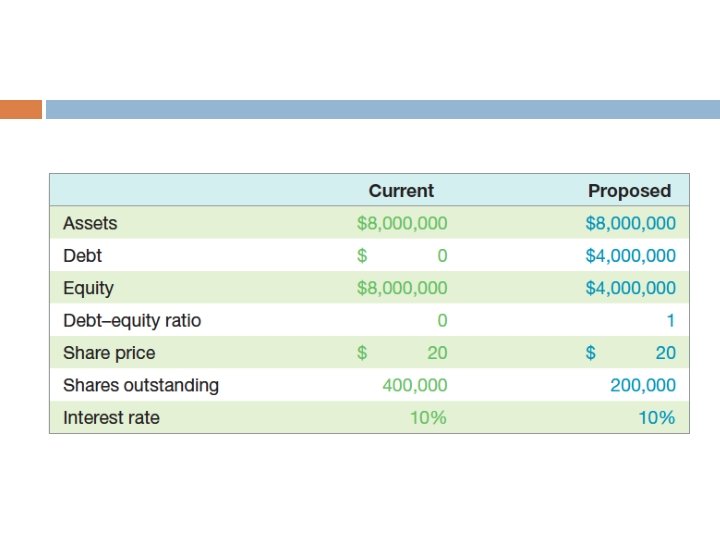
Proposed Capital Structure versus Original Capital Structure with Homemade Leverage
Proposed Capital Structure versus Original Capital Structure with Homemade Leverage This example demonstrates that investors can always increase financial leverage themselves to create a different pattern of payoffs. It thus makes no difference whether Trans Am chooses the proposed capital structure.
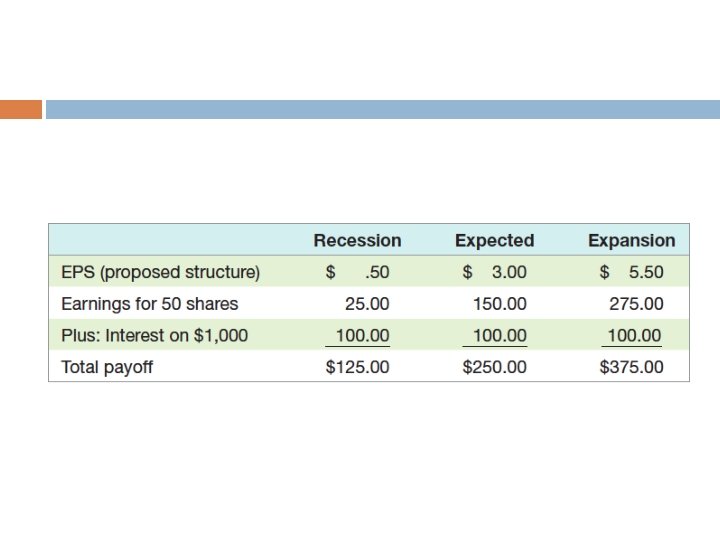
Unlevering the Stock suppose management adopts the proposed capital structure. Further suppose that an investor who owned 100 shares preferred the original capital structure. Show this investor could “unlever” the stock to recreate the original payoffs. To create leverage, investors borrow on their own. To undo leverage, investors must lend money. In the case of Trans Am, the corporation borrowed an amount equal to half its value. The investor can unlever the stock by simply lending money in the same proportion. In this case, the investor sells 50 shares for $1, 000 total and then lends the $1, 000 at 10 percent. The payoffs are calculated in the following table:
Capital Structure and the Cost of Equity Capital Modigliani and Miller (M&M)Theory of Capital Structure � Proposition I – firm value � Proposition II – WACC The value of the firm is determined by the cash flows to the firm and the risk of the assets Changing firm value � Change the risk of the cash flows � Change the cash flows
Capital Structure Theory Under Three Special Cases Case I – Assumptions � No corporate or personal taxes � No bankruptcy costs Case II – Assumptions � Corporate taxes, but no personal taxes � No bankruptcy costs Case III – Assumptions � Corporate taxes, but no personal taxes � Bankruptcy costs
Modigliani and Miller (M&M)Theory The proposition that the value of the firm is independent of the firm’s capital structure. THE PIE MODEL One way to illustrate M&M Proposition I is to imagine two firms that are identical on the left side of the balance sheet. Their assets and operations are exactly the same. The right sides are different because the two firms finance their operations differently.
Figure 16. 2 In this case, we can view the capital structure question in terms of a “pie” model.
Figure 16. 2 gives two possible ways of cutting up the pie between the equity slice, E , and the debt slice, D : 40%– 60% and 60%– 40%. However, the size of the pie in Figure 16. 2 is the same for both firms because the value of the assets is the same. This is precisely what M&M Proposition I states: The size of the pie doesn’t depend on how it is sliced.
Case I – Propositions I and II Proposition I � The value of the firm is NOT affected by changes in the capital structure � The cash flows of the firm do not change; therefore, value doesn’t change Proposition II � The WACC of the firm is NOT affected by capital structure
Case I - Equations WACC = RA = (E/V)RE + (D/V)RD RE = RA + (RA – RD)(D/E) � RA is the “cost” of the firm’s business risk, i. e. , the risk of the firm’s assets � (RA – RD)(D/E) is the “cost” of the firm’s financial risk, i. e. , the additional return required by stockholders to compensate for the risk of leverage
Business Risk and Financial Risk the systematic risk of the stock depends on: � Systematic � Level risk of the assets, A, (Business risk) of leverage, D/E, (Financial risk)
The Cost of Equity Capital Example: 16. 3
The CAPM, the SML and Proposition II How does financial leverage affect systematic risk? CAPM: RA = Rf + A(RM – Rf) � Where A is the firm’s asset beta and measures the systematic risk of the firm’s assets Proposition II � � Replace RA with the CAPM and assume that the debt is riskless (RD = Rf) RE = Rf + A(1+D/E)(RM – Rf)
Business Risk and Financial Risk RE = Rf + A(1+D/E)(RM – Rf) CAPM: RE = Rf + E(RM – Rf) � E = A(1 + D/E) Therefore, the systematic risk of the stock depends on: risk of the assets, A, (Business risk) � Level of leverage, D/E, (Financial risk) � Systematic
Business Risk and Financial Risk The total systematic risk of the firm’s equity has two parts: Business risk and Financial risk. The first part (the business risk) depends on the firm’s assets and operations and is not affected by capital structure. The second part (the financial risk) is completely determined by financial policy.
Case I - Example Data � What is the cost of equity(RE)? RE = RA + (RA – RD)(D/E) � Required return on assets(RA) = 16%; cost of debt(RD) = 10%; percent of debt = 45% RE = 16 + (16 - 10)(. 45/. 55) = 20. 91% Suppose instead that the cost of equity is 25%, what is the debt-to-equity ratio? RE = RA + (RA – RD)(D/E) 25 = 16 + (16 - 10)(D/E) � D/E = (25 - 16) / (16 - 10) = 1. 5 �
Case II – Cash Flow Interest is tax deductible Therefore, when a firm adds debt, it reduces taxes, all else equal The reduction in taxes increases the cash flow of the firm How should an increase in cash flows affect the value of the firm?
Case II - Example
Interest Tax Shield Annual interest tax shield � Tax rate times interest payment. � 6, 250 in 8% debt = 500 in interest expense � Annual tax shield =. 34(500) = 170 Present value of annual interest tax shield � Assume perpetual debt for simplicity � PV = 170 /. 08 = 2, 125 � PV = D(RD)(TC) / RD = DTC = 6, 250(. 34) = 2, 125
Example page 547
We see from the result that capital structure has some effect because the cash flow from U and L is not the same, even thought the two firms have identical assets. The fact that interest is deductible for tax purposes has generated a tax saving = interest payment ($80) * tax rate (0. 30) = $24 = interest tax shield
Case II – Proposition I The value of the firm increases by the present value of the annual interest tax shield � Value of a levered firm = value of an unlevered firm + PV of interest tax shield � Value of equity = Value of the firm – Value of debt Assuming perpetual cash flows � VU = EBIT(1 -T) / RU � VL = VU + DTC
Example: Case II – Proposition I Data � EBIT = 25 million; Tax rate = 35%; Debt = $75 million; Cost of debt = 9%; Unlevered cost of capital = 12% � VU = EBIT(1 -T) / RU VU = 25(1 -. 35) /. 12 = $135. 42 million VL = VU + DTC VL = 135. 42 + 75(. 35) = $161. 67 million E = 161. 67 – 75 = $86. 67 million
Case II – Proposition II The WACC decreases as D/E increases because of the government subsidy on interest payments � Wacc = RA = (E/V)RE + (D/V)(RD)(1 -TC) � RE = RU + (RU – RD)(D/E)(1 -TC) Example � RE = 12 + (12 -9)(75/86. 67)(1 -. 35) = 13. 69% � RA = (86. 67/161. 67)(13. 69) + (75/161. 67)(9)(1 -. 35) RA = 10. 05%
Example: 16. 4
Example: Case II – Proposition II Suppose that the firm changes its capital structure so that the debt-to-equity ratio becomes 1. What will happen to the cost of equity under the new capital structure? � RE = 12 + (12 - 9)(1)(1 -. 35) = 13. 95% What will happen to the weighted average cost of capital? � RA =. 5(13. 95) +. 5(9)(1 -. 35) = 9. 9%
Case III Now we add bankruptcy costs As the D/E ratio increases, the probability of bankruptcy increases This increased probability will increase the expected bankruptcy costs At some point, the additional value of the interest tax shield will be offset by the increase in expected bankruptcy cost At this point, the value of the firm will start to decrease, and the WACC will start to increase as more debt is added
Bankruptcy Costs Direct costs � Legal and administrative costs � Ultimately cause bondholders to incur additional losses � Disincentive to debt financing Financial distress � Significant problems in meeting debt obligations � Firms that experience financial distress do not necessarily file for bankruptcy
More Bankruptcy Costs Indirect bankruptcy costs � � � Larger than direct costs, but more difficult to measure and estimate Stockholders want to avoid a formal bankruptcy filing Bondholders want to keep existing assets intact so they can at least receive that money Assets lose value as management spends time worrying about avoiding bankruptcy instead of running the business The firm may also lose sales, experience interrupted operations and lose valuable employees
Conclusions Case I – no taxes or bankruptcy costs � No optimal capital structure Case II – corporate taxes but no bankruptcy costs � Optimal capital structure is almost 100% debt � Each additional dollar of debt increases the cash flow of the firm Case III – corporate taxes and bankruptcy costs � Optimal capital structure is part debt and part equity � Occurs where the benefit from an additional dollar of debt is just offset by the increase in expected bankruptcy costs
Managerial Recommendations The tax benefit is only important if the firm has a large tax liability Risk of financial distress � The greater the risk of financial distress, the less debt will be optimal for the firm � The cost of financial distress varies across firms and industries, and as a manager you need to understand the cost for your industry