
Financial Benchmarking Allergan Leading the Way to Help

Financial Benchmarking
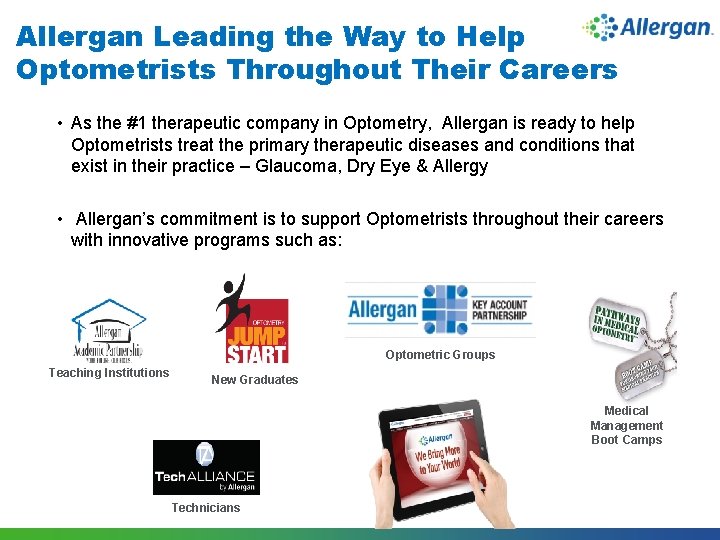
Allergan Leading the Way to Help Optometrists Throughout Their Careers • As the #1 therapeutic company in Optometry, Allergan is ready to help Optometrists treat the primary therapeutic diseases and conditions that exist in their practice – Glaucoma, Dry Eye & Allergy • Allergan’s commitment is to support Optometrists throughout their careers with innovative programs such as: Optometric Groups Teaching Institutions New Graduates Medical Management Boot Camps Technicians 1 Source: IMS NPA Monthly Data – Therapeutic Acquisition Dollars, 52 weeks through December 2015
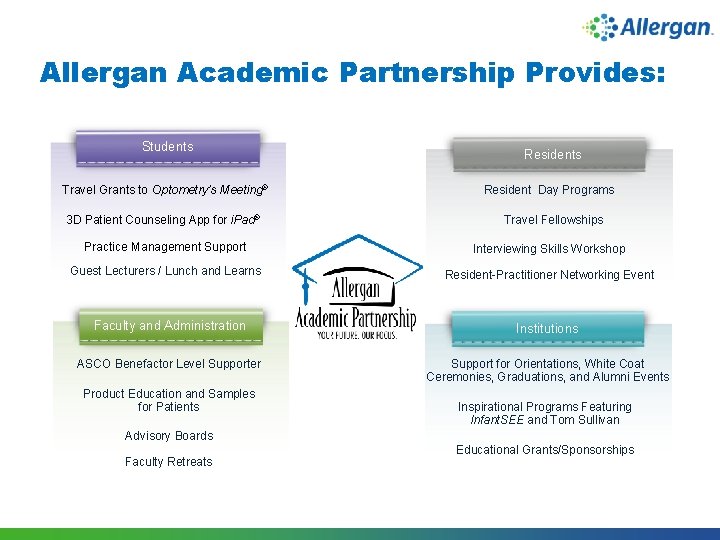
Allergan Academic Partnership Provides: Students Travel Grants to Optometry’s Meeting® 3 D Patient Counseling App for i. Pad® Residents Resident Day Programs Travel Fellowships Practice Management Support Interviewing Skills Workshop Guest Lecturers / Lunch and Learns Resident-Practitioner Networking Event Faculty and Administration Institutions ASCO Benefactor Level Supporter Support for Orientations, White Coat Ceremonies, Graduations, and Alumni Events Product Education and Samples for Patients Advisory Boards Faculty Retreats Inspirational Programs Featuring Infant. SEE and Tom Sullivan Educational Grants/Sponsorships
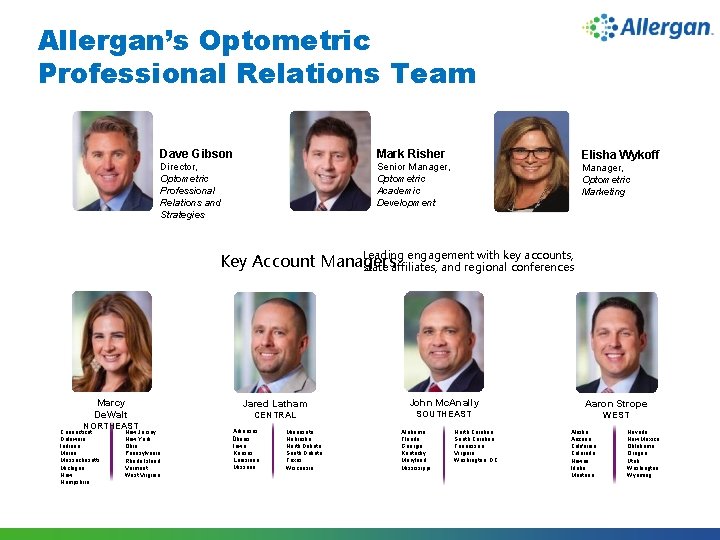
Allergan’s Optometric Professional Relations Team Dave Gibson Director, Insert Optometric Photo Professional Relations and Strategies Insert Photo Mark Risher Elisha Wykoff Senior Manager, Optometric Academic Development Manager, Optometric Marketing Insert Photo Leading engagement with key accounts, Key Account Managers state affiliates, and regional conferences Marcy Insert De. Walt NORTHEAST Photo New Jersey Connecticut Delaware Indiana Maine Massachusetts Michigan New Hampshire New York Ohio Pennsylvania Rhode Island Vermont West Virginia John Mc. Anally Jared Latham Insert CENTRAL Arkansas Photo Illinois Iowa Kansas Louisiana Missouri Minnesota Nebraska North Dakota South Dakota Texas Wisconsin Insert Photo Aaron Strope WEST Insert SOUTHEAST Alabama Florida Georgia Kentucky Maryland Mississippi Insert North Carolina Photo South Carolina Tennessee Virginia Washington, DC Alaska Arizona California Colorado Hawaii Idaho Montana Nevada Photo New Mexico Oklahoma Oregon Utah Washington Wyoming
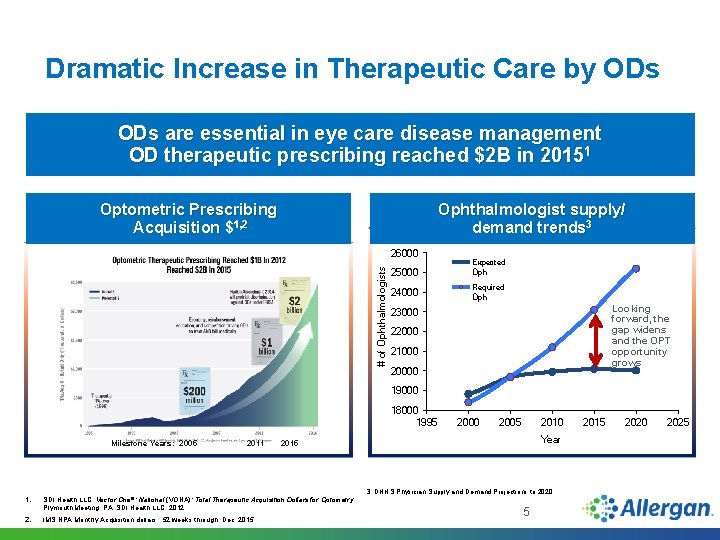
Dramatic Increase in Therapeutic Care by ODs are essential in eye care disease management OD therapeutic prescribing reached $2 B in 20151 Optometric Prescribing Acquisition $1, 2 Ophthalmologist supply/ demand trends 3 # of Ophthalmologists 26000 25000 Expected Oph 24000 Required Oph Looking forward, the gap widens and the OPT opportunity grows 23000 22000 21000 20000 19000 18000 1995 Milestone Years: 2005 2011 2000 2005 2010 Year 2015 1. SDI Health LLC. Vector One®: National (VONA): Total Therapeutic Acquisition Dollars for Optometry. Plymouth Meeting, PA: SDI Health LLC; 2012. IMS NPA Monthly Acquisition dollars , 52 weeks through Dec 2015 3. DHHS Physician Supply and Demand Projections to 2020. 5 2015 2020 2025
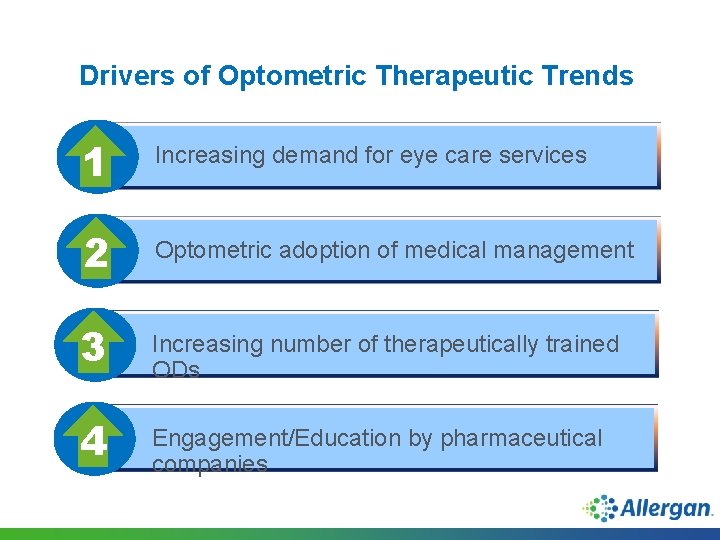
Drivers of Optometric Therapeutic Trends 1 Increasing demand for eye care services 2 Optometric adoption of medical management 3 Increasing number of therapeutically trained ODs 4 Engagement/Education by pharmaceutical companies

Optometry Is Under Financial Pressure From A Variety Of Sources Cost: $40 Eligible: 18 -40 yo Reach: 27 states
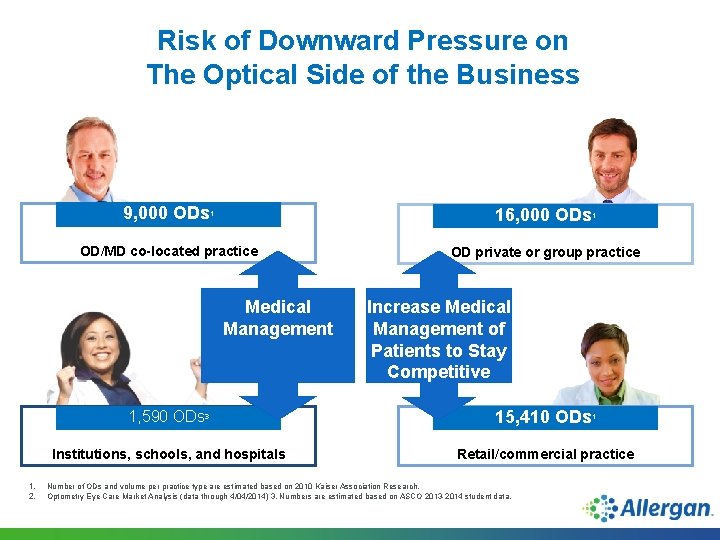
Risk of Downward Pressure on The Optical Side of the Business 9, 000 ODs 1 16, 000 ODs 1 OD/MD co-located practice OD private or group practice Medical Management 1. 2. Increase Medical Management of Patients to Stay Competitive 1, 590 ODs 3 15, 410 ODs 1 Institutions, schools, and hospitals Retail/commercial practice Number of ODs and volume per practice type are estimated based on 2010 Kaiser Association Research. Optometry Eye Care Market Analysis (data through 4/04/2014) 3. Numbers are estimated based on ASCO 2013 -2014 student data.
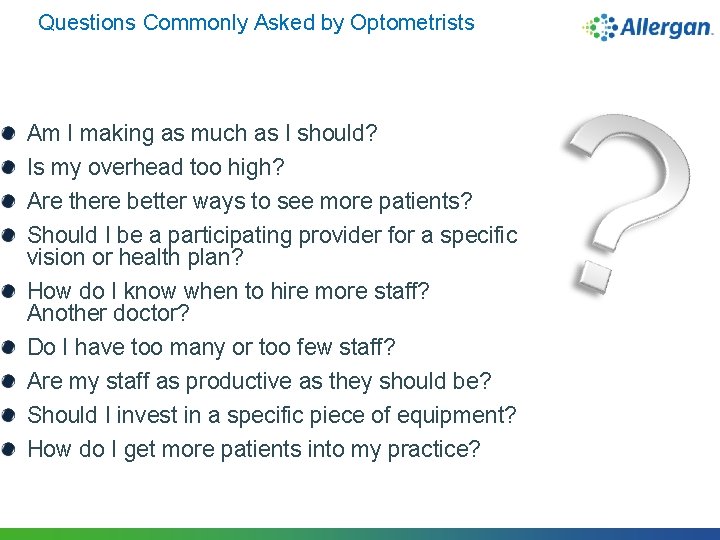
Questions Commonly Asked by Optometrists Am I making as much as I should? Is my overhead too high? Are there better ways to see more patients? Should I be a participating provider for a specific vision or health plan? How do I know when to hire more staff? Another doctor? Do I have too many or too few staff? Are my staff as productive as they should be? Should I invest in a specific piece of equipment? How do I get more patients into my practice?

Sound business decisions cannot be made without “good” information.
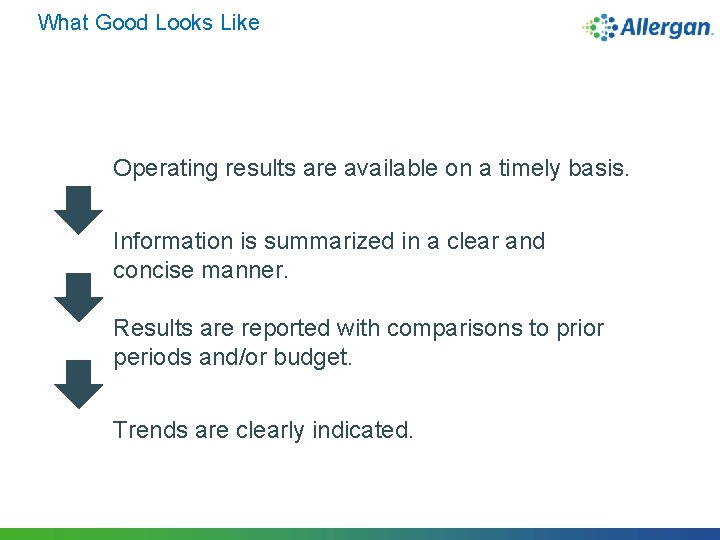
What Good Looks Like Operating results are available on a timely basis. Information is summarized in a clear and concise manner. Results are reported with comparisons to prior periods and/or budget. Trends are clearly indicated.
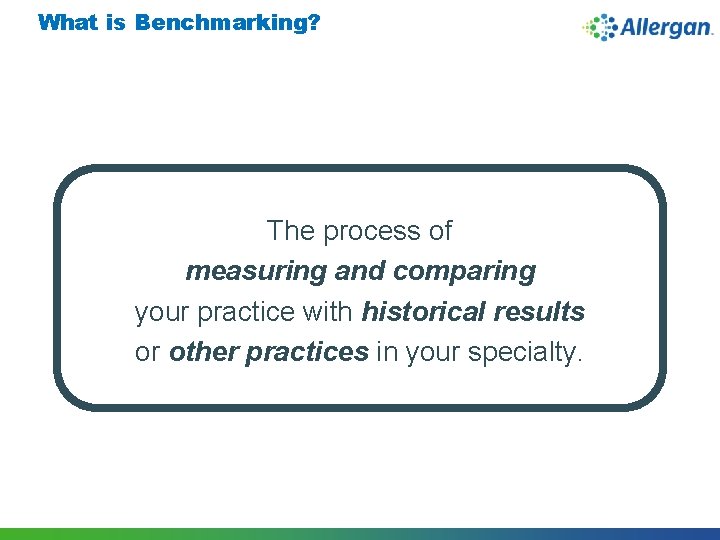
What is Benchmarking? The process of measuring and comparing your practice with historical results or other practices in your specialty.
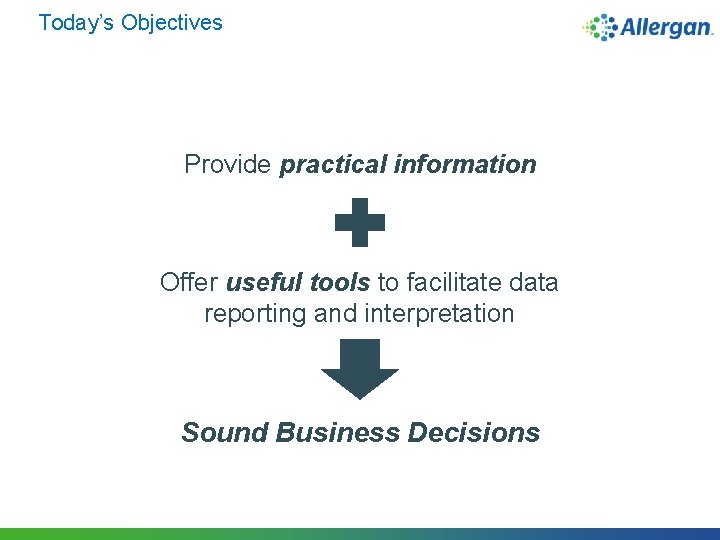
Today’s Objectives Provide practical information Offer useful tools to facilitate data reporting and interpretation Sound Business Decisions
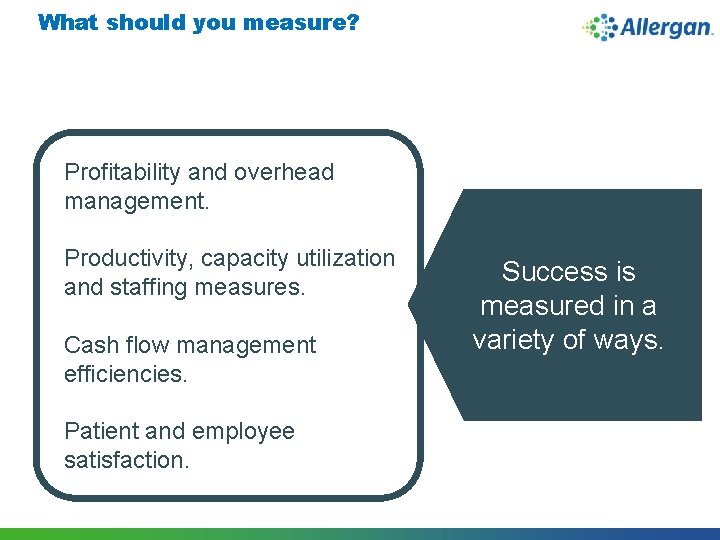
What should you measure? Profitability and overhead management. Productivity, capacity utilization and staffing measures. Cash flow management efficiencies. Patient and employee satisfaction. Success is measured in a variety of ways.
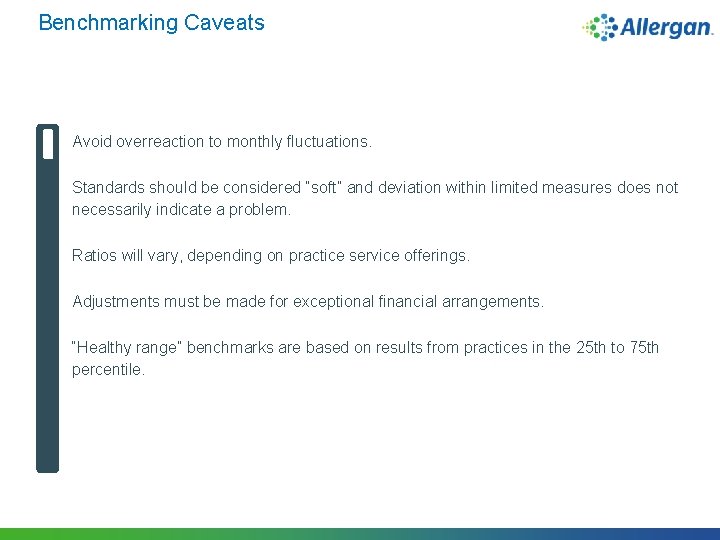
Benchmarking Caveats Avoid overreaction to monthly fluctuations. Standards should be considered “soft” and deviation within limited measures does not necessarily indicate a problem. Ratios will vary, depending on practice service offerings. Adjustments must be made for exceptional financial arrangements. “Healthy range” benchmarks are based on results from practices in the 25 th to 75 th percentile.
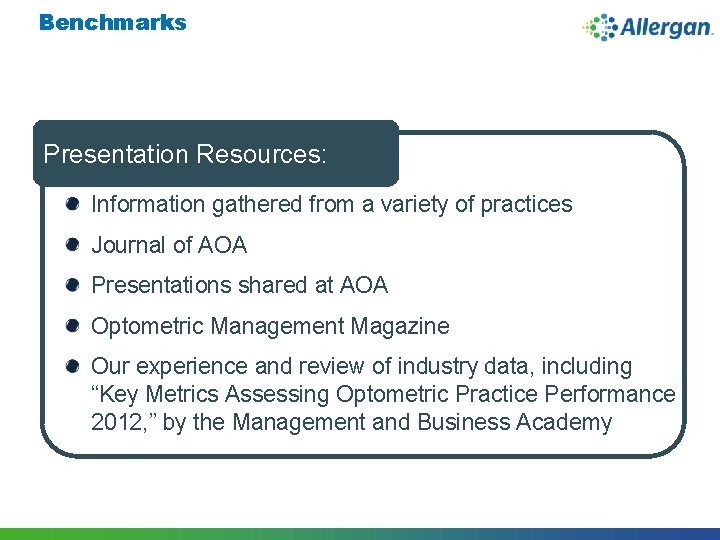
Benchmarks Presentation Resources: Information gathered from a variety of practices Journal of AOA Presentations shared at AOA Optometric Management Magazine Our experience and review of industry data, including “Key Metrics Assessing Optometric Practice Performance 2012, ” by the Management and Business Academy
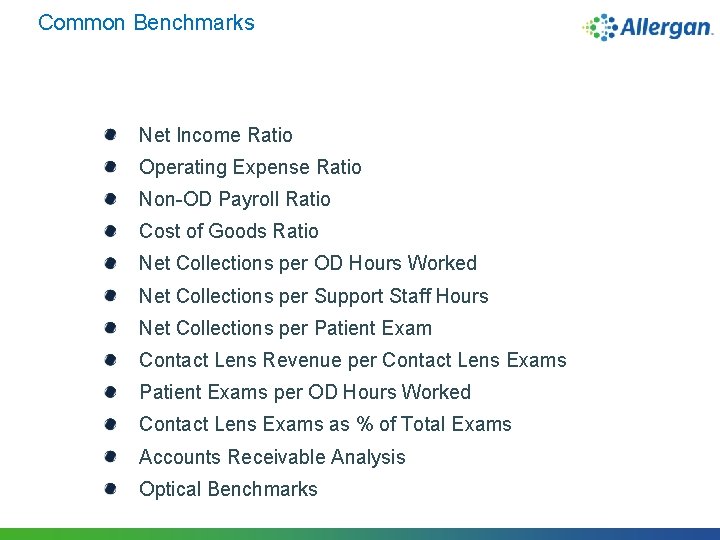
Common Benchmarks Net Income Ratio Operating Expense Ratio Non-OD Payroll Ratio Cost of Goods Ratio Net Collections per OD Hours Worked Net Collections per Support Staff Hours Net Collections per Patient Exam Contact Lens Revenue per Contact Lens Exams Patient Exams per OD Hours Worked Contact Lens Exams as % of Total Exams Accounts Receivable Analysis Optical Benchmarks
Financial and Production Benchmarks
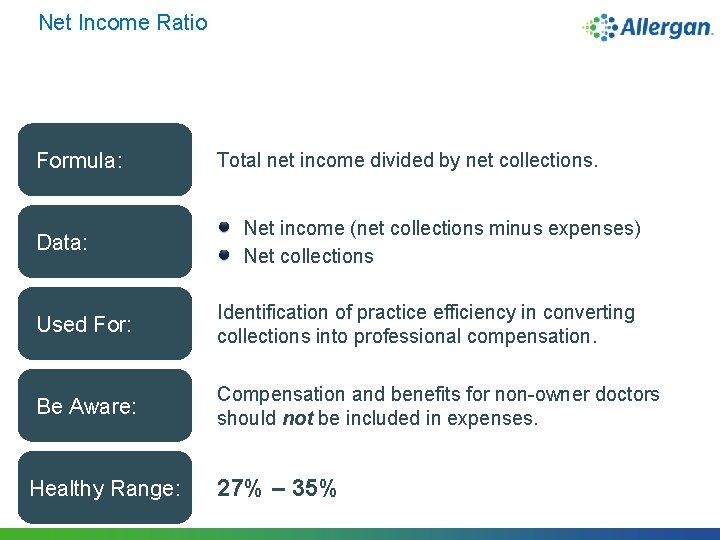
Net Income Ratio Formula: Data: Total net income divided by net collections. Net income (net collections minus expenses) Net collections Used For: Identification of practice efficiency in converting collections into professional compensation. Be Aware: Compensation and benefits for non-owner doctors should not be included in expenses. Healthy Range: 27% – 35%
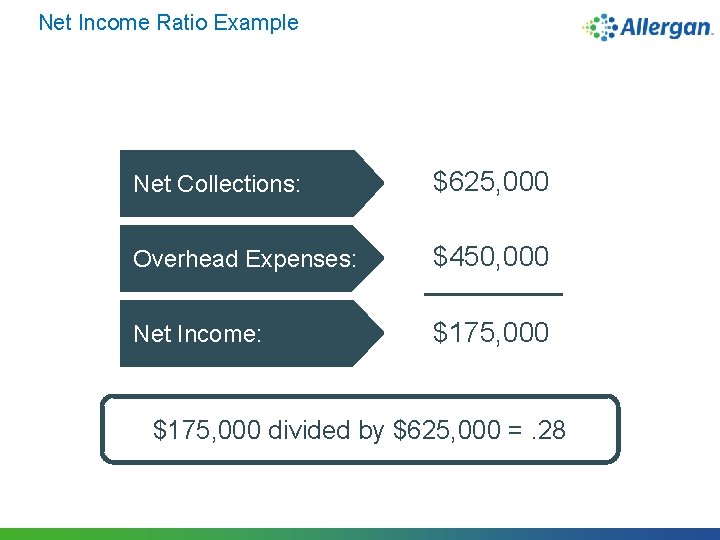
Net Income Ratio Example Net Collections: $625, 000 Overhead Expenses: $450, 000 Net Income: $175, 000 divided by $625, 000 =. 28
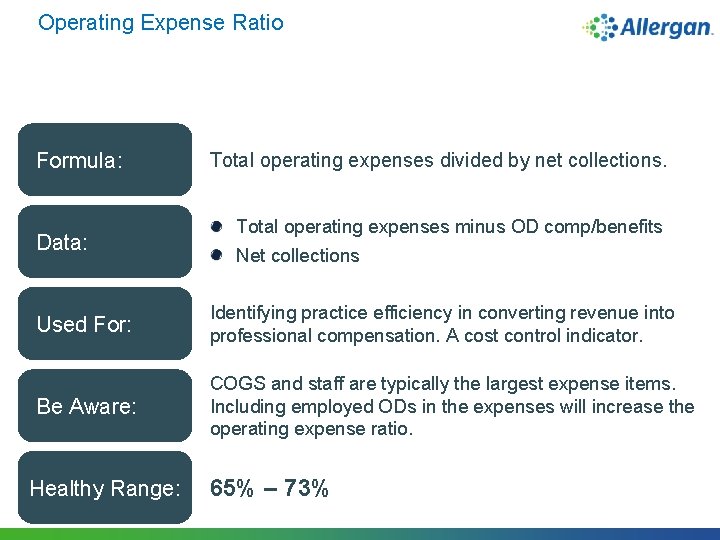
Operating Expense Ratio Formula: Data: Total operating expenses divided by net collections. Total operating expenses minus OD comp/benefits Net collections Used For: Identifying practice efficiency in converting revenue into professional compensation. A cost control indicator. Be Aware: COGS and staff are typically the largest expense items. Including employed ODs in the expenses will increase the operating expense ratio. Healthy Range: 65% – 73%
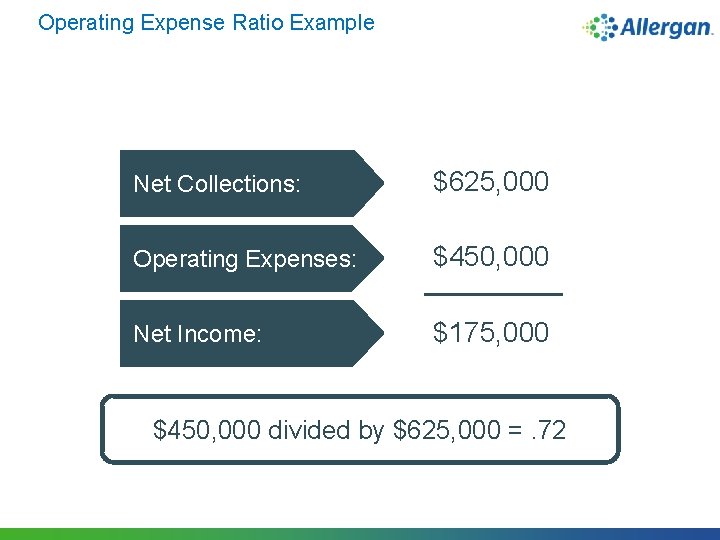
Operating Expense Ratio Example Net Collections: $625, 000 Operating Expenses: $450, 000 Net Income: $175, 000 $450, 000 divided by $625, 000 =. 72
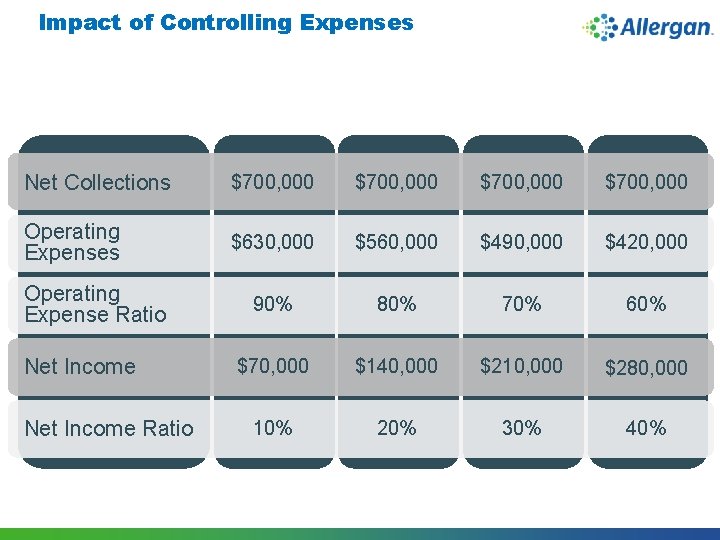
Impact of Controlling Expenses Net Collections $700, 000 Operating Expenses $630, 000 $560, 000 $490, 000 $420, 000 90% 80% 70% 60% $70, 000 $140, 000 $210, 000 $280, 000 10% 20% 30% 40% Operating Expense Ratio Net Income Ratio
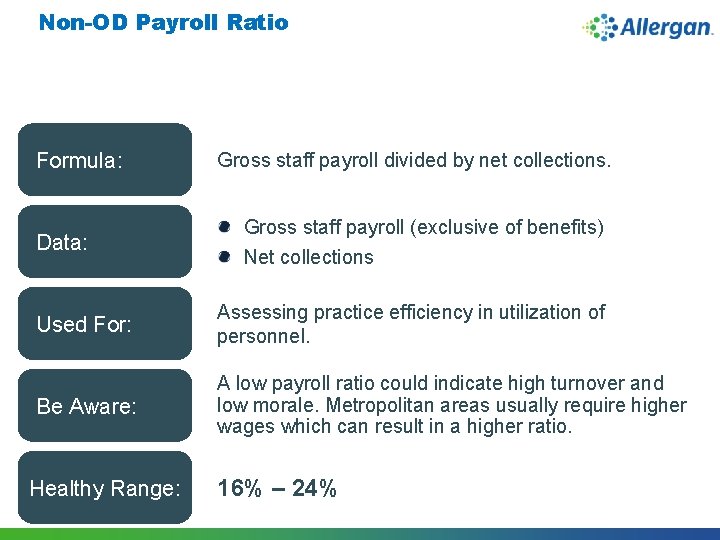
Non-OD Payroll Ratio Formula: Data: Gross staff payroll divided by net collections. Gross staff payroll (exclusive of benefits) Net collections Used For: Assessing practice efficiency in utilization of personnel. Be Aware: A low payroll ratio could indicate high turnover and low morale. Metropolitan areas usually require higher wages which can result in a higher ratio. Healthy Range: 16% – 24%
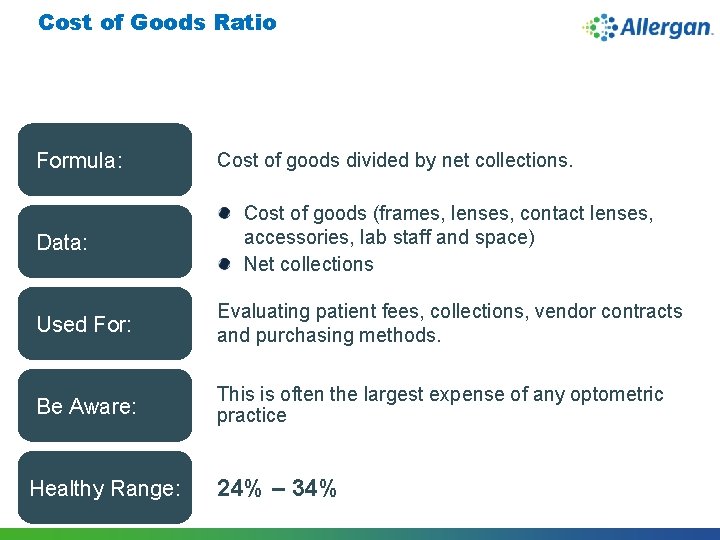
Cost of Goods Ratio Formula: Data: Cost of goods divided by net collections. Cost of goods (frames, lenses, contact lenses, accessories, lab staff and space) Net collections Used For: Evaluating patient fees, collections, vendor contracts and purchasing methods. Be Aware: This is often the largest expense of any optometric practice Healthy Range: 24% – 34%
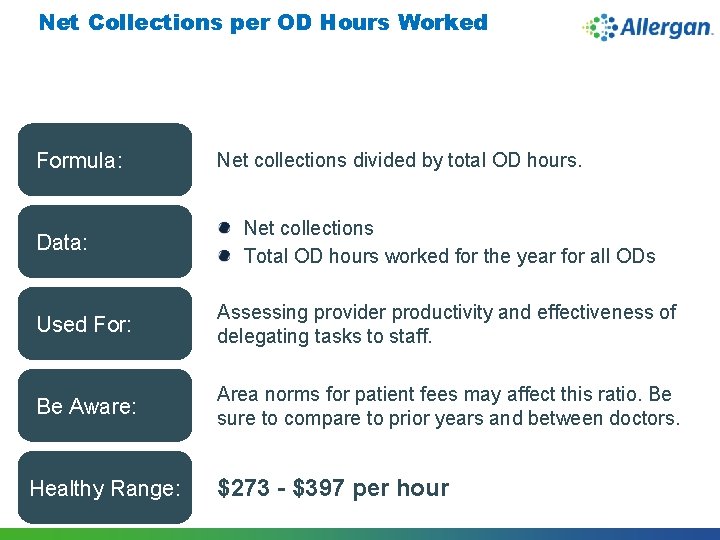
Net Collections per OD Hours Worked Formula: Data: Net collections divided by total OD hours. Net collections Total OD hours worked for the year for all ODs Used For: Assessing provider productivity and effectiveness of delegating tasks to staff. Be Aware: Area norms for patient fees may affect this ratio. Be sure to compare to prior years and between doctors. Healthy Range: $273 - $397 per hour
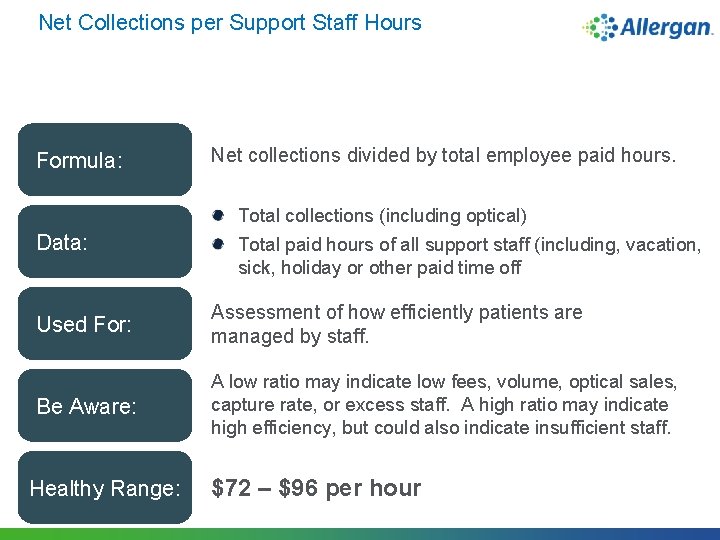
Net Collections per Support Staff Hours Formula: Net collections divided by total employee paid hours. Total collections (including optical) Data: Total paid hours of all support staff (including, vacation, sick, holiday or other paid time off Used For: Assessment of how efficiently patients are managed by staff. Be Aware: A low ratio may indicate low fees, volume, optical sales, capture rate, or excess staff. A high ratio may indicate high efficiency, but could also indicate insufficient staff. Healthy Range: $72 – $96 per hour

Patient Exam Benchmarks
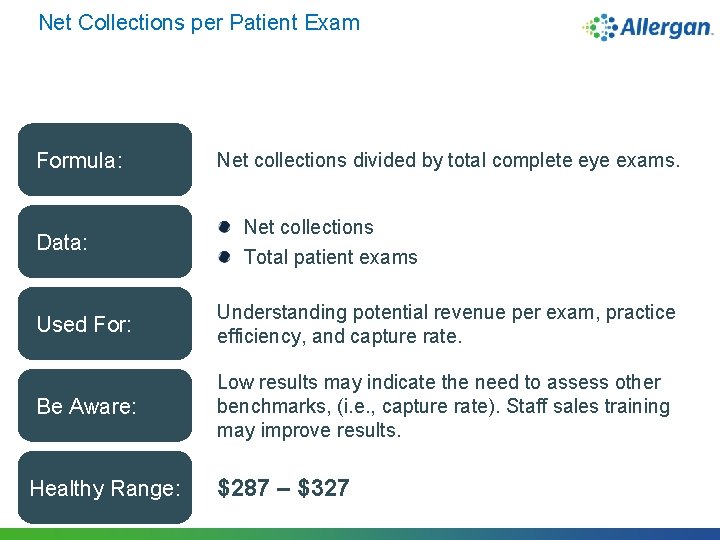
Net Collections per Patient Exam Formula: Data: Net collections divided by total complete eye exams. Net collections Total patient exams Used For: Understanding potential revenue per exam, practice efficiency, and capture rate. Be Aware: Low results may indicate the need to assess other benchmarks, (i. e. , capture rate). Staff sales training may improve results. Healthy Range: $287 – $327
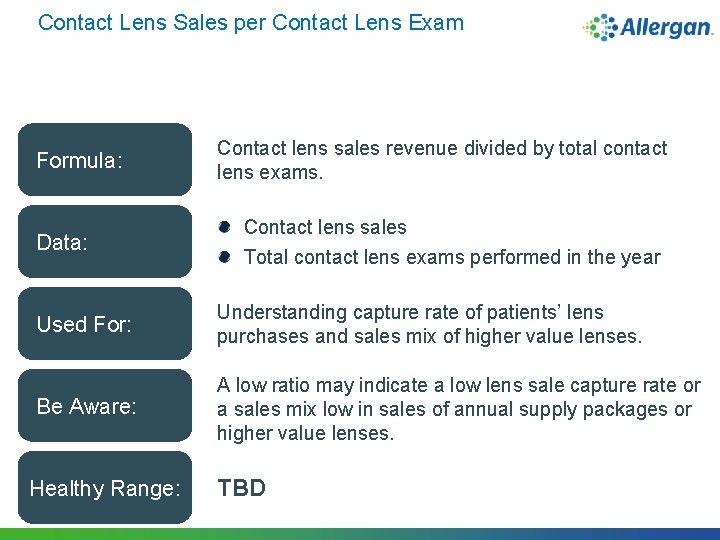
Contact Lens Sales per Contact Lens Exam Formula: Data: Contact lens sales revenue divided by total contact lens exams. Contact lens sales Total contact lens exams performed in the year Used For: Understanding capture rate of patients’ lens purchases and sales mix of higher value lenses. Be Aware: A low ratio may indicate a low lens sale capture rate or a sales mix low in sales of annual supply packages or higher value lenses. Healthy Range: TBD
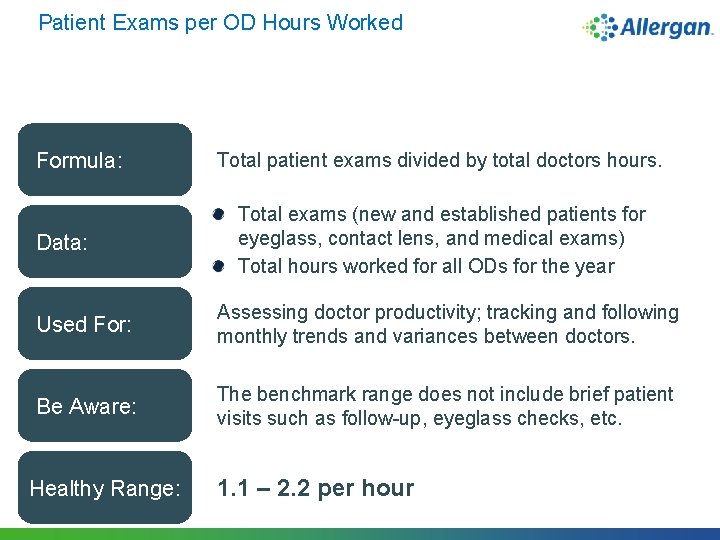
Patient Exams per OD Hours Worked Formula: Data: Total patient exams divided by total doctors hours. Total exams (new and established patients for eyeglass, contact lens, and medical exams) Total hours worked for all ODs for the year Used For: Assessing doctor productivity; tracking and following monthly trends and variances between doctors. Be Aware: The benchmark range does not include brief patient visits such as follow-up, eyeglass checks, etc. Healthy Range: 1. 1 – 2. 2 per hour
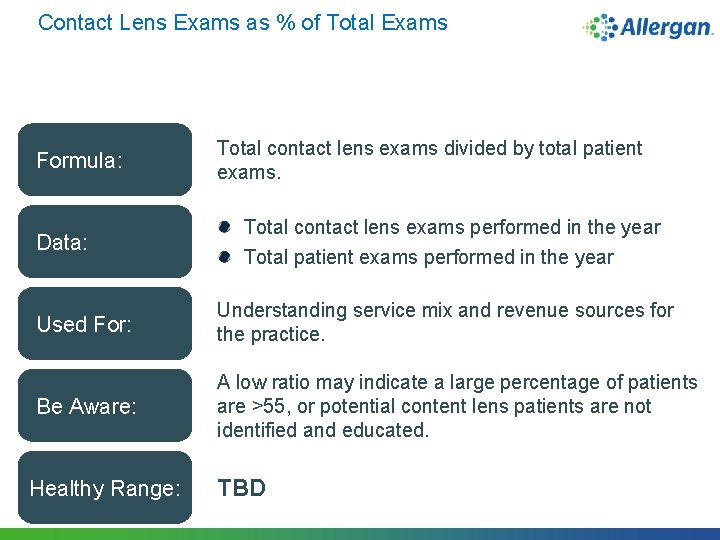
Contact Lens Exams as % of Total Exams Formula: Data: Total contact lens exams divided by total patient exams. Total contact lens exams performed in the year Total patient exams performed in the year Used For: Understanding service mix and revenue sources for the practice. Be Aware: A low ratio may indicate a large percentage of patients are >55, or potential content lens patients are not identified and educated. Healthy Range: TBD
Accounts Receivable Analysis
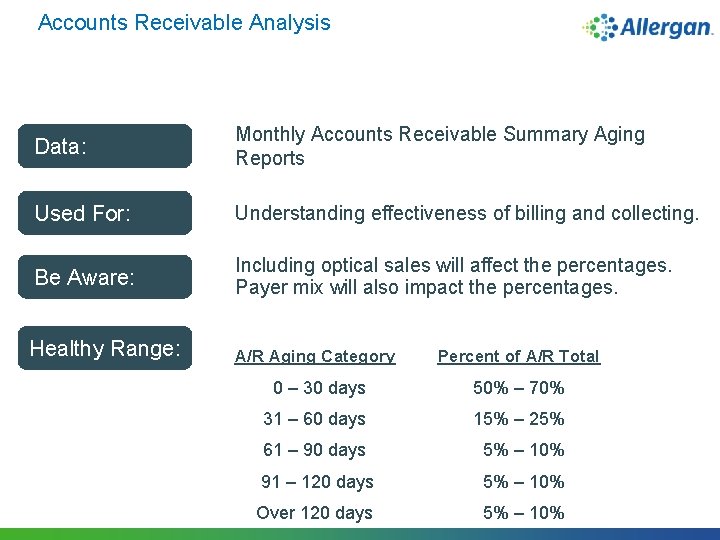
Accounts Receivable Analysis Data: Monthly Accounts Receivable Summary Aging Reports Used For: Understanding effectiveness of billing and collecting. Be Aware: Including optical sales will affect the percentages. Payer mix will also impact the percentages. Healthy Range: A/R Aging Category Percent of A/R Total 0 – 30 days 50% – 70% 31 – 60 days 15% – 25% 61 – 90 days 5% – 10% 91 – 120 days 5% – 10% Over 120 days 5% – 10%
Optical Benchmarks
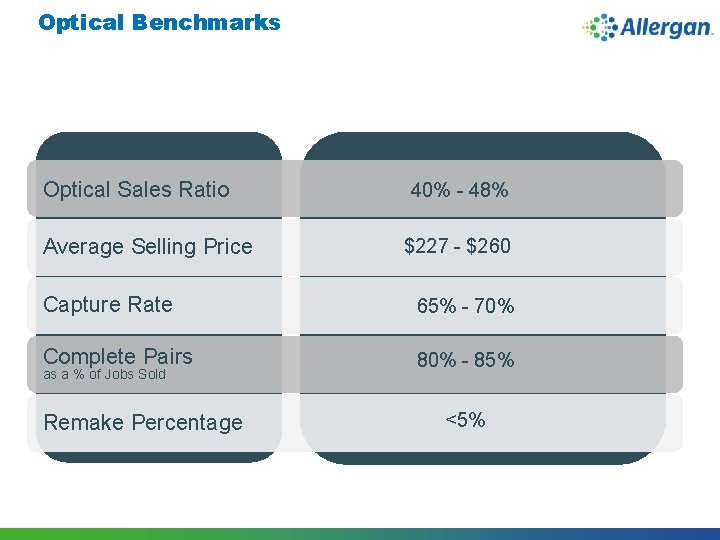
Optical Benchmarks Optical Sales Ratio Average Selling Price 40% - 48% $227 - $260 Capture Rate 65% - 70% Complete Pairs 80% - 85% as a % of Jobs Sold Remake Percentage <5%

Benchmarking the Data
How to use the Benchmarking Data Collect previous three years data, develop a yearly report to track production growth vs. previous years. Going forward, set up monthly reporting worksheet(s). Monthly reports can be rolled up to yearly reports. Compare like periods of time, e. g. quarter this year to same quarter last year. Review report(s) along with financial statements within 15 -20 days following month end. Develop plans to make improvements and implement.
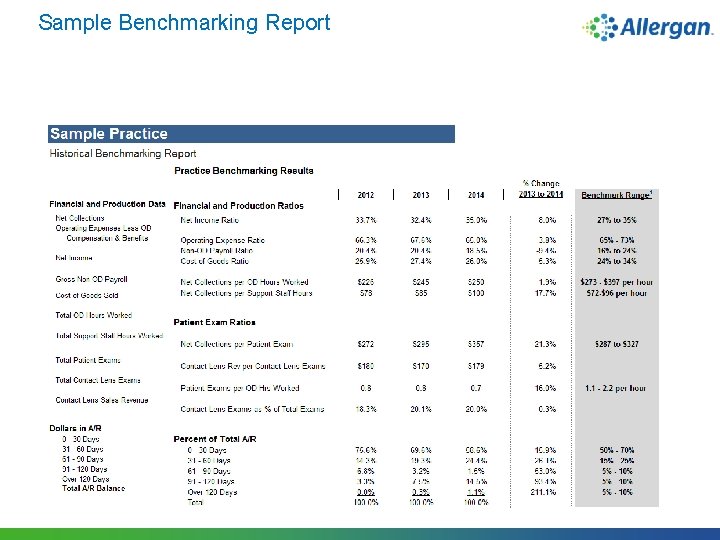
Sample Benchmarking Report
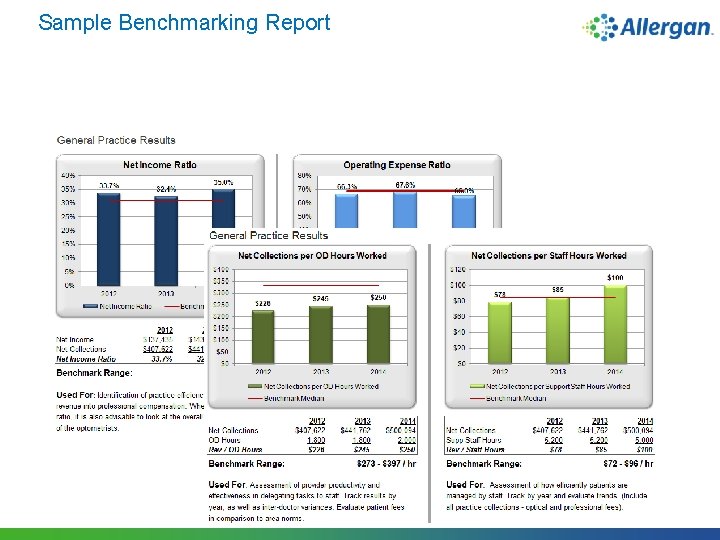
Sample Benchmarking Report
Take Aways Review data on a regular and timely basis Determine the ratios most important to managing your practice. One benchmark alone is not enough to make a decision; focus on the big picture. Review other published information to find benchmarks for comparison. Benchmark reports are road maps that uncover opportunities within the practice.

Thank You! The Leader in Optometric Therapeutics i. Pad is a trademark of Apple Inc. , registered in the US and other countries. Optometric Management is a registered trademark of Penta. Vision LLC. Optometry’s Meeting is a registered service mark of the American Optometric Association. We deliver. You save. is a registered service mark of 1 -800 Contacts, Inc. Walmart is a registered service mark of Wal-Mart Stores, Inc. © 2015, Allergan, Inc. , Irvine, CA 92612 �marks owned by Allergan, Inc.
- Slides: 42