Final Project Project 9 Part 1 Neural Networks


 Comparison with Other Classifiers • CPU data set shows a negative")


- Slides: 27
Final Project: Project 9 Part 1: Neural Networks Part 2: Overview of Classifiers Aparna S. Varde April 28, 2005 CS 539: Machine Learning Course Instructor: Prof. Carolina Ruiz
Part 1: Neural Networks • Data: The data sets used in this project are as follows. • CPU Data Set: – – Attributes describe features of computer CPUs such as vendors. Target attribute denotes CPU performance: real. Other attributes are mixture of real, nominal. 8 attributes, 209 instances. • Iris Data Set: – Attributes describe features of Iris flowers such as sepals and petals. – Target attribute denotes species of Iris: nominal. – 5 attributes, 150 instances. • Covtype Set: – – Attributes describe features of forests such as soil type, elevation. Target attribute denotes covertype of Forest: nominal. 55 attributes, approximately 58, 000 instances. Attributes describe 12 features, some are Boolean namely type 1, type 2 etc. , so 54 attributes, plus target.
Preprocessing of Data • Resampling: – WEKA instance-based unsupervised filter used as a preprocessing step for the Covtype data to select a subset of instances for running experiments. – 3 subsets selected, with 5000, 3000 instances and 1000 instances respectively. – This was done to observe the impact of the neural network on data sets of different sizes. • Supervised Discretization: – – • To convert continuous attributes to ranges for the Iris data, to observe impact on accuracy. Supervised discretization done with default MDL since the target class is nominal. Done using the WEKA attribute-based supervised preprocessing filter. Followed by nominal to binary conversion which is directly done in the neural net. This will be discussed in the experiments section. Unsupervised Discretization: – Done for the CPU data set only to be able to compare it with the other classifiers such as decision trees and Zero R. – Target initially not nominal, so simple discretization done by binning. Discretization done for this data because J 4. 8 classifier used for comparison works with nominal targets only. – Discretiztion done using the WEKA attribute-based unsupervised preprocessing filter.
Experiments with Covertype Data Experiments conducted: 4 -fold-cv used for testing. 1. 2. 3. 4. 5. Data set size: 1000, 3000, 5000 other parameters default. Learning Rate: 0. 1, 0. 2, 0. 3 … 1. 0 with best settings from above. Momentum: 0. 1, 0. 2, 0. 3 … 1. 0 with best settings from above. Number of epochs: 100, 200, 300 … 1000 with best settings from above. Validation Set: 0%, 5%, 10%, 15% …. 50% of data set, best settings above. Validation Threshold: 10, 20, 30 …. 100 epochs, best settings above. Number of Hidden Layer units: a, i, o, t, with best settings. 6. 7. • • 8. 9. i = number of input values o= number of output classes t = i+o a = (i+o)/2 Two Hidden Layers: “x, a”… “x, t” where “x” is best setting from above. Normalization: True/False, experiment for default/best settings.
Experiment 1: Effect of Data Set Size • Default Settings: Learning Rate = 0. 3, Momentum = 0. 2, Number of epochs = 500, Validation Set = 0, Number of Hidden Layer Units = “a”, Normalization = True. • • • The highest accuracy is obtained for the data set with 1000 instances. This 1000 instances data set also requires the least time to model. The lowest accuracy is obtained for the 3000 instances data set. The highest time to model was with the 5000 instances data set. Based on this, 1000 instances data set selected for remaining experiments.
Experiment 2: Effect of Learning Rate • Settings: Data Size = 1000, Momentum = 0. 2, Number of epochs = 500, Validation Set = 0, Number of Hidden Layer Units = “a”, Normalization = True. • • Maximum time to model is 202. 59 seconds for Learning Rate of 0. 1 Minimum time to model is 184. 57 seconds for Learning Rate of 0. 3 The lowest accuracy 86% is for Learning Rate of 1. 0 In general as learning rate increases, accuracy tends to reduce. Also time model is less though the drop in time is not as steady as the drop in accuracy. The highest accuracy is 87. 85% obtained for learning rates of 0. 2 and 0. 4 However, time to model is less for learning rate of 0. 4 than for 0. 2 Thus the learning rate of 0. 4 is selected as the setting for further experiments.
Experiment 3: Effect of Momentum • Settings: Data Size = 1000, Learning Rate = 0. 4, Number of epochs = 500, Validation Set = 0, Number of Hidden Layer Units = “a”, Normalization = True. • • • The lowest accuracy is 34. 28% obtained for momentum of 0. 9 The highest accuracy is 87. 85% obtained for momentum of 0. 2 The longest time to model is 204. 36 seconds for momentum of 0. 8 The shortest time to model is 178. 06 seconds for momentum of 1 In general accuracy drops down after momentum 0. 7 and gets really low for momentum of 1 • The setting selected for further experiments is with momentum of 0. 2 since it gives the highest accuracy of 87. 85%
Experiment 4: Effect of Number of Epochs • Settings: Data Size = 1000, Learning Rate = 0. 4, Momentum = 0. 2, Validation Set = 0, Number of Hidden Layer Units = “a”, Normalization = True. • • • Accuracy increases as the number of epochs increase The time to model obviously increases as the number of epochs increase The best accuracy of 88. 17% is obtained for number of epochs = 900 The lowest accuracy is 84% for number of epochs = 100 The setting used for further experiments is Number of Epochs = 900
Experiment 5: Effect of Validation Set Size • Settings: Data Size = 1000, Learning Rate = 0. 4, Momentum = 0. 2, Number of Epochs = 900, Number of Hidden Layer Units = “a”, Normalization = True. • • • As the size of the validation set increases, the training time tends to go down for most cases. The accuracy tends to go down as the validation set size increases. The best accuracy is actually obtained for validation set size of 0%, i. e. , no validation set. However this model has the risk of overfitting the training data. Hence the setting selected for further experiments is one that is likely to avoid overfitting, i. e. , one with a validation set. With a validation set of 50%, the accuracy is as low as 81%, and this could be due to the fact that less data is available for training. Setting selected is with a validation set of 10%. – First of all, this model gives very high accuracy. – Secondly, since this model is considerably fast compared to the others.
Experiment 6: Effect of Validation Threshold • Settings: Data Size = 1000, Learning Rate = 0. 4, Momentum = 0. 2, Validation Set = 10 Number of Epochs = 900, Number of Hidden Layer Units = “a”, Normalization = True. • • The accuracy stays constant at and after validation threshold = 50 The time to model is also more or less the same after validation threshold = 50 Validation thresholds of 10 and 20 require distinctly less time to model than others. The setting selected for further experiments is the one that gives highest accuracy 87. 79%, with validation threshold of 20 and time to model 32. 48 seconds.
Experiment 7: Effect of Number of Units • Settings: Data Size = 1000, Learning Rate = 0. 4, Momentum = 0. 2, Validation Set = 10 Number of Epochs = 900, Validation Threshold = 20, Normalization = True. • The number of hidden units = t = i + o requires the longest time to model and gives the lowest accuracy. • The number of hidden units = a = (i + o)/2 requires the shortest time to model and gives the highest accuracy. • The setting selected for the next experiments is the one with number of hidden units = a, which gives accuracy of 87. 79% and time to model = 32. 48 seconds
Experiment 8: Effect of 2 Hidden Layers • Settings: Data Size = 1000, Learning Rate = 0. 4, Momentum = 0. 2, Validation Set = 10 Number of Epochs = 900, Validation Threshold = 20, Normalization = True. • The highest time to model and also the lowest accuracy is obtained for “a, i”, which means “a” units in the first layer and “i” units in the second. • The fastest model is obtained with “a, o” topology. • The highest accuracy is with the “a, a” topology. This also happens to be the highest accuracy in all the experiments so far. • Hence this is considered as the best overall setting and is used for the next experiment.
Experiment 9: Effect of Normalized Attributes • Default Settings: Learning Rate = 0. 3, Momentum = 0. 2, Number of epochs = 500, Validation Set = 0, Number of Hidden Layer Units = “a” • Best Settings: Learning Rate = 0. 4, Momentum = 0. 2, Validation Set = 10, Number of Epochs = 900, Validation Threshold = 20, Hidden Units = “a, a”. • The settings without normalization give distinctly lower accuracy than those with normalization, implying that normalization favorably affects accuracy. • However the settings with normalization require much more time to model, implying that normalization makes learning slower. • The best accuracy obtained in all the covertype experiments with neural nets so far is 89. 14% with the best settings from the previous experiments and with normalization. The time required to build this model is 508. 72 seconds.
Experiments with CPU and Iris Data • CPU – Exp 1: Learning Rate varied from 0. 1 to 1. 0, other parameters default – Exp 2: Momentum varied from 0. 1 to 1. 0, best settings from above – Exp 3: Normalize Numeric Class, True / False with default and best settings • Iris – Exp 1: Number of Units in 1 hidden layer as “a”, “i”, “o”, “t”, with other parameters default – Exp 2: Number of Units in 2 hidden layers, with 1 st layer having best settings from above – Exp 3: Nominal to Binary Conversion, True / False with default settings and best settings overall
CPU Experiment 1: Effect of Learning Rate • Settings: Momentum = 0. 2, Number of epochs = 500, Validation Set = 0, Number of Hidden Layer Units = “a”, Normalize Numeric Class = True. • • The highest correlation coefficient is observed for Learning Rate 0. 1 The lowest correlation coefficient is for Learning Rate 1. 0 In general correlation coefficient decreases as learning rate increases The time to model is almost the same for this data set and is very fast compared to the CPU data set. • For the next experiment, the setting selected is the one that gives the best correlation, i. e. the one with learning rate 0. 1
CPU Experiment 2: Effect of Momentum Settings: Learning Rate = 0. 1, Number of epochs = 500, Validation Set = 0, Number of Hidden Layer Units = “a”, Normalize Numeric Class = True. • The highest correlation is achieved for momentum 0. 1 • The lowest correlation is achieved for momentum 1. 0 • For most cases, correlation coefficient has a tendency to decrease as the momentum increases • The best setting is selected as the one that shows the highest correlation. This is for momentum 0. 1
CPU Experiment 3: Effect of Normalizing Numeric Class • Default Settings: Learning Rate = 0. 3, Momentum = 0. 2 • Best Settings: Learning Rate = 0. 1, Momentum = 0. 1 • • • The default settings with no normalization give a negative correlation coefficient implying that the attributes are not well correlated For both the settings, correlation coefficient increases with normalization. The best overall setting for the CPU data set is selected as the last one in the above table, i. e. , with learning rate = 0. 1, momentum = 0. 1, normalize numeric class = true and other parameters default.
Iris Experiment 1: Effect of Units in One Hidden Layer • Settings: Learning Rate = 0. 3, Momentum = 0. 2, Number of epochs = 500, Validation Set = 0, Nominal to Binary = True • The highest accuracy is 98% observed for number of units = “i” • The lowest accuracy and also the longest time to model is observed for number of units = “t”. • The shortest time to model is for number of units = “o” • The best setting selected is the one with number of units = “i” because it gives the highest accuracy of 98%
Iris Experiment 2: Effect of Units in Two Hidden Layers • Settings: Learning Rate = 0. 3, Momentum = 0. 2, Number of epochs = 500, Validation Set = 0, Units in 1 st Hidden Layer = “i”, Nominal to Binary = True • In general two hidden layers give lower accuracy than one hidden layer for this data set. • The best accuracy obtained is for the “i, a” and “i, o” settings, however this is still lower than the best accuracy with 1 hidden layer • The lowest accuracy is for the “i, i” and “i, t” topologies. • The time to model is the longest with “i, t” topology • The fastest time to model is with “i, a” topology
Iris Experiment 3: Effect of Nominal To Binary Conversion • Default Topology: Hidden Units = “a” • Best Topology: Hidden Units = “i” • Data: Discretized Data Set • The best accuracy obtained is 96% which is still lower than the best one with the raw data set. This is without nominal to binary conversion • The lowest accuracy is obtained for the same settings with nominal to binary conversion
Summary of Results Best Models Obtained • L. R. is Learning Rate, M is Momentum, H is hidden units, V is validation set size percent and T is validation threshold. • Covertype has longest time to model, Iris has shortest • Iris gives highest accuracy
Summary (Contd. ) Comparison with Other Classifiers • CPU data set shows a negative correlation for Zero R, while the best neural net model shows a very high positive correlation of 0. 9967. • The best accuracy for Iris is 98% with neural networks which is better than that with decision trees. • Covertype gives a very high accuracy with decision trees, but best model with neural nets gives accuracy of 89. 14% which is even higher.
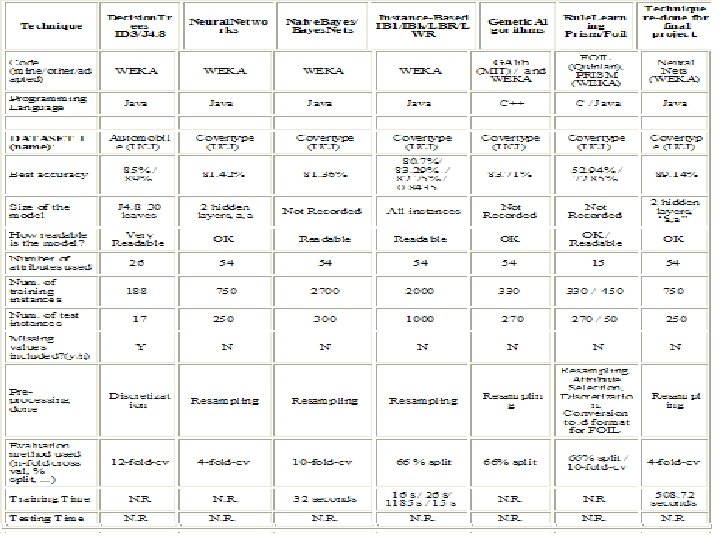
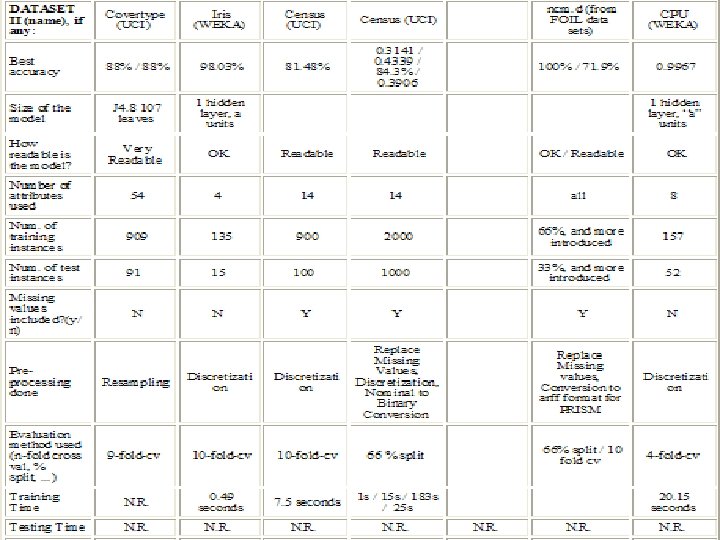
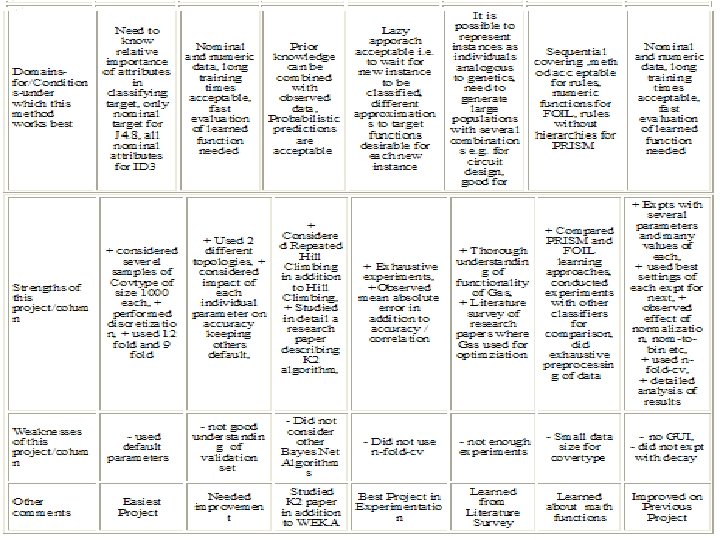
Part 2: Overview of Classifiers • • Decision Trees Neural Networks Bayesian Classifiers Genetic Algorithms Instance-Based Learning Classification Rules Final Project: Neural Networks Improved
Conclusions • • • Machine Learning: Very good course Excellent Professor Great Classmates Very Interactive, Learned a Lot Thank you…