Final Physio Lab Exam STUDY GUIDE ECG Introduction

Final Physio Lab Exam STUDY GUIDE
 is a device that picks")
ECG> Introduction • The electrocardiograph (abbreviated ECG or EKG) is a device that picks up electrical activity originating in the heart from the surface of the body. In the clinic, the ECG is one of the most commonly used diagnostic machines. The recording produced by the electrocardiograph is called an electrocardiogram, also abbreviated ECG or EKG.

Activation of the Heart and the ECG • The electrical activity of the heart originates in the sino-atrial node. • The impulse then rapidly spreads through the right atrium to the atrioventricular node. • It also spreads through the atrial muscle directly from the right atrium to the left atrium. • The P-wave is generated by activation of the muscle of both atria.

Activation of the Heart and the ECG • The impulse travels very slowly through the AV node, then very quickly through the bundle of His, then the bundle branches, the Purkinje network, and finally the ventricular muscle. .

Activation of the Heart and the ECG • The first area of the ventricular muscle to be activated is the interventricular septum, which activates from left to right. • This generates the Q -wave.

Activation of the Heart and the ECG • Next, the left and right ventricular free walls, which form the bulk of the muscle of both ventricles, gets activated, with the endocardial surface being activated before the epicardial surface. • This generates the R-wave.

Activation of the Heart and the ECG • A few small areas of the ventricles are activated at a rather late stage. • This generates the Swave.

Activation of the Heart and the ECG • Finally, the ventricular muscle repolarizes. • This generates the T-wave.
 The Timing of the Heart Sounds • One member of the group listens")
5) The Timing of the Heart Sounds • One member of the group listens with the stethoscope to the subject's heartbeat to determine where the two well-separated heart sounds fall on the ECG trace.
 The Timing of the Heart Sounds • The first heart sound S 1")
5) The Timing of the Heart Sounds • The first heart sound S 1 is due to the closure of the mitral and tricuspid valves at the start of ventricular systole. The second heart sound S 2 is due to the closure of the aortic and pulmonary valves.
 Changes in Morphology with Leads • The three following leads were recorded in")
6) Changes in Morphology with Leads • The three following leads were recorded in one particular individual. • There is no guarantee that the ECG recorded by your group will be similar to those three traces, since there is large interindividual variability in the ECG.
 of the major")
Recall that the R wave is due to the activation (depolarization) of the major portion of the ventricles. • From the sample data above, it is evident that the lead whose axis is most parallel to the direction of the subject's ventricular depolarization is lead II. (The R wave is largest in lead II. ) • The R wave is very small in lead I. We can therefore conclude that for this subject the direction of ventricular depolarization is more close to being perpendicular to lead I. 6) Changes in Morphology with Leads

The Sphygmomanometer • A sphygmomanometer, an instrument that measures pressure, is needed in both methods. • Each sphygmomanometer consists of a cuff (containing a "bladder") which is connected by lengths of tubing to an inflating bulb with a needle valve and to an aneroid pressure gauge.

Blood Pressure Chart

Blood Pressure Tracing: Using The Direct Method • The figure to the left shows a typical tracing of the blood pressure recorded from an artery using the direct method. • The maximum pressure is called the systolic pressure; the minimum pressure is called the diastolic pressure. • The pulse pressure is the difference between the systolic and diastolic pressures. • The mean pressure is given approximately by the sum of the diastolic pressure and one third of the pulse pressure.

Errors in blood pressure readings: • The cuff is not of the proper size: if the cuff is too small the blood pressure readings may be artefactually high. • If the cuff is too big, the readings may be artefactually low.

Errors in blood pressure readings: The cuff is positioned too loosely: the blood pressure may be artefactually high.

Errors in blood pressure readings: The center of the cuff bladder is not positioned over the brachial artery.

Errors in blood pressure readings: • The cuff is inflated too slowly: a slow inflation causes venous congestion, which in turn causes the Korotkoff sounds to be faint; this results in false readings with the systolic value being too low and the diastolic reading too high.

Urinalysis • They are routinely used are regular doctor appointments and hospital settings to determine if patients have • Infections • Diabetes • Renal issues • Liver issues • Metabolic issues • Other conditions

According to the American Association for Clinical Chemistry, the average value for urine p. H is 6. 0. Measuring Urine p. H Safe p. H range is from 4. 5 to 8. 0. Urine under 5. 0 is acidic Urine higher than 8. 0 is alkaline, or basic.

High Urine p. H – Alkaline • Urine higher than 8. 0 is alkaline, or basic. • If a person has a high urine p. H, meaning that it is more alkaline, it might signal a medical condition such as: • kidney stones • urinary tract infections (UTIs) • kidney-related disorders • prolonged vomiting • kidney stone formation

Low Urine p. H – Acidic • Urine under 5. 0 is acidic • If a person has low urine p. H, meaning that it is more acidic, it might indicate a medical condition such as: • diabetic ketoacidosis • diarrhea • starvation

The normal amount of glucose in urine is 0 to 0. 8 mmol/L (millimoles per liter). Urine glucose concentration A higher measurement could be a sign of a health problem. Diabetes is the most common cause of elevated glucose levels. Renal glycosuria can cause urine glucose levels to be high even if blood glucose levels are normal.

Urine glucose concentration

Urine glucose concentration - renal glycosuria • in those with renal glycosuria, glucose is abnormally elevated in the urine due to improper functioning of the renal tubules, which are primary components of nephrons, the filtering units of the kidneys.

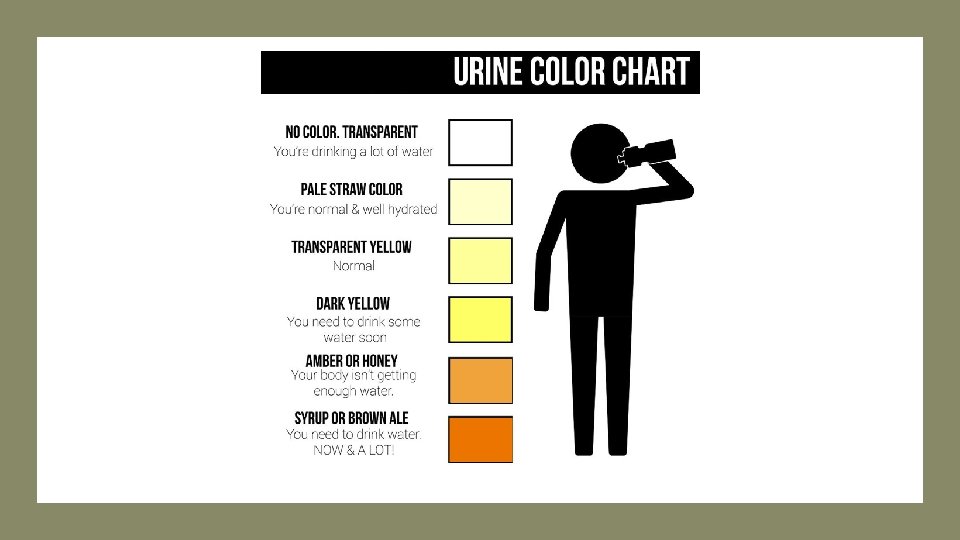
Urine specific gravity

Ideally, urine specific gravity results will fall between 1. 002 and 1. 030 if your kidneys are functioning normally. Urine specific gravity Specific gravity results above 1. 010 can indicate mild dehydration. The higher the number, the more dehydrated you may be.

Normal values are 0 to 20 mg/d. L. Urine Protein Concentration For a 24 -hour urine collection, the normal value is less than 80 mg per 24 hours. The protein urine dipstick test measures the presence of proteins, such as albumin, in a urine sample.

Urine Protein Concentration • Larger amounts of protein in the urine may be due to: • Heart failure • Kidney problems, such as • kidney damage • diabetic kidney disease • Kidney cysts • Loss of body fluids (dehydration) • Problems during pregnancy, such as • seizures due to eclampsia • high blood pressure caused by preeclampsia • Urinary tract problems, such as a bladder tumor or infection • Multiple myeloma This Photo by Unknown Author is licensed under CC BY-NC-ND

There are four major blood groups • There are four major blood groups determined by the presence or absence of two antigens – A and B – on the surface of red blood cells. • Type A • Type B • Type AB • Type O

A Person with Blood Type A has Type A Antigens on their Red Blood Cells and Anti-B Antibodies in their Blood Plasma.

Blood Type A A Person with Blood Type A has Type A Antigens on their Red Blood Cells and Anti -B Antibodies in their Blood Plasma.

A Person with Blood Type B has Type B Antigens on their Red Blood Cells and Anti-A Antibodies in their Blood Plasma.

Blood Type B • A Person with Blood Type B has Type B Antigens on their Red Blood Cells and Anti-A Antibodies in their Blood Plasma.

A Person with Blood Type AB has both Type A Antigens and Type B Antigens on their Red Blood Cells and NO Antibodies in their Blood Plasma.

Blood Type AB • A Person with Blood Type AB has both Type A Antigens and Type B Antigens on their Red Blood Cells and NO Antibodies in their Blood Plasma.

A Person with Blood Type 0 will have no Antigens on their Red Blood Cells, but will have both Anti-A and Anti-B Antibodies in their Blood Plasma.

Blood Type 0 • A Person with Blood Type 0 will have no Antigens on their Red Blood Cells, but will have both Anti-A and Anti-B Antibodies in their Blood Plasma.
 to ALL")
Blood Transfusions • Blood Type O can give blood (red blood cells) to ALL recipients (Blood Type A, Blood Type B, Blood Type AB and Blood Type O). • This means Blood Type O is the “universal donor”.
 to recipients with")
Blood Transfusions Blood Type A can give blood (red blood cells) to recipients with Blood Type A or Blood Type AB.
 to recipients with")
Blood Transfusions Blood Type B can give blood (red blood cells) to recipients with Blood Type B or Blood Type AB.
 to recipients with")
Blood Transfusions Blood Type B can give blood (red blood cells) to recipients with Blood Type B or Blood Type AB.
 is a chemical reaction")
II. Background Information. • Cellular respiration (see chemical reaction below) is a chemical reaction that occurs in your cells to create energy; when you are exercising your muscle cells are creating ATP to contract. • Cellular respiration requires oxygen (which is breathed in) and creates carbon dioxide (which C 6 H 12 O 6 + 6 O 2 is breathed out). 6 H 2 O + 6 CO 2 + 36 ATP
 affects the")
II. Background Information. This lab will address how exercise (increased muscle activity) affects the rate of cellular respiration. • You will measure 3 different indicators of cellular respiration: 1. breathing rate 2. heart rate 3. carbon dioxide production • You will measure these indicators at rest (with no exercise) and after 1 and 2 minutes of exercise. • Breathing rate is measured in breaths per minute

II. Background Information. • Carbon dioxide production can be measured by breathing through a straw into a solution of sodium carbonate combined with phenolphthalein and timing how long it takes for the solution to turn from pink to clear. • Phenolphthalein is an

II. Background Information. • Watch the video to see a demonstration of how exhaling into phenolphthalein sodium bicarbonate solution through a straw, causes the solution to change colors – from pink to clear.

II. Background Information. • When carbon dioxide reacts with water, a weak acid (carbonic acid) is formed (see chemical reaction below). • The more carbon dioxide 6 CO 2 + 6 into H 2 O you breathe 6 solution, the 6 faster HCO 3 + H+ it will

- Paper cup - Sodium Carbonate Solution - Straw - Stopwatch / Timer Materials:

Sodium Carbonate Solution The sodium carbonate solution is a large volume of water (1000 m. L) with a small amount of sodium carbonate (Na 2 CO 3) (~1 gram) and a few drops of phenolphthalein solution (acid-base indicator) to turn the solution pink. Sodium carbonate, while commonly available in science labs, can also be found as washing soda or soda ash. Exact measurements are not important but you will want to test your solution prior to the lab to ensure it will change color in the time needed. You can adjust the concentrations as needed.

Phenolphthalein • Phenolphthalein is a bright fuchsia color when added to a basic solution (such as the sodium carbonate); it turns colorless when its p. H drops below 8. 2. • The phenolphthalein molecule is colorless; however, the phenolphthalein ion is pink.

Phenolphthalein • When a base is added to the phenolphthalein, the molecule ⇌ ions' equilibrium shifts to the right, leading to more ionization as H+ ions are removed. • This is predicted by Le Chatelier's principle. 6 CO 2 + 6 H 2 O 6 HCO 3 + 6 H+

Meet Your Virtual Lab Partners Joe You have 3 Lab Partners that will do the physical part of the lab with you! • Jessica • Joe • Jane Jessica
 • Measuring Carbon Dioxide Production: 1. Jessica is using")
PART A: Resting (no exercise) • Measuring Carbon Dioxide Production: 1. Jessica is using a straw, exhale into the solution. 2. It took 5 seconds for the solution to change color.
- Slides: 55