Final Exam Review Announcements Final Exam Articles have


 does the average working adult spend")


- Slides: 18
Final Exam Review
Announcements ● Final Exam Articles have been posted to mth 101. com ● We will be dropping TWO Labs and Snapshots
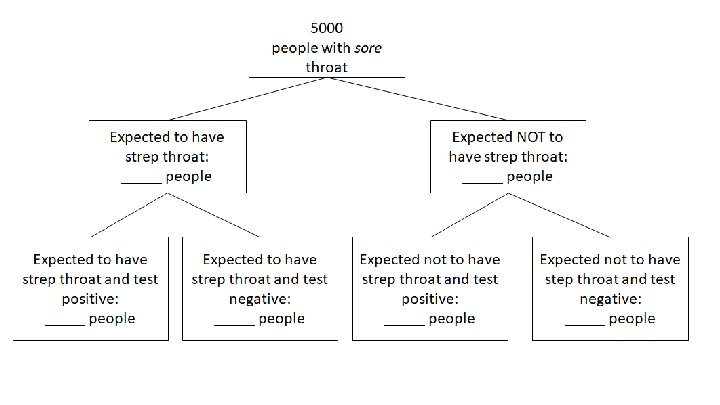
Example 1 Suppose a new test is developed to test for strep throat. Suppose that about 1% of people who go to the doctor with a sore throat will have strep throat. Suppose this new test has a sensitivity of 95% and a specificity of 92%. Fill in the tree diagram below.
Example 1 Cont… Suppose Gwenn has sore throat, goes to the doctor, takes the test, and receives a positive result. There is a ______ % chance that Gwenn has strep throat (PPV). There is a ______ % chance that Gwenn does not have strep throat. Suppose Sam has sore throat, goes to the doctor, takes the test, and receives a negative result. There is a ______ % chance that Sam has strep throat. There is a ______ % chance that Sam does not have strep throat (NPV). Using the values above, out of every 20, 000 people who test positive for strep throat, we’d expect _______ to actually have strep throat, and the other ________ to not have strep throat.
Example 2 How many 12 oz cans of soda are consumed during the 7 fall semester home football games on MSU’s campus?
Example 3 How much money (in US dollars) does the average working adult spend on gas for 1 year?
Example 5 Write a sentence describing each of the numbers below based on the corresponding figures. (Articles on mth 101. com) a. 6. 3 in Fig. A on page 1. b. 36 in Fig. B on page 2. c. 12, 478 in Fig. C on page 3.
Example 6 Use Fig. B on page 2 and Fig. C on page 3 to determine the income of the 90 th percentile of whites in 1970. Show all work necessary for the calculation and round to the nearest dollar.
Example 7 According to Fig. D on page 3, between 2000 and 2010, the 90 th percentile of income distribution had the largest absolute decrease in income. Does this mean that the 90 th percentile also had the largest percent decrease? Explain why or why not in a complete sentence.
Example 8 From Fig. E on page 4, we can deduce that the total percent change from 1970 to 2016 for the median income is -2% + 47% = 45%. a. Is the statement above TRUE or FALSE? b. Explain your reasoning in a complete sentence.
Example 9 Use the number 96% from Fig. G on page 6 in a complete sentence in the context of this article.
Example 10 Which of the following statements are true based on Fig. G on page 6? Circle TRUE or FALSE for each statement. a. In 2000, Asians in the 5 th percentile of the income distribution made 63% of the income of whites in the 5 th percentile of the income distribution. TRUE FALSE b. In 2000, the incomes of Asians went up from 63% to 98% of whites’ income over the course of the year. TRUE FALSE c. In 2016, all Asians in the top half of the income distribution made more than all whites in the top half of the income distribution. TRUE FALSE
Example 11 Use Fig. 2 on page 9 to fill in the blanks. Note that the point corresponding to Hungary as at the bottom center of the figure. a. The percentage of Hungarians who answered “very happy” or “rather happy” is ______%. b. Hungarians’ average guess regarding the percentage of people in their country who answered “very happy” or “rather happy” is ______%.
Example 12 Consider the following statement, based on Fig. 3, page 10: “In 2006 the standard deviation of answers to the World Value Survey by people in the United States was greater than the standard deviation of answers to the World Value Survey by people in Great Britain. ” Does this mean that people in the United States are happier than people in Great Britain? Explain.
Example 13 Answer the questions below based on the corresponding figures. In Fig. 1 on page 8, what does it mean that the bar associated with 8 for Latin America & Caribbean is above the dash? In Fig. 2 on page 9, what does it mean that all of the dots are below the line? In Fig. 3 on page 10, what does it mean that the graph for the United States is going up from 1990 to 1995?
Example 13 Answer the questions below based on the corresponding figures. In Fig. 4 on page 11, what does the size of the circle mean? In Fig. 4 on page 11, what is Hong Kong’s GDP per capita and average life satisfaction? In Fig. 4 on page 11, are the two variables correlated? If they are, do you think there is a causation between the two or a lurking variable that explains the correlation? Describe in a few sentences what the second plot in Fig. 5 on page 12 is saying.
Example 14 In Fig. 2 on page 9 we can see that about 90% of South Koreans answered that they were “very happy” or “rather happy” and about 72% of Russians answered the same. Explain if this means that the number of South Koreans who are “very happy” or “rather happy” is higher than the number of Russians.