
FIGURES FOR CHAPTER 13 ANALYSIS OF CLOCKED SEQUENTIAL
- Slides: 28
FIGURES FOR CHAPTER 13 ANALYSIS OF CLOCKED SEQUENTIAL CIRCUITS This chapter in the book includes: Objectives Study Guide 13. 1 A Sequential Parity Checker 13. 2 Analysis by Signal Tracing and Timing Charts 13. 3 State Tables and Graphs 13. 4 General Models for Sequential Circuits Programmed Exercise Problems Click the mouse to move to the next page. Use the ESC key to exit this chapter. © 2004 Brooks/Cole
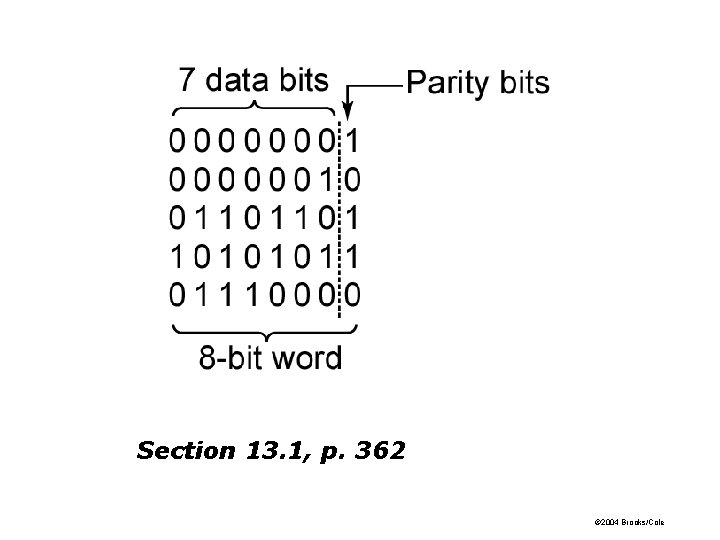
Section 13. 1, p. 362 © 2004 Brooks/Cole
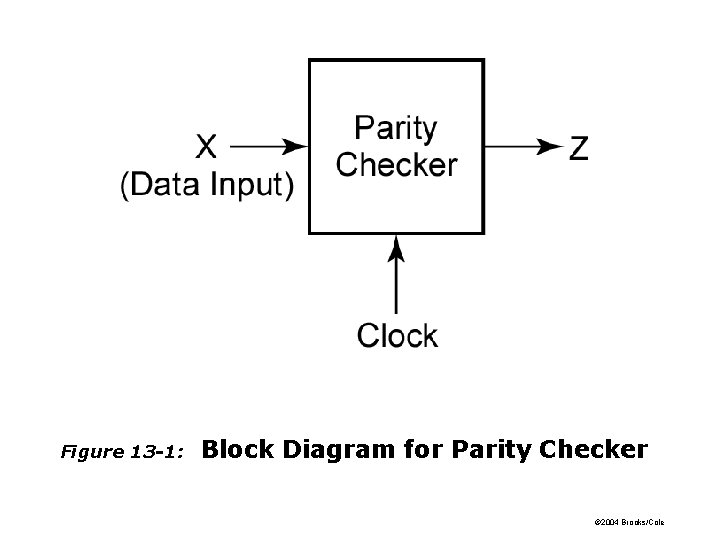
Figure 13 -1: Block Diagram for Parity Checker © 2004 Brooks/Cole
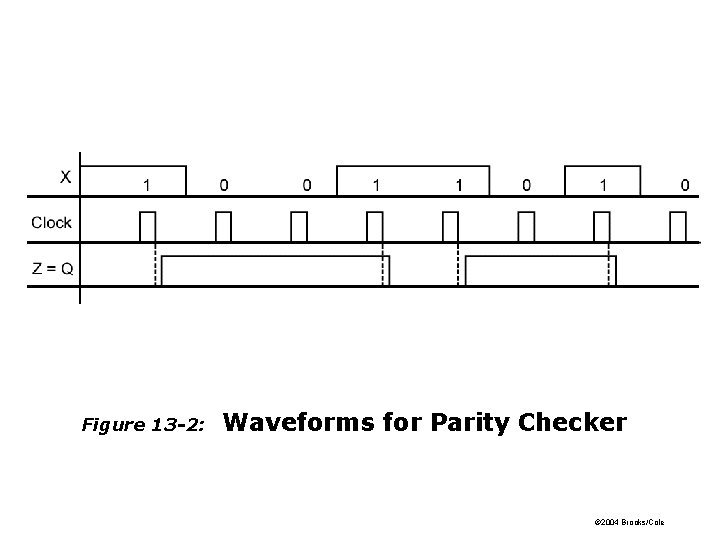
Figure 13 -2: Waveforms for Parity Checker © 2004 Brooks/Cole
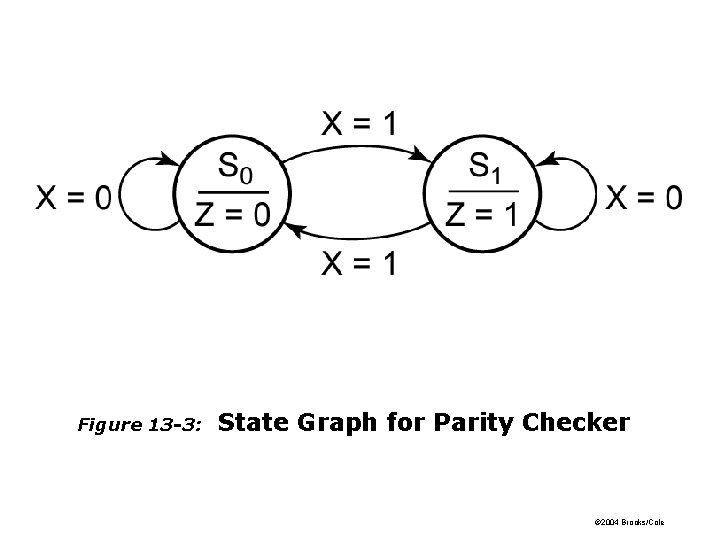
Figure 13 -3: State Graph for Parity Checker © 2004 Brooks/Cole
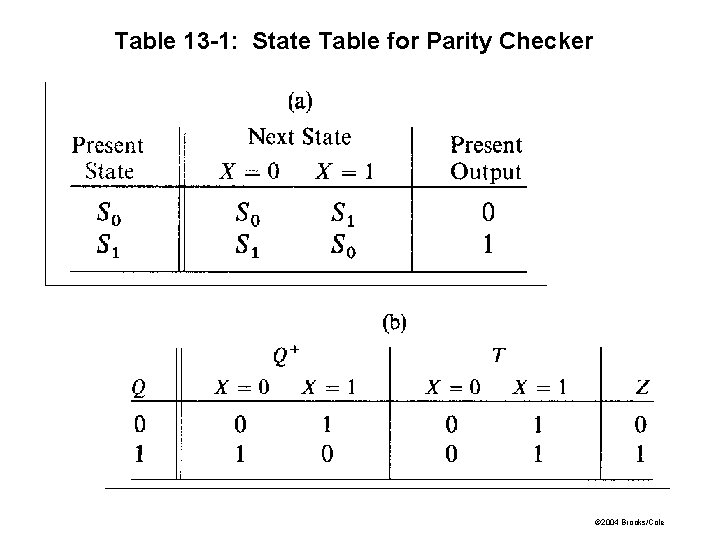
Table 13 -1: State Table for Parity Checker © 2004 Brooks/Cole
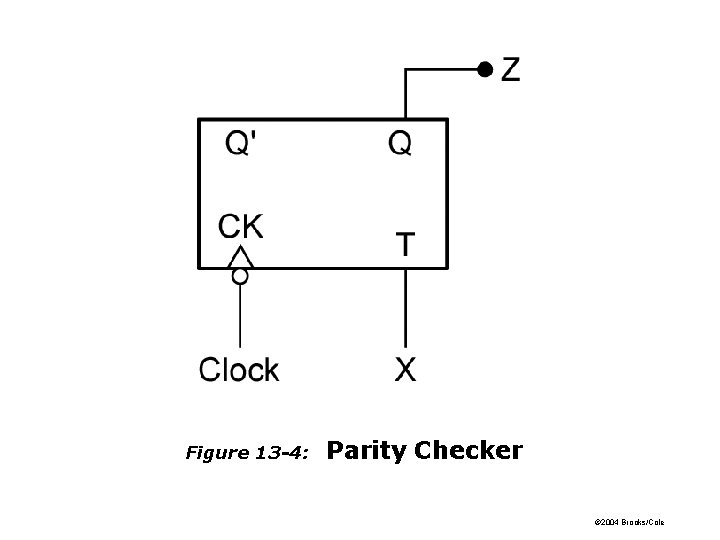
Figure 13 -4: Parity Checker © 2004 Brooks/Cole
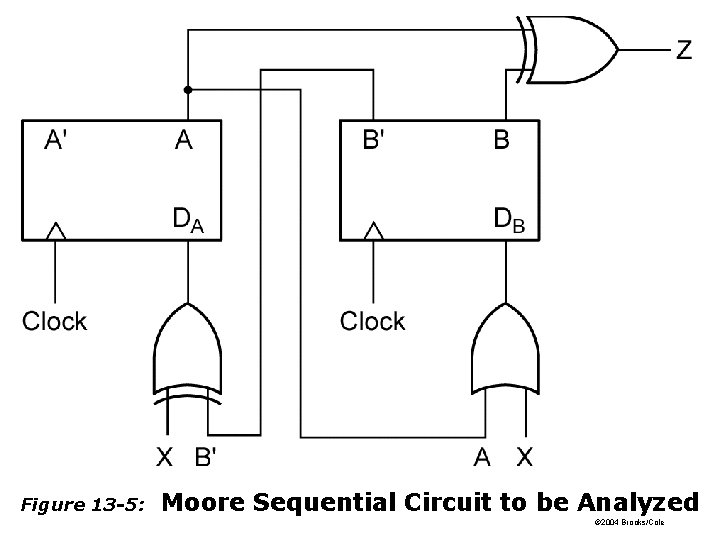
Figure 13 -5: Moore Sequential Circuit to be Analyzed © 2004 Brooks/Cole
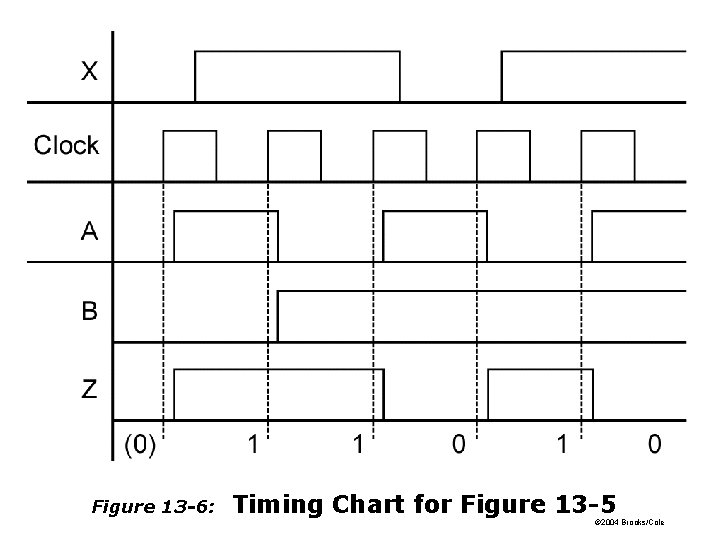
Figure 13 -6: Timing Chart for Figure 13 -5 © 2004 Brooks/Cole
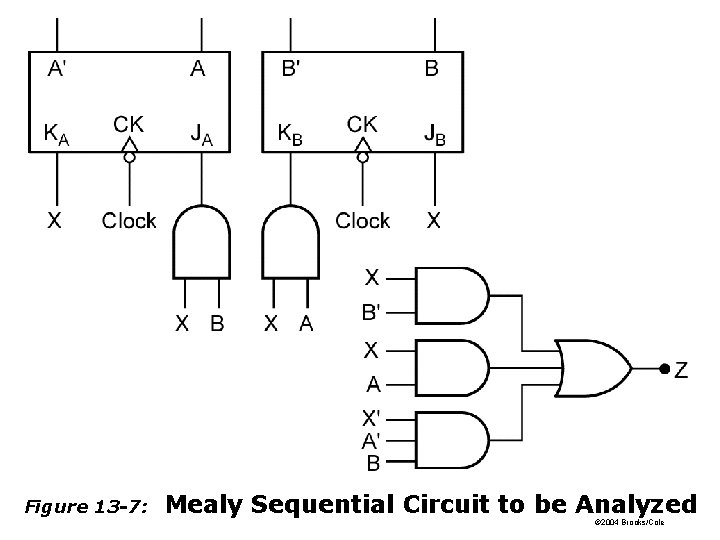
Figure 13 -7: Mealy Sequential Circuit to be Analyzed © 2004 Brooks/Cole
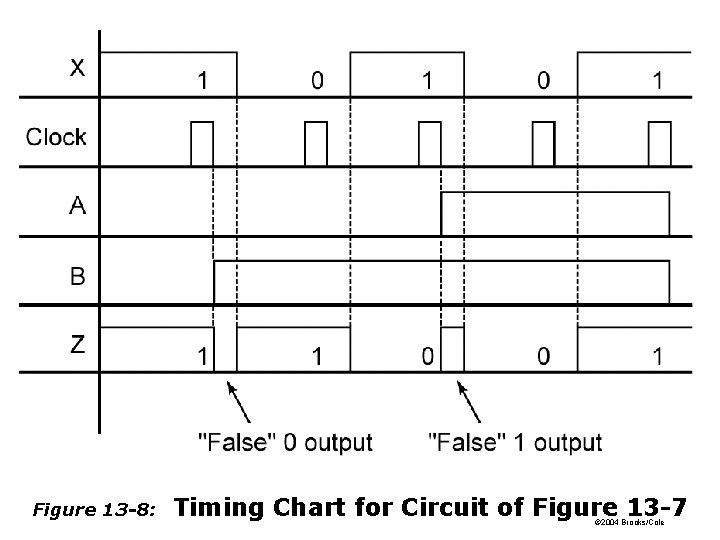
Figure 13 -8: Timing Chart for Circuit of Figure 13 -7 © 2004 Brooks/Cole
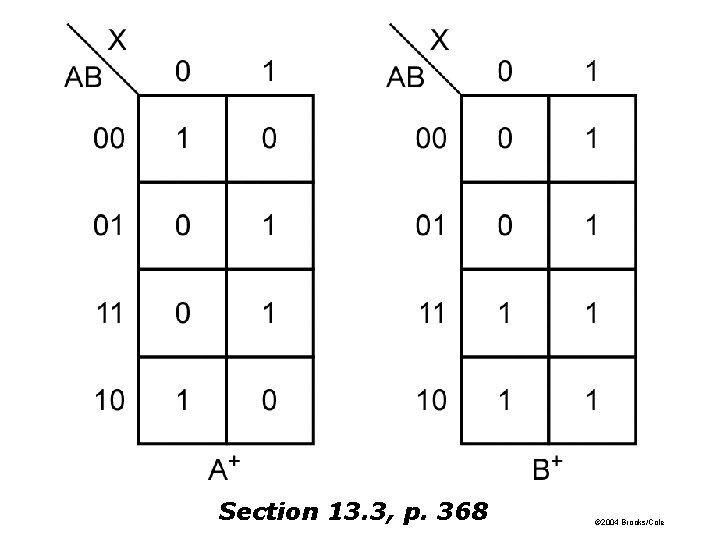
Section 13. 3, p. 368 © 2004 Brooks/Cole
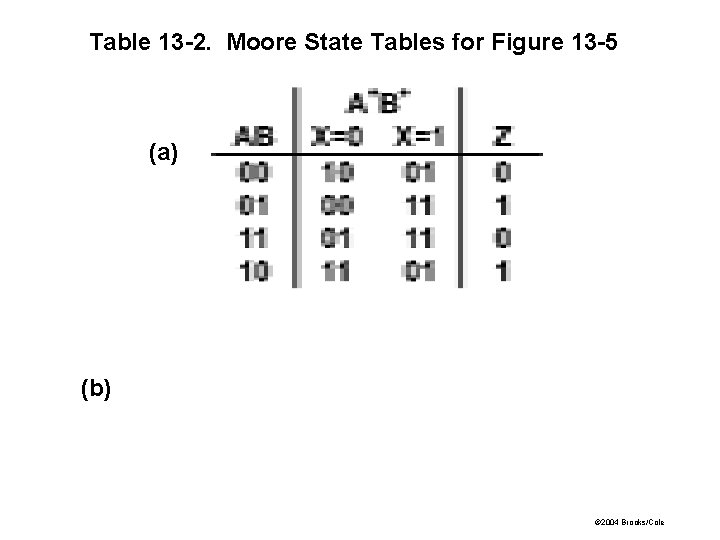
Table 13 -2. Moore State Tables for Figure 13 -5 (a) (b) © 2004 Brooks/Cole
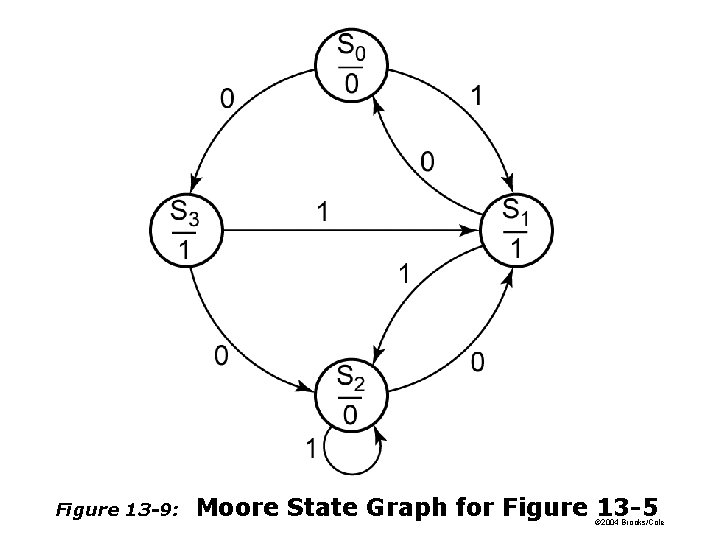
Figure 13 -9: Moore State Graph for Figure 13 -5 © 2004 Brooks/Cole
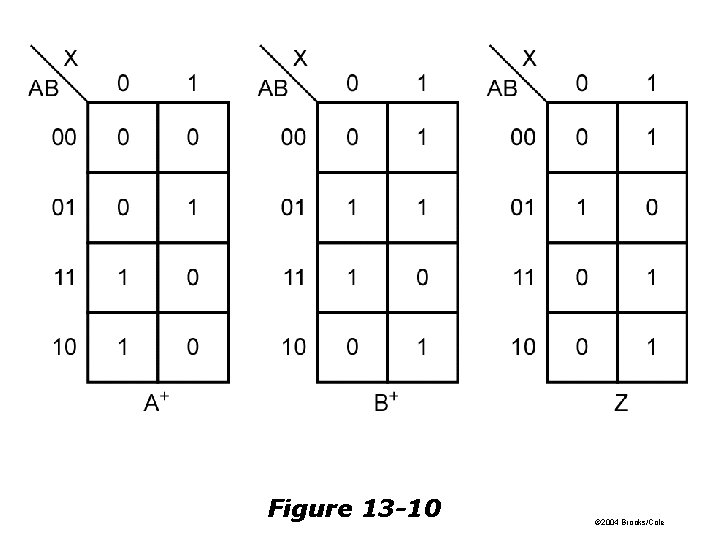
Figure 13 -10 © 2004 Brooks/Cole
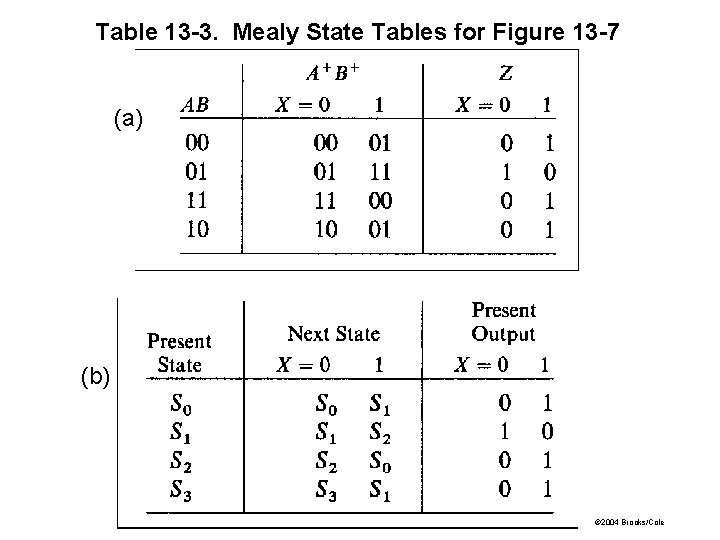
Table 13 -3. Mealy State Tables for Figure 13 -7 (a) (b) © 2004 Brooks/Cole
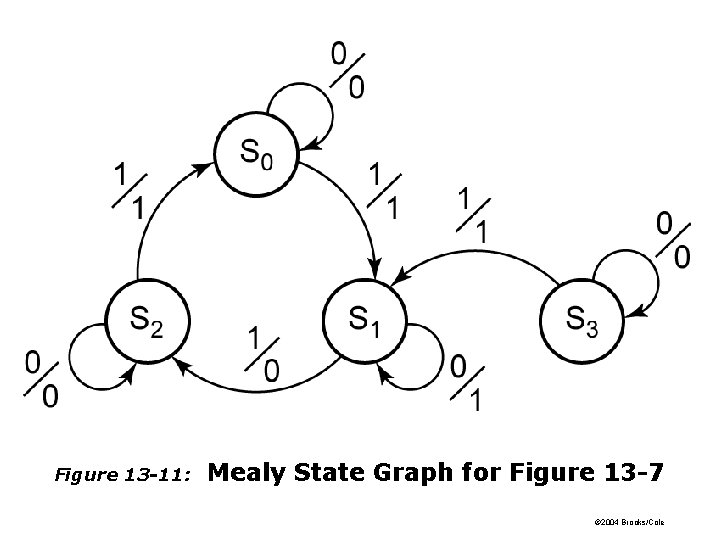
Figure 13 -11: Mealy State Graph for Figure 13 -7 © 2004 Brooks/Cole
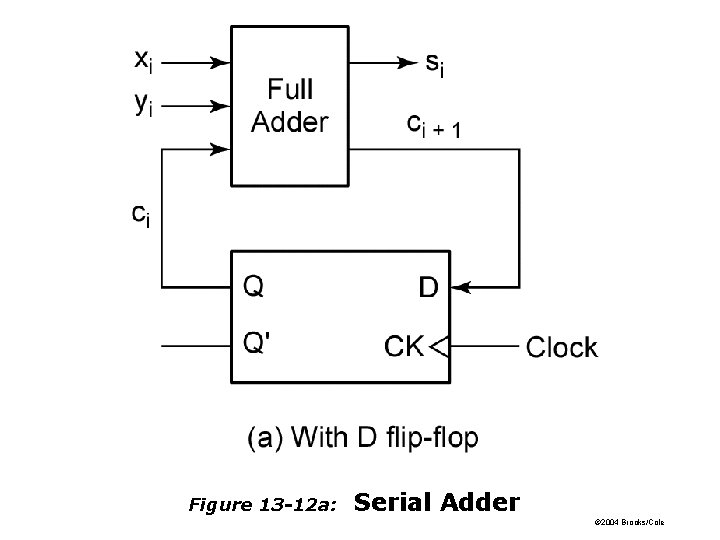
Figure 13 -12 a: Serial Adder © 2004 Brooks/Cole
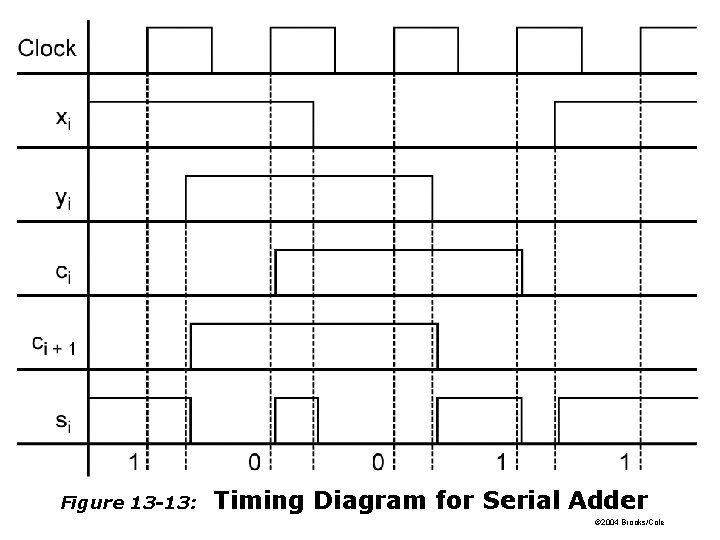
Figure 13 -13: Timing Diagram for Serial Adder © 2004 Brooks/Cole
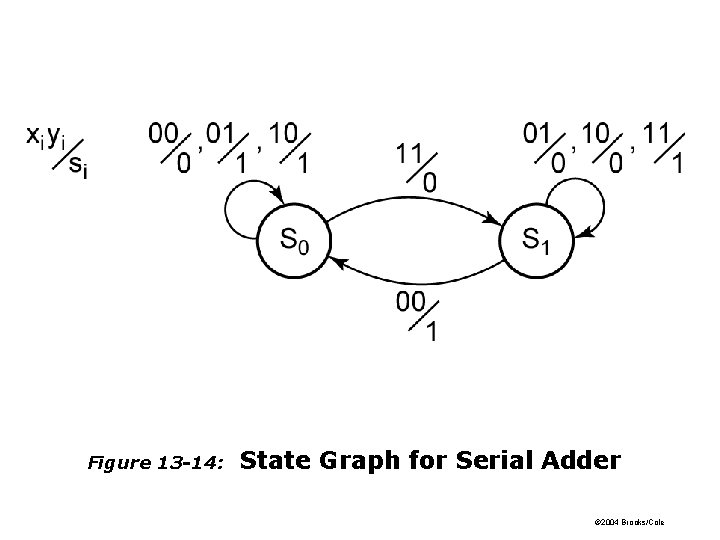
Figure 13 -14: State Graph for Serial Adder © 2004 Brooks/Cole
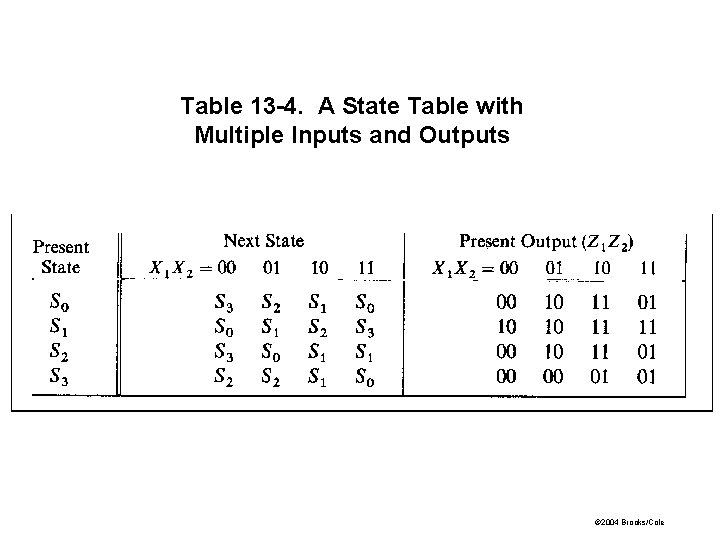
Table 13 -4. A State Table with Multiple Inputs and Outputs © 2004 Brooks/Cole
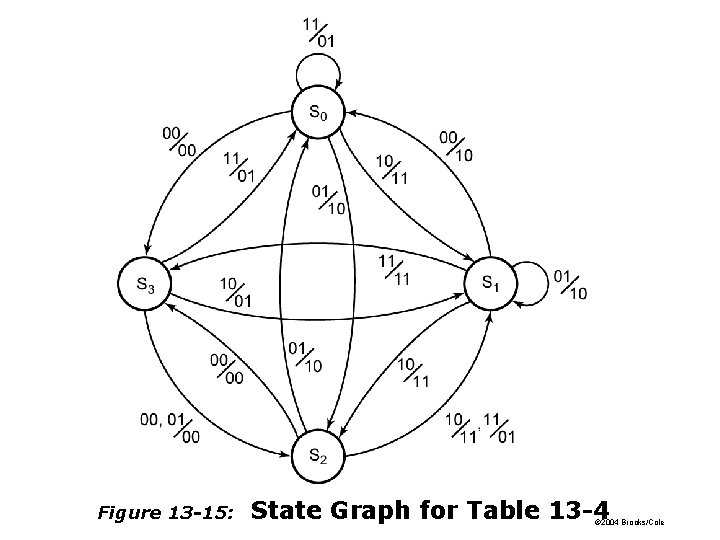
Figure 13 -15: State Graph for Table 13 -4 © 2004 Brooks/Cole
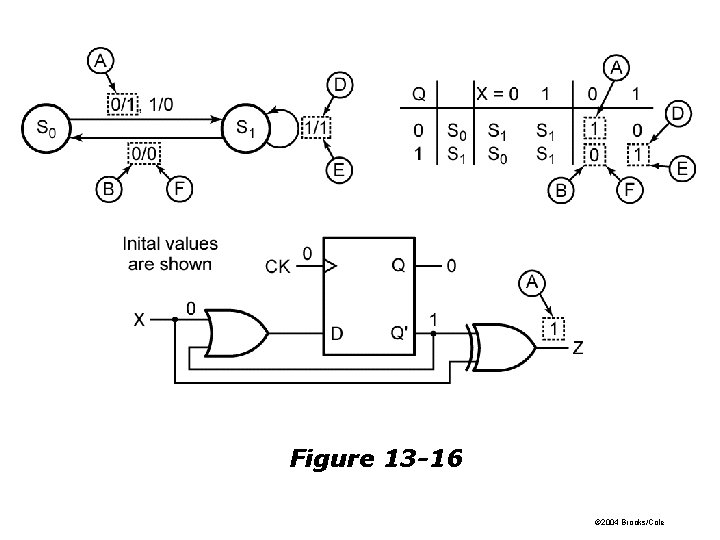
Figure 13 -16 © 2004 Brooks/Cole
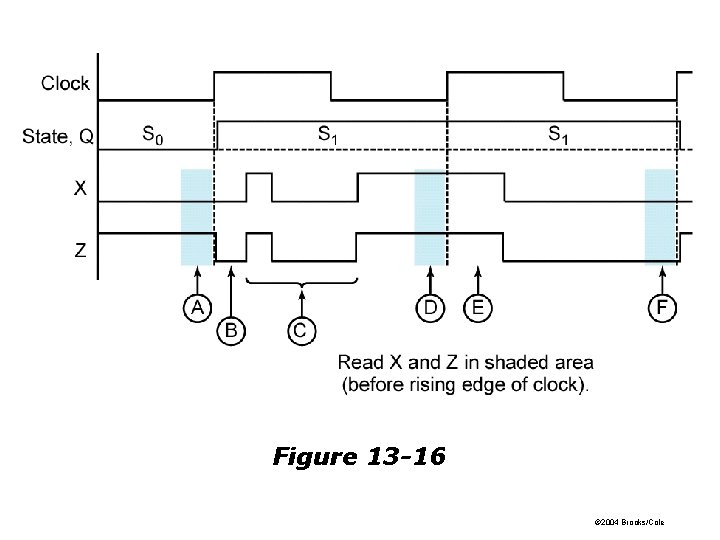
Figure 13 -16 © 2004 Brooks/Cole
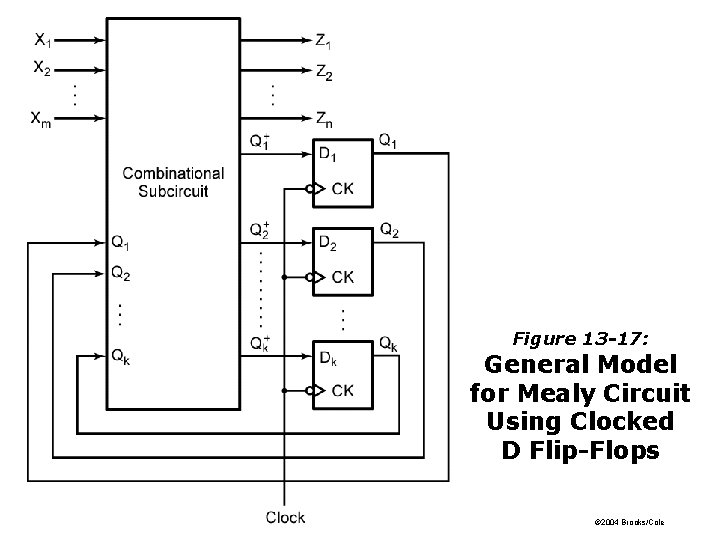
Figure 13 -17: General Model for Mealy Circuit Using Clocked D Flip-Flops © 2004 Brooks/Cole
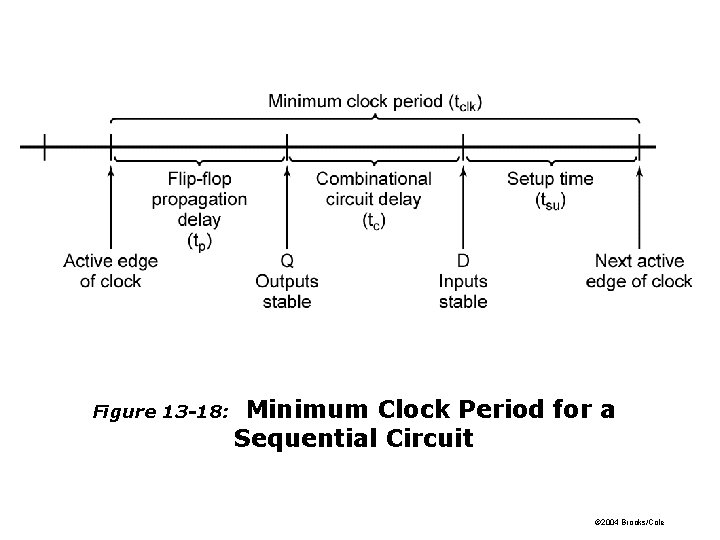
Figure 13 -18: Minimum Clock Period for a Sequential Circuit © 2004 Brooks/Cole
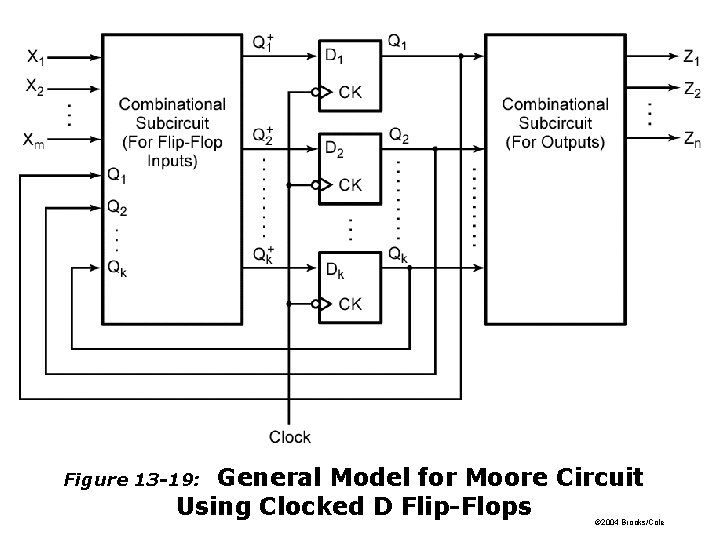
General Model for Moore Circuit Using Clocked D Flip-Flops Figure 13 -19: © 2004 Brooks/Cole
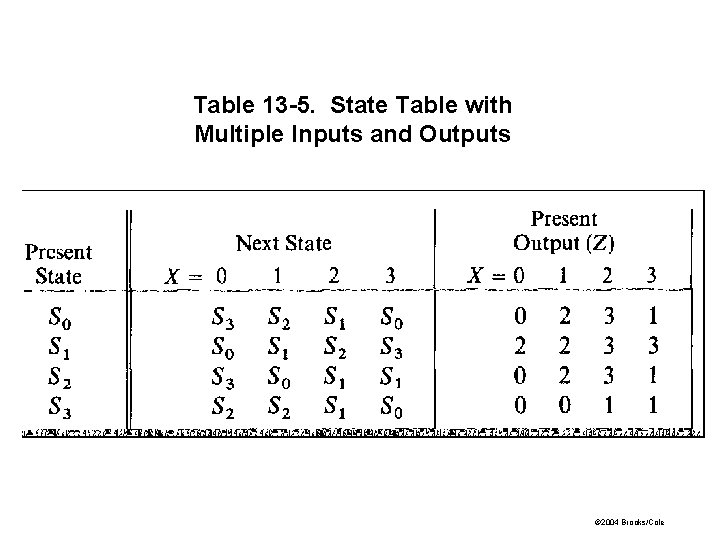
Table 13 -5. State Table with Multiple Inputs and Outputs © 2004 Brooks/Cole