
Figures are past results and are not predictive

- Slides: 16
Figures are past results and are not predictive of results in future periods. Investments are not FDIC-insured, nor are they deposits of or guaranteed by a bank or any other entity, so they may lose value. © 2013 American Funds Distributors, Inc. AI-36904 -A
© American Funds Distributors, Inc. V 4 AI-34974
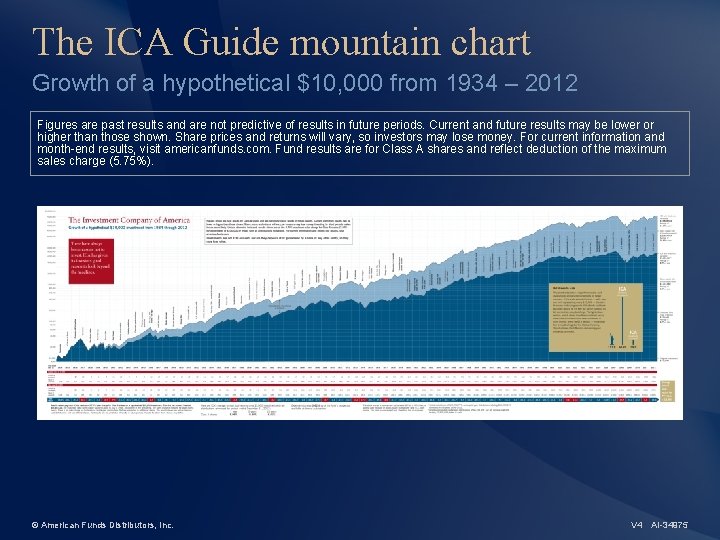
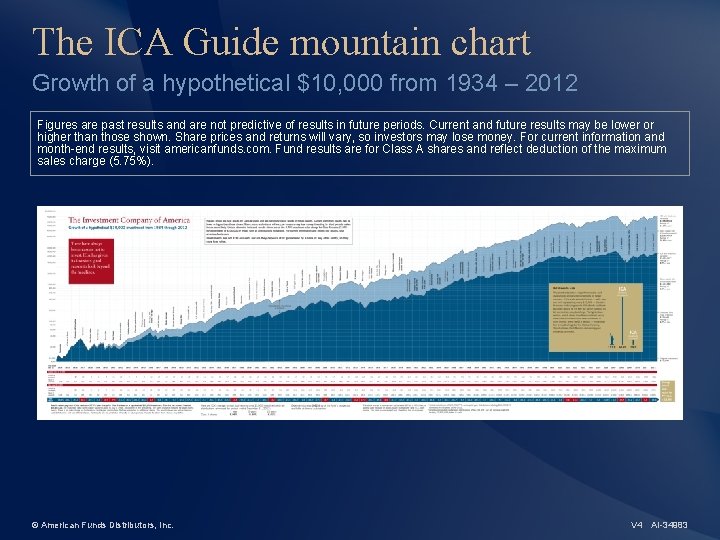
The ICA Guide mountain chart Growth of a hypothetical $10, 000 from 1934 – 2012 Figures are past results and are not predictive of results in future periods. Current and future results may be lower or higher than those shown. Share prices and returns will vary, so investors may lose money. For current information and month-end results, visit americanfunds. com. Fund results are for Class A shares and reflect deduction of the maximum sales charge (5. 75%). © American Funds Distributors, Inc. V 4 AI-34975
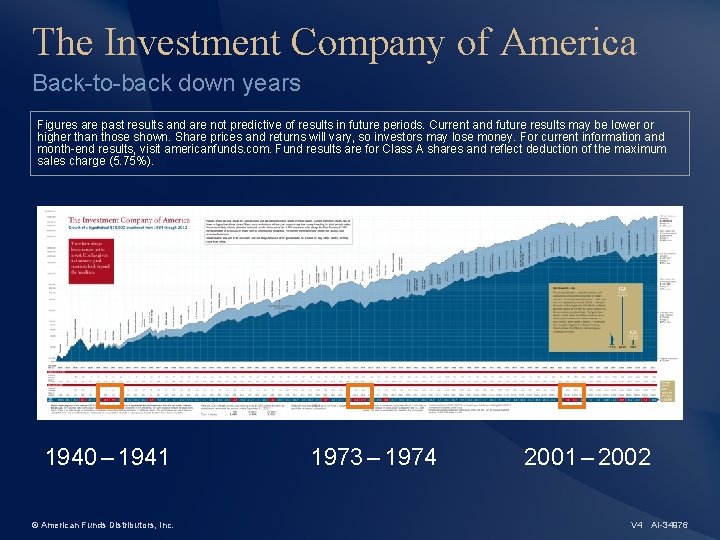
The Investment Company of America Back-to-back down years Figures are past results and are not predictive of results in future periods. Current and future results may be lower or higher than those shown. Share prices and returns will vary, so investors may lose money. For current information and month-end results, visit americanfunds. com. Fund results are for Class A shares and reflect deduction of the maximum sales charge (5. 75%). 1940 – 1941 © American Funds Distributors, Inc. 1973 – 1974 2001 – 2002 V 4 AI-34976
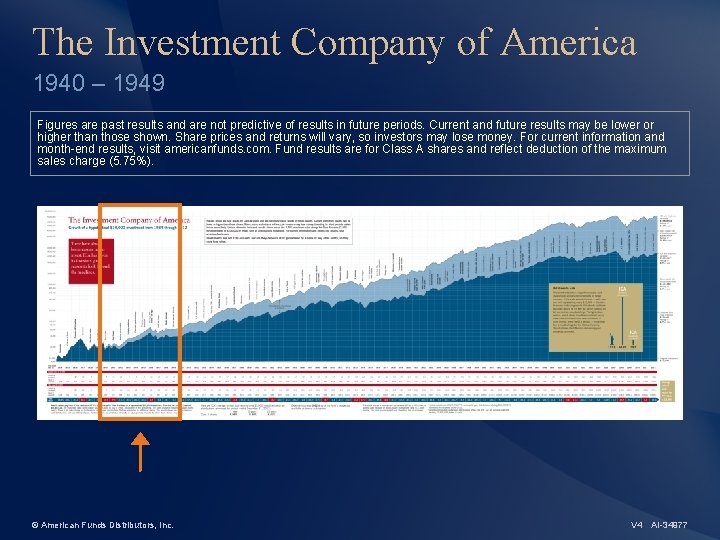
The Investment Company of America 1940 – 1949 Figures are past results and are not predictive of results in future periods. Current and future results may be lower or higher than those shown. Share prices and returns will vary, so investors may lose money. For current information and month-end results, visit americanfunds. com. Fund results are for Class A shares and reflect deduction of the maximum sales charge (5. 75%). © American Funds Distributors, Inc. V 4 AI-34977
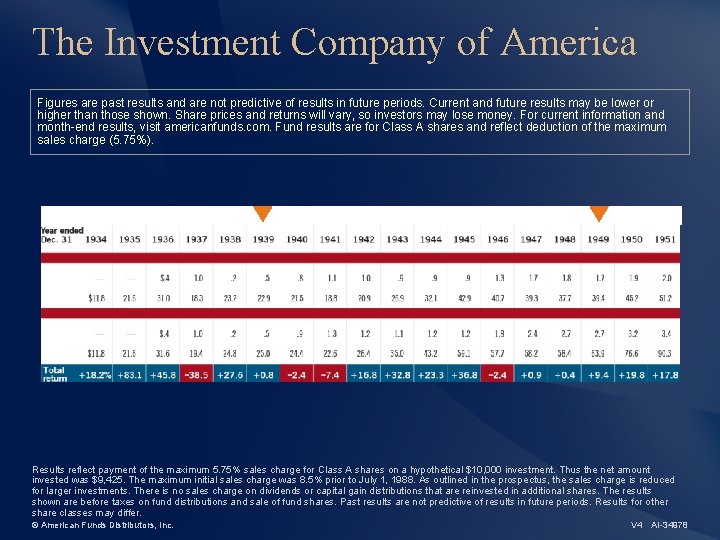
The Investment Company of America Figures are past results and are not predictive of results in future periods. Current and future results may be lower or higher than those shown. Share prices and returns will vary, so investors may lose money. For current information and month-end results, visit americanfunds. com. Fund results are for Class A shares and reflect deduction of the maximum sales charge (5. 75%). Results reflect payment of the maximum 5. 75% sales charge for Class A shares on a hypothetical $10, 000 investment. Thus the net amount invested was $9, 425. The maximum initial sales charge was 8. 5% prior to July 1, 1988. As outlined in the prospectus, the sales charge is reduced for larger investments. There is no sales charge on dividends or capital gain distributions that are reinvested in additional shares. The results shown are before taxes on fund distributions and sale of fund shares. Past results are not predictive of results in future periods. Results for other share classes may differ. © American Funds Distributors, Inc. V 4 AI-34978
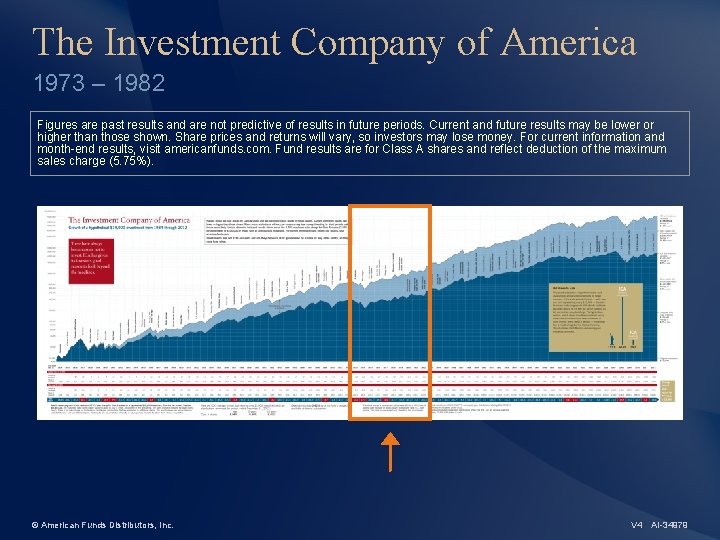
The Investment Company of America 1973 – 1982 Figures are past results and are not predictive of results in future periods. Current and future results may be lower or higher than those shown. Share prices and returns will vary, so investors may lose money. For current information and month-end results, visit americanfunds. com. Fund results are for Class A shares and reflect deduction of the maximum sales charge (5. 75%). © American Funds Distributors, Inc. V 4 AI-34979
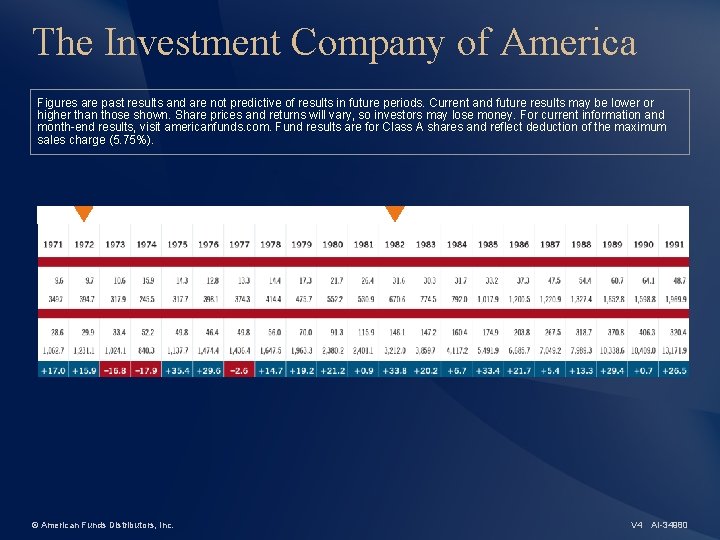
The Investment Company of America Figures are past results and are not predictive of results in future periods. Current and future results may be lower or higher than those shown. Share prices and returns will vary, so investors may lose money. For current information and month-end results, visit americanfunds. com. Fund results are for Class A shares and reflect deduction of the maximum sales charge (5. 75%). © American Funds Distributors, Inc. V 4 AI-34980
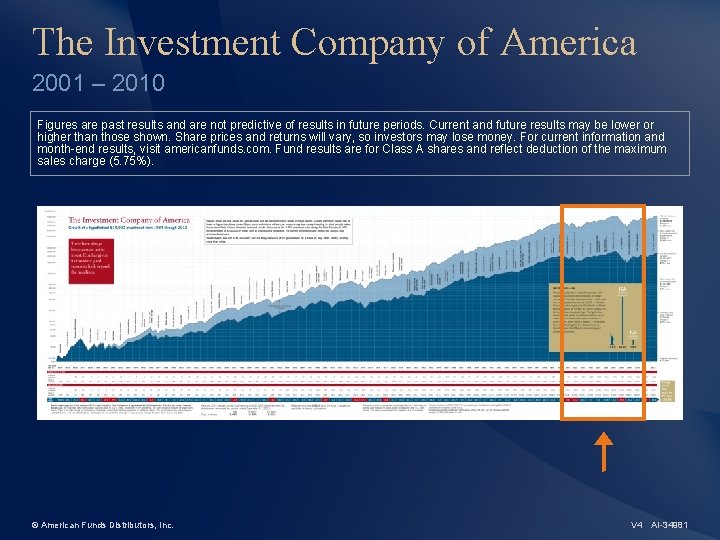
The Investment Company of America 2001 – 2010 Figures are past results and are not predictive of results in future periods. Current and future results may be lower or higher than those shown. Share prices and returns will vary, so investors may lose money. For current information and month-end results, visit americanfunds. com. Fund results are for Class A shares and reflect deduction of the maximum sales charge (5. 75%). © American Funds Distributors, Inc. V 4 AI-34981
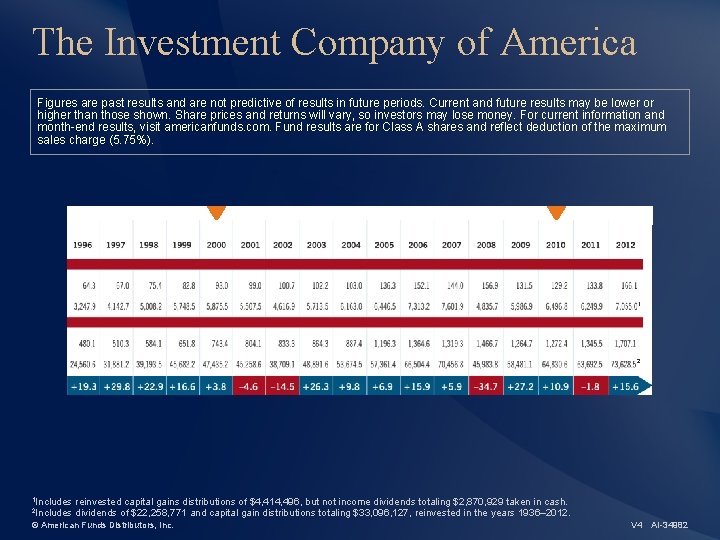
The Investment Company of America Figures are past results and are not predictive of results in future periods. Current and future results may be lower or higher than those shown. Share prices and returns will vary, so investors may lose money. For current information and month-end results, visit americanfunds. com. Fund results are for Class A shares and reflect deduction of the maximum sales charge (5. 75%). 1 2 1 Includes 2 Includes reinvested capital gains distributions of $4, 414, 496, but not income dividends totaling $2, 870, 929 taken in cash. dividends of $22, 258, 771 and capital gain distributions totaling $33, 096, 127, reinvested in the years 1936– 2012. © American Funds Distributors, Inc. V 4 AI-34982
The ICA Guide mountain chart Growth of a hypothetical $10, 000 from 1934 – 2012 Figures are past results and are not predictive of results in future periods. Current and future results may be lower or higher than those shown. Share prices and returns will vary, so investors may lose money. For current information and month-end results, visit americanfunds. com. Fund results are for Class A shares and reflect deduction of the maximum sales charge (5. 75%). © American Funds Distributors, Inc. V 4 AI-34983
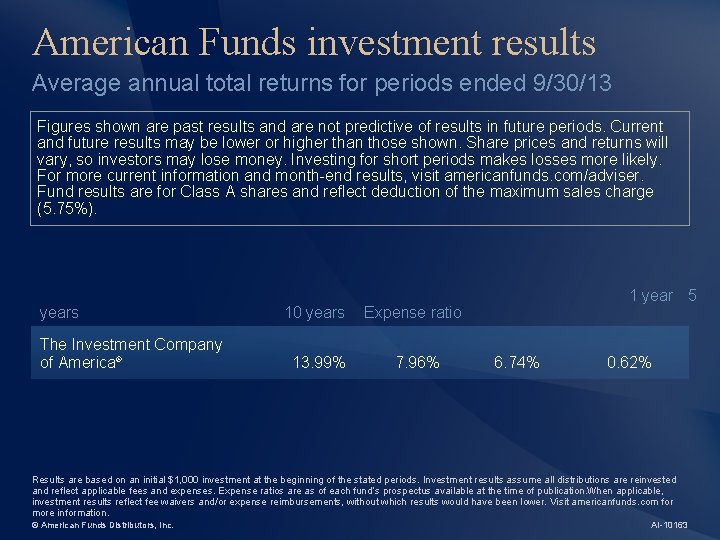
American Funds investment results Average annual total returns for periods ended 9/30/13 Figures shown are past results and are not predictive of results in future periods. Current and future results may be lower or higher than those shown. Share prices and returns will vary, so investors may lose money. Investing for short periods makes losses more likely. For more current information and month-end results, visit americanfunds. com/adviser. Fund results are for Class A shares and reflect deduction of the maximum sales charge (5. 75%). years The Investment Company of America® 10 years Expense ratio 13. 99% 7. 96% 1 year 5 6. 74% 0. 62% Results are based on an initial $1, 000 investment at the beginning of the stated periods. Investment results assume all distributions are reinvested and reflect applicable fees and expenses. Expense ratios are as of each fund’s prospectus available at the time of publication. When applicable, investment results reflect fee waivers and/or expense reimbursements, without which results would have been lower. Visit americanfunds. com for more information. © American Funds Distributors, Inc. AI-10163
Investors should carefully consider investment objectives, risks, charges and expenses. This and other important information is contained in the fund prospectuses and summary prospectuses, which can be obtained from a financial professional and should be read carefully before investing © American Funds Distributors, Inc. AI-36943
Standard & Poor's 500 Composite Index is a market capitalization-weighted index based on the average weighted results of 500 widely held common stocks. Market indexes are unmanaged and, therefore, have no expenses. AI-44440
If used after December 31, 2013, this presentation must be accompanied by a current American Funds quarterly statistical update. AI-44440
© American Funds Distributors, Inc. AI-36944 -A