
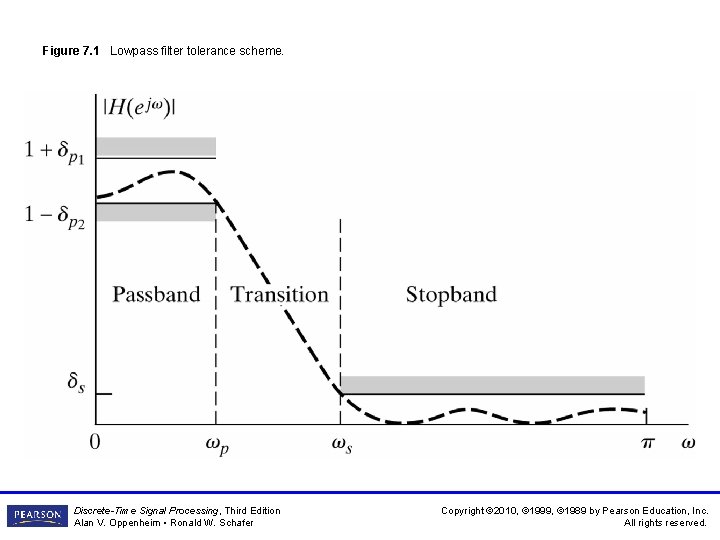
Figure 7 1 Lowpass filter tolerance scheme DiscreteTime
- Slides: 95
Figure 7. 1 Lowpass filter tolerance scheme. Discrete-Time Signal Processing, Third Edition Alan V. Oppenheim • Ronald W. Schafer Copyright © 2010, © 1999, © 1989 by Pearson Education, Inc. All rights reserved.
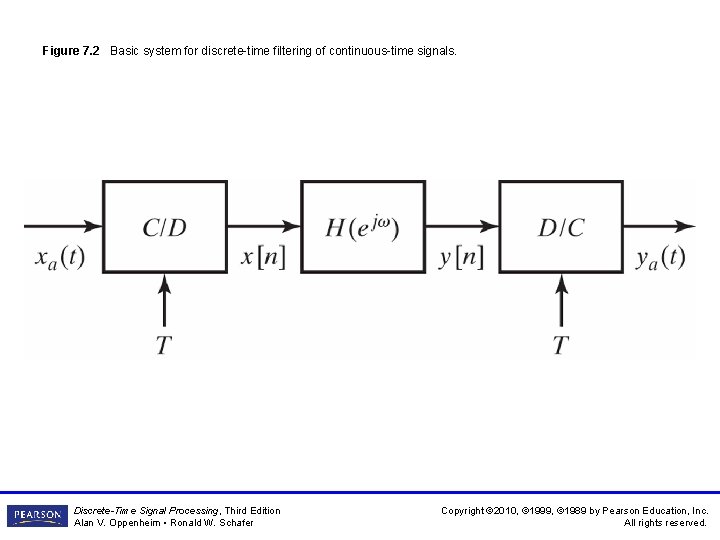
Figure 7. 2 Basic system for discrete-time filtering of continuous-time signals. Discrete-Time Signal Processing, Third Edition Alan V. Oppenheim • Ronald W. Schafer Copyright © 2010, © 1999, © 1989 by Pearson Education, Inc. All rights reserved.
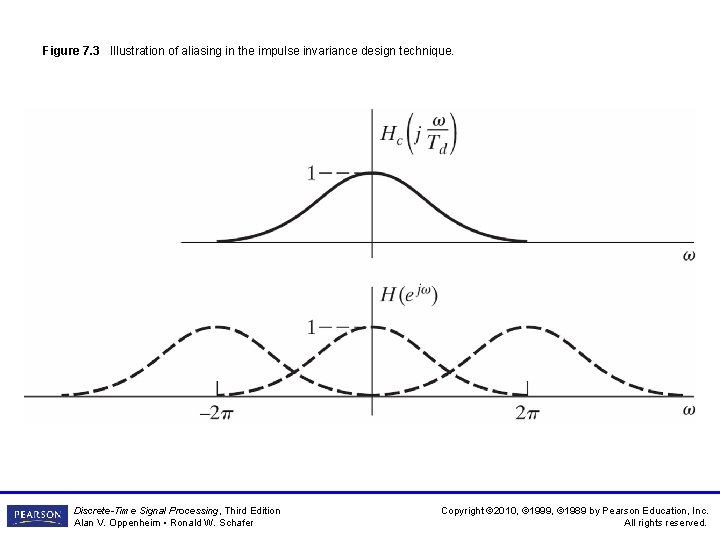
Figure 7. 3 Illustration of aliasing in the impulse invariance design technique. Discrete-Time Signal Processing, Third Edition Alan V. Oppenheim • Ronald W. Schafer Copyright © 2010, © 1999, © 1989 by Pearson Education, Inc. All rights reserved.
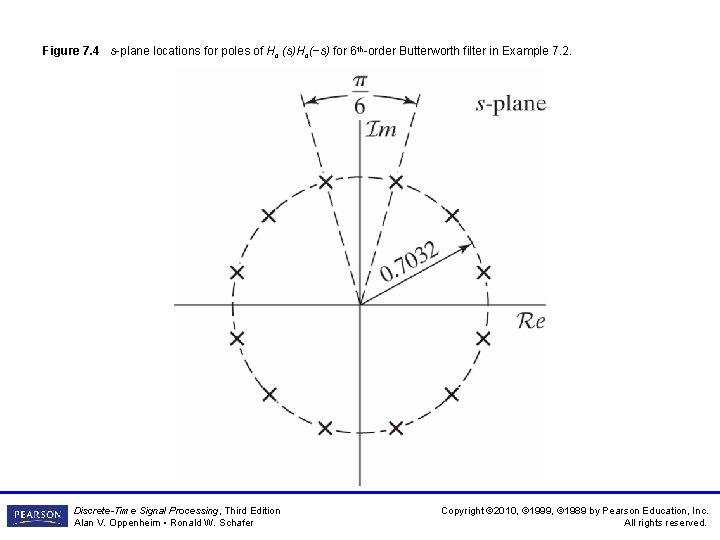
Figure 7. 4 s-plane locations for poles of Hc (s)Hc(−s) for 6 th-order Butterworth filter in Example 7. 2. Discrete-Time Signal Processing, Third Edition Alan V. Oppenheim • Ronald W. Schafer Copyright © 2010, © 1999, © 1989 by Pearson Education, Inc. All rights reserved.
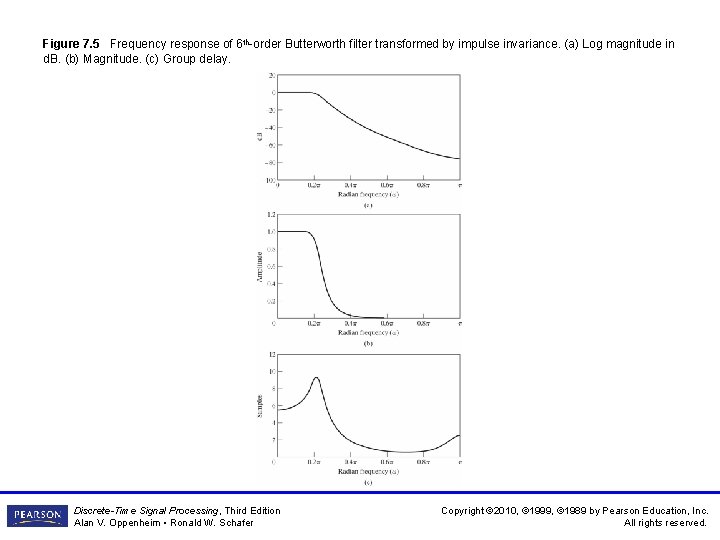
Figure 7. 5 Frequency response of 6 th-order Butterworth filter transformed by impulse invariance. (a) Log magnitude in d. B. (b) Magnitude. (c) Group delay. Discrete-Time Signal Processing, Third Edition Alan V. Oppenheim • Ronald W. Schafer Copyright © 2010, © 1999, © 1989 by Pearson Education, Inc. All rights reserved.
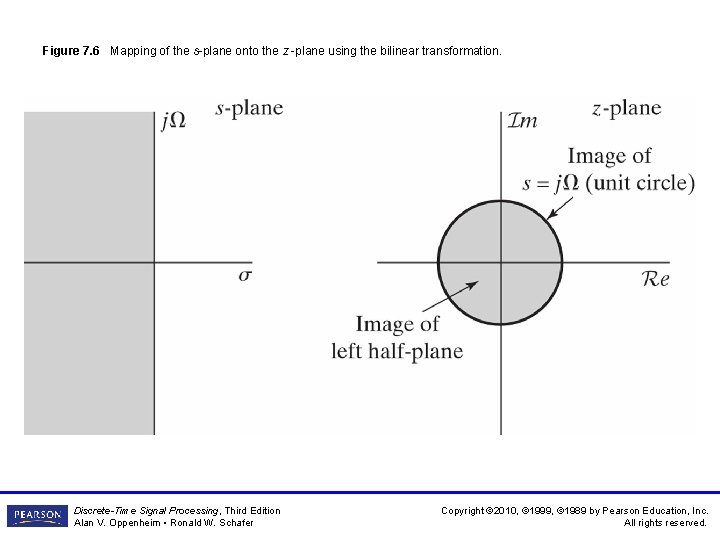
Figure 7. 6 Mapping of the s-plane onto the z -plane using the bilinear transformation. Discrete-Time Signal Processing, Third Edition Alan V. Oppenheim • Ronald W. Schafer Copyright © 2010, © 1999, © 1989 by Pearson Education, Inc. All rights reserved.
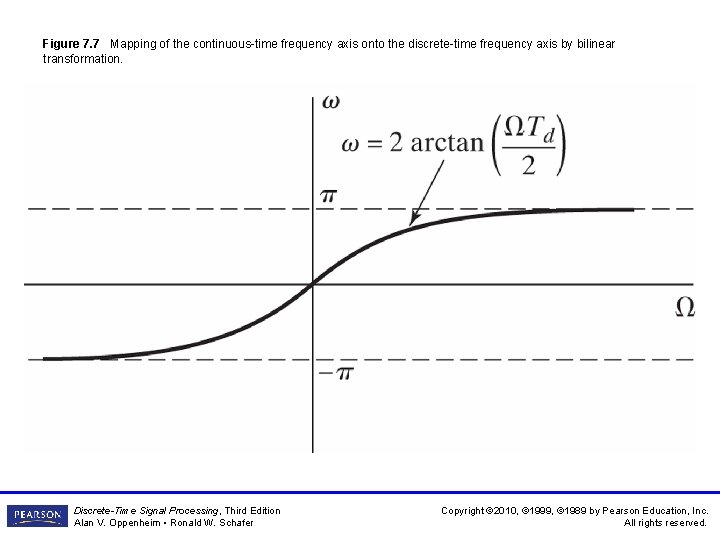
Figure 7. 7 Mapping of the continuous-time frequency axis onto the discrete-time frequency axis by bilinear transformation. Discrete-Time Signal Processing, Third Edition Alan V. Oppenheim • Ronald W. Schafer Copyright © 2010, © 1999, © 1989 by Pearson Education, Inc. All rights reserved.
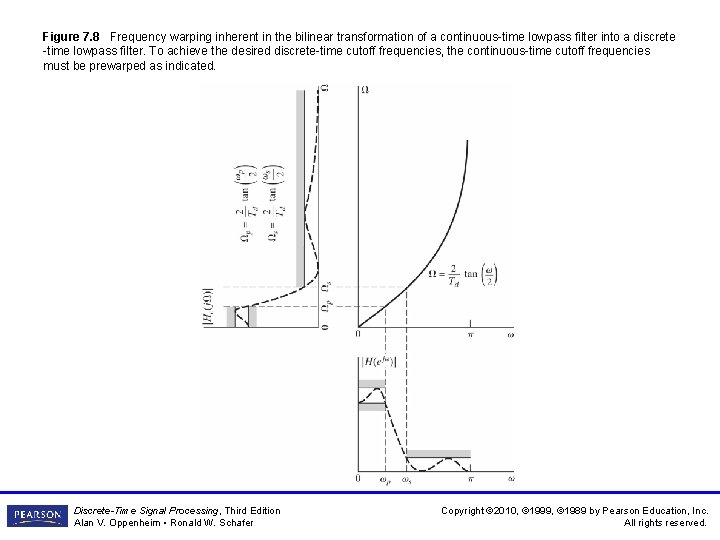
Figure 7. 8 Frequency warping inherent in the bilinear transformation of a continuous-time lowpass filter into a discrete -time lowpass filter. To achieve the desired discrete-time cutoff frequencies, the continuous-time cutoff frequencies must be prewarped as indicated. Discrete-Time Signal Processing, Third Edition Alan V. Oppenheim • Ronald W. Schafer Copyright © 2010, © 1999, © 1989 by Pearson Education, Inc. All rights reserved.
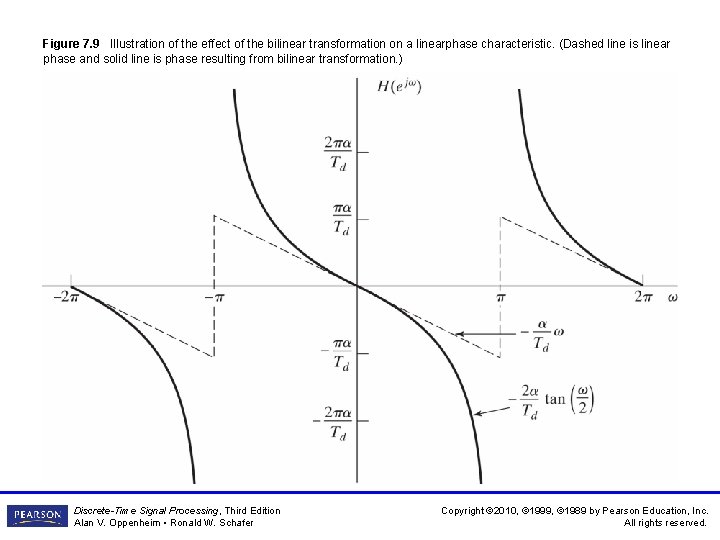
Figure 7. 9 Illustration of the effect of the bilinear transformation on a linearphase characteristic. (Dashed line is linear phase and solid line is phase resulting from bilinear transformation. ) Discrete-Time Signal Processing, Third Edition Alan V. Oppenheim • Ronald W. Schafer Copyright © 2010, © 1999, © 1989 by Pearson Education, Inc. All rights reserved.
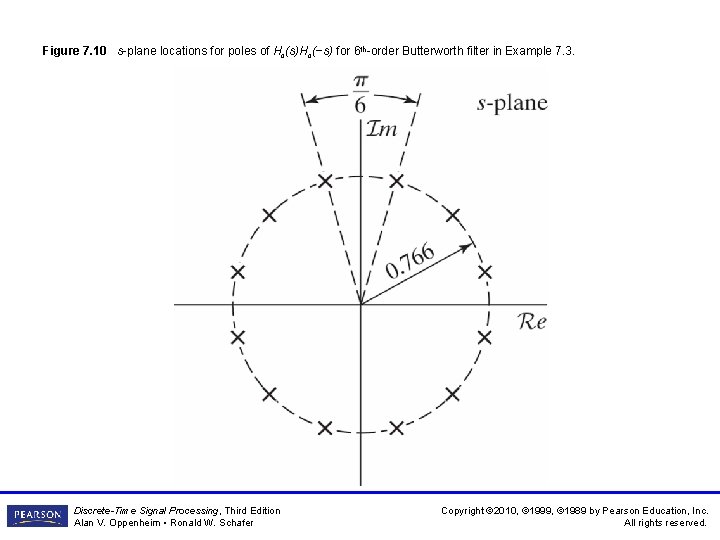
Figure 7. 10 s-plane locations for poles of Hc(s)Hc(−s) for 6 th-order Butterworth filter in Example 7. 3. Discrete-Time Signal Processing, Third Edition Alan V. Oppenheim • Ronald W. Schafer Copyright © 2010, © 1999, © 1989 by Pearson Education, Inc. All rights reserved.
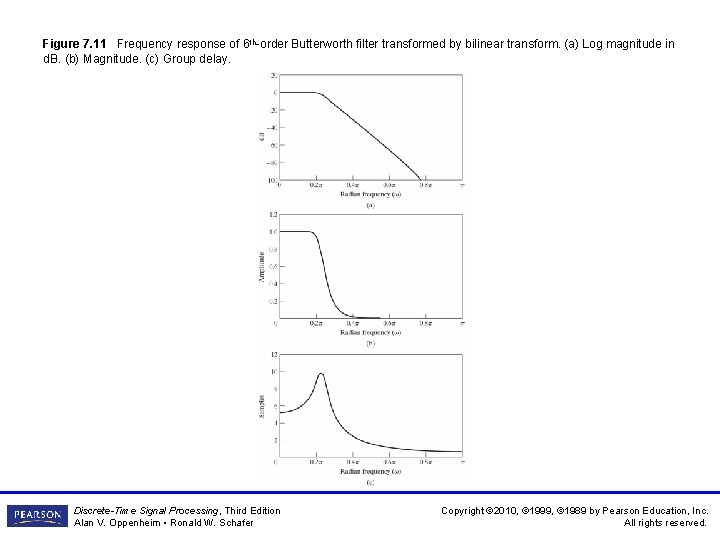
Figure 7. 11 Frequency response of 6 th-order Butterworth filter transformed by bilinear transform. (a) Log magnitude in d. B. (b) Magnitude. (c) Group delay. Discrete-Time Signal Processing, Third Edition Alan V. Oppenheim • Ronald W. Schafer Copyright © 2010, © 1999, © 1989 by Pearson Education, Inc. All rights reserved.
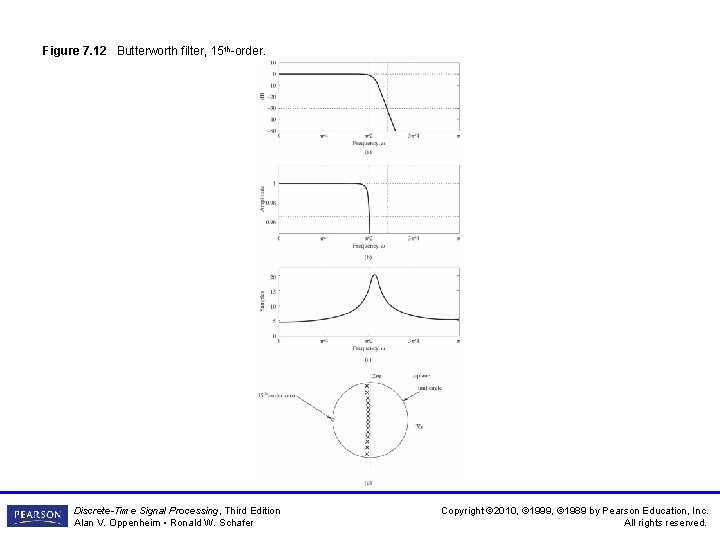
Figure 7. 12 Butterworth filter, 15 th-order. Discrete-Time Signal Processing, Third Edition Alan V. Oppenheim • Ronald W. Schafer Copyright © 2010, © 1999, © 1989 by Pearson Education, Inc. All rights reserved.
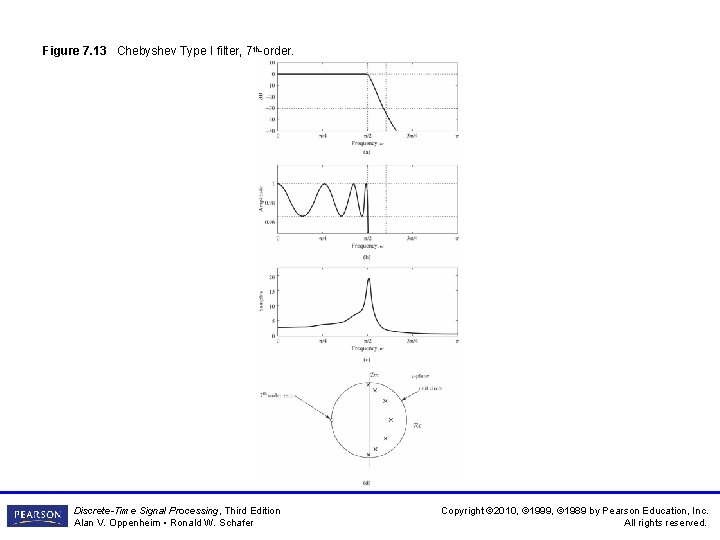
Figure 7. 13 Chebyshev Type I filter, 7 th-order. Discrete-Time Signal Processing, Third Edition Alan V. Oppenheim • Ronald W. Schafer Copyright © 2010, © 1999, © 1989 by Pearson Education, Inc. All rights reserved.
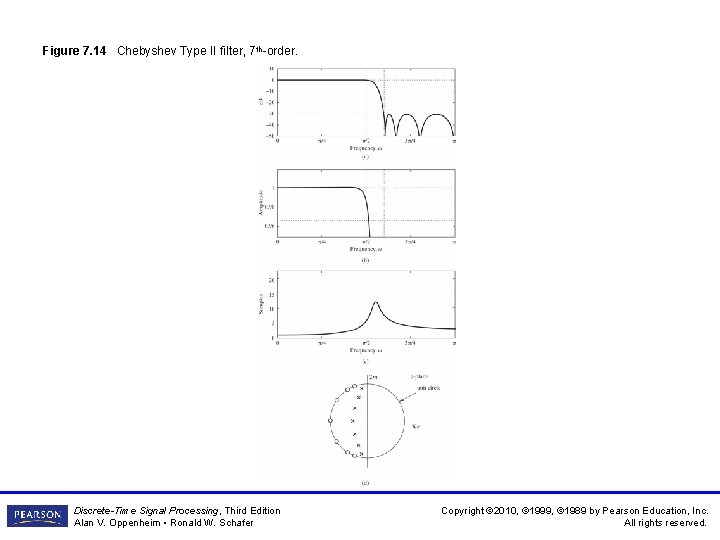
Figure 7. 14 Chebyshev Type II filter, 7 th-order. Discrete-Time Signal Processing, Third Edition Alan V. Oppenheim • Ronald W. Schafer Copyright © 2010, © 1999, © 1989 by Pearson Education, Inc. All rights reserved.
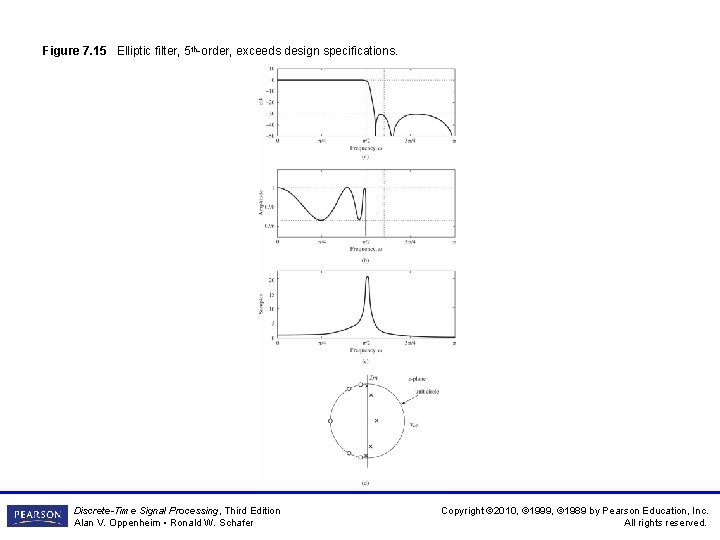
Figure 7. 15 Elliptic filter, 5 th-order, exceeds design specifications. Discrete-Time Signal Processing, Third Edition Alan V. Oppenheim • Ronald W. Schafer Copyright © 2010, © 1999, © 1989 by Pearson Education, Inc. All rights reserved.
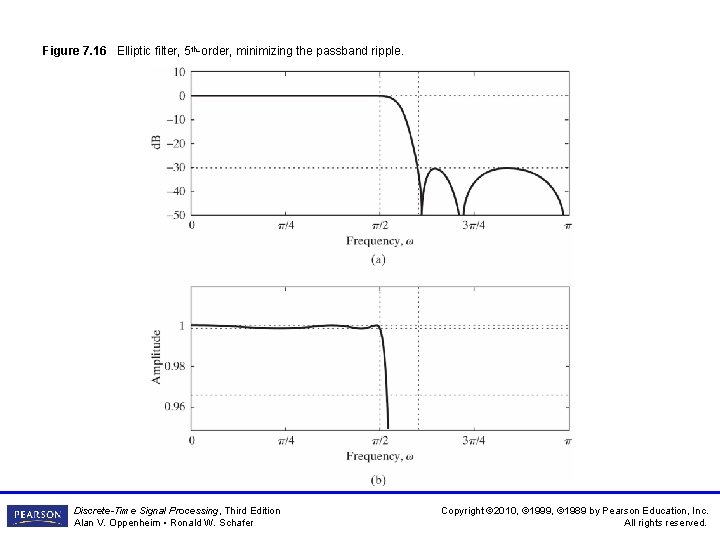
Figure 7. 16 Elliptic filter, 5 th-order, minimizing the passband ripple. Discrete-Time Signal Processing, Third Edition Alan V. Oppenheim • Ronald W. Schafer Copyright © 2010, © 1999, © 1989 by Pearson Education, Inc. All rights reserved.
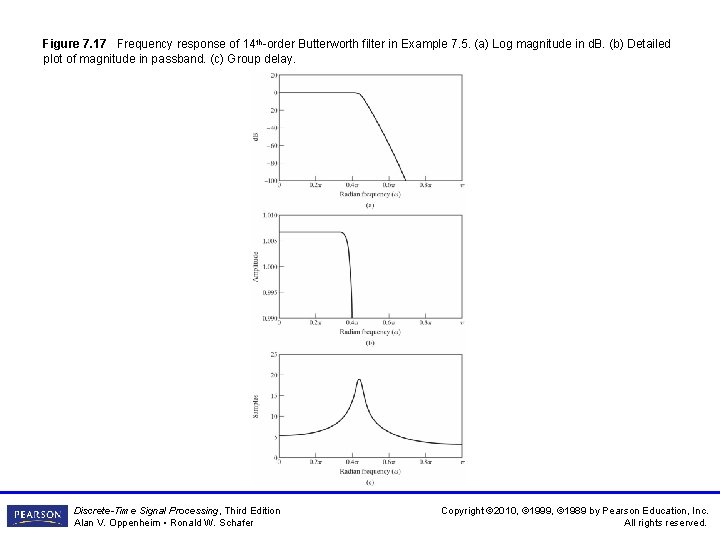
Figure 7. 17 Frequency response of 14 th-order Butterworth filter in Example 7. 5. (a) Log magnitude in d. B. (b) Detailed plot of magnitude in passband. (c) Group delay. Discrete-Time Signal Processing, Third Edition Alan V. Oppenheim • Ronald W. Schafer Copyright © 2010, © 1999, © 1989 by Pearson Education, Inc. All rights reserved.
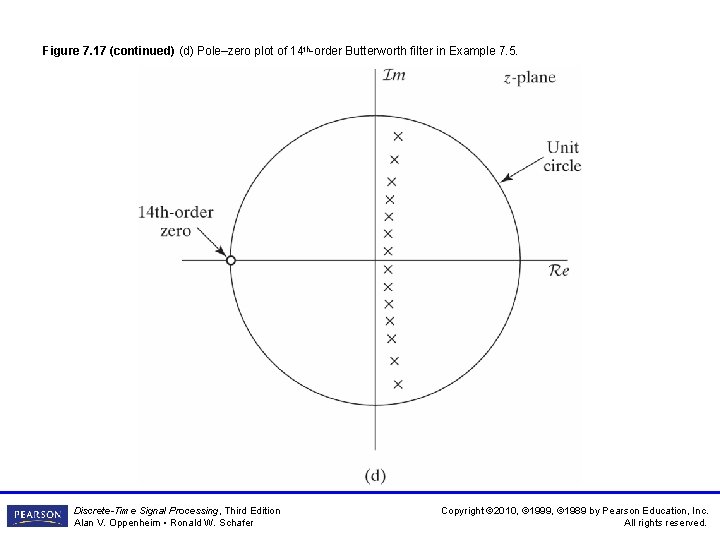
Figure 7. 17 (continued) (d) Pole–zero plot of 14 th-order Butterworth filter in Example 7. 5. Discrete-Time Signal Processing, Third Edition Alan V. Oppenheim • Ronald W. Schafer Copyright © 2010, © 1999, © 1989 by Pearson Education, Inc. All rights reserved.
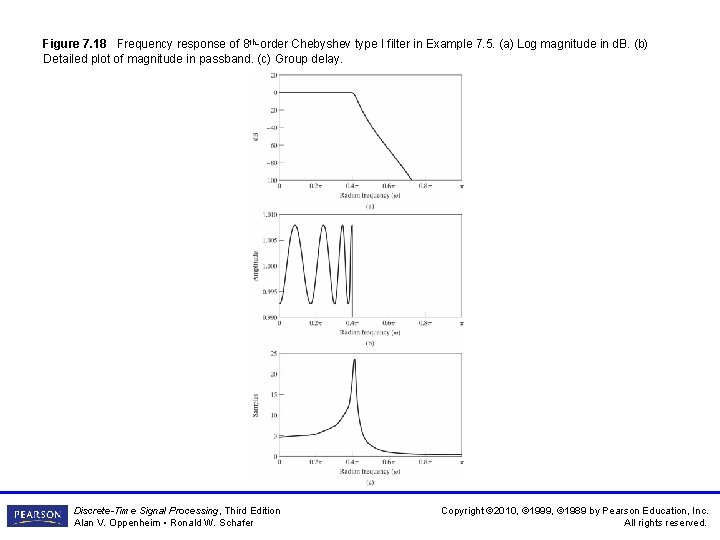
Figure 7. 18 Frequency response of 8 th-order Chebyshev type I filter in Example 7. 5. (a) Log magnitude in d. B. (b) Detailed plot of magnitude in passband. (c) Group delay. Discrete-Time Signal Processing, Third Edition Alan V. Oppenheim • Ronald W. Schafer Copyright © 2010, © 1999, © 1989 by Pearson Education, Inc. All rights reserved.
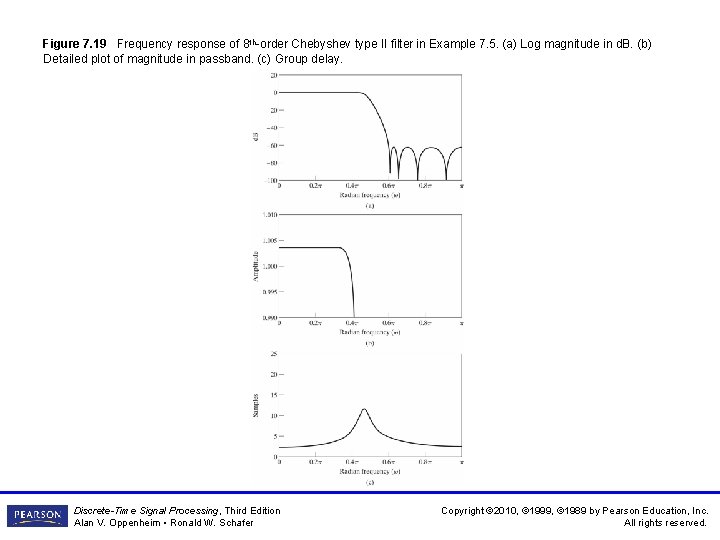
Figure 7. 19 Frequency response of 8 th-order Chebyshev type II filter in Example 7. 5. (a) Log magnitude in d. B. (b) Detailed plot of magnitude in passband. (c) Group delay. Discrete-Time Signal Processing, Third Edition Alan V. Oppenheim • Ronald W. Schafer Copyright © 2010, © 1999, © 1989 by Pearson Education, Inc. All rights reserved.
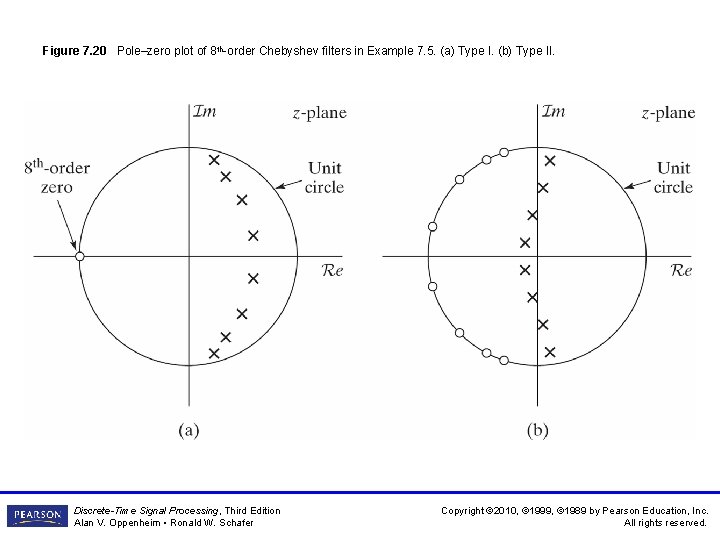
Figure 7. 20 Pole–zero plot of 8 th-order Chebyshev filters in Example 7. 5. (a) Type I. (b) Type II. Discrete-Time Signal Processing, Third Edition Alan V. Oppenheim • Ronald W. Schafer Copyright © 2010, © 1999, © 1989 by Pearson Education, Inc. All rights reserved.
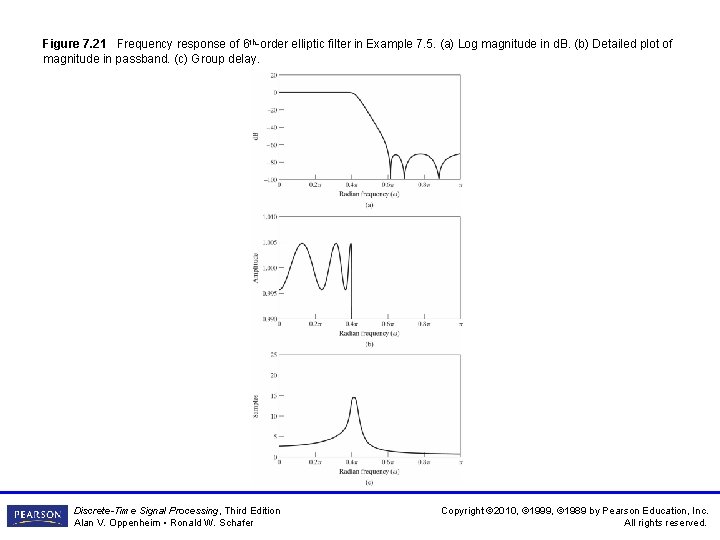
Figure 7. 21 Frequency response of 6 th-order elliptic filter in Example 7. 5. (a) Log magnitude in d. B. (b) Detailed plot of magnitude in passband. (c) Group delay. Discrete-Time Signal Processing, Third Edition Alan V. Oppenheim • Ronald W. Schafer Copyright © 2010, © 1999, © 1989 by Pearson Education, Inc. All rights reserved.
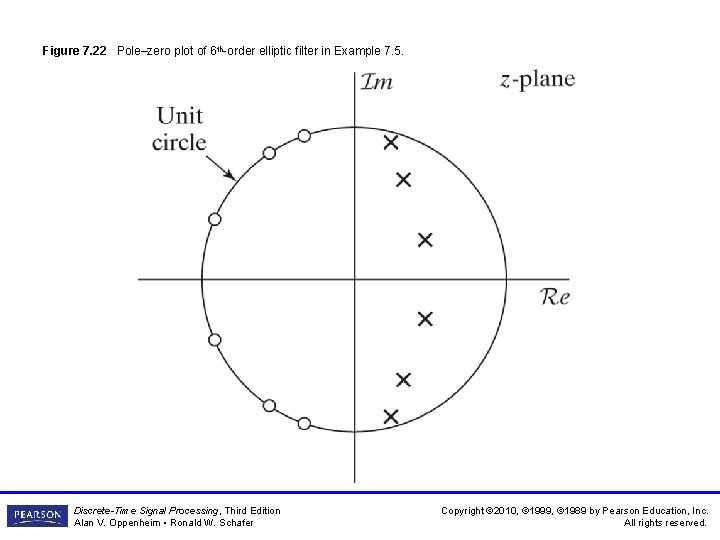
Figure 7. 22 Pole–zero plot of 6 th-order elliptic filter in Example 7. 5. Discrete-Time Signal Processing, Third Edition Alan V. Oppenheim • Ronald W. Schafer Copyright © 2010, © 1999, © 1989 by Pearson Education, Inc. All rights reserved.
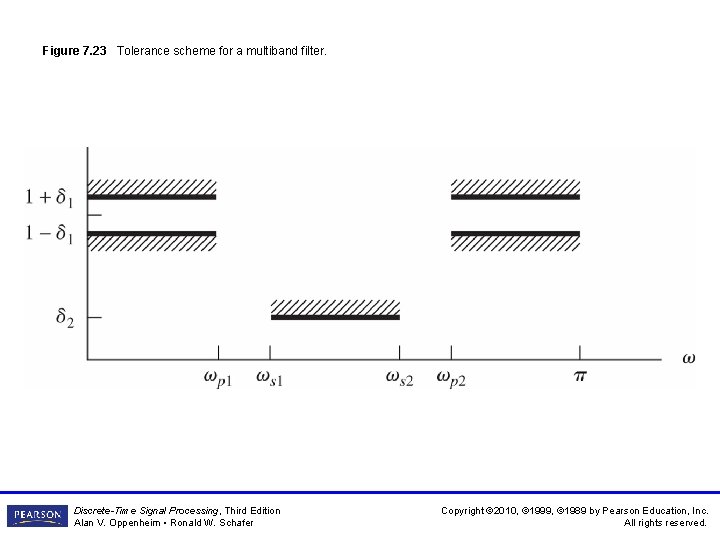
Figure 7. 23 Tolerance scheme for a multiband filter. Discrete-Time Signal Processing, Third Edition Alan V. Oppenheim • Ronald W. Schafer Copyright © 2010, © 1999, © 1989 by Pearson Education, Inc. All rights reserved.
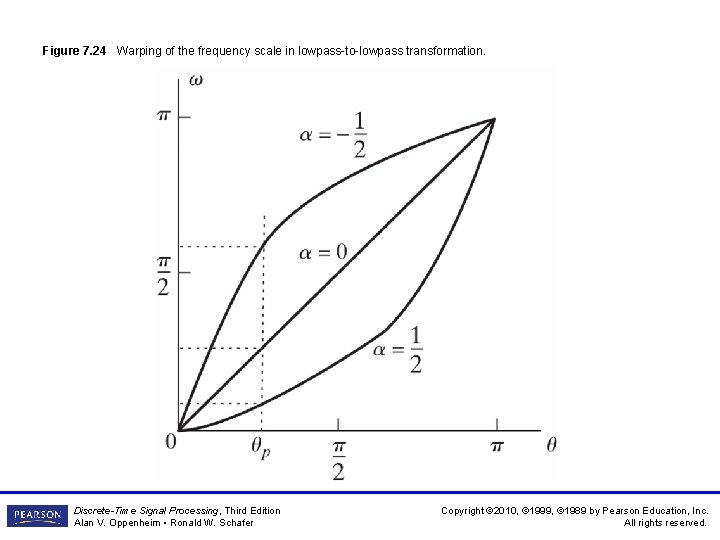
Figure 7. 24 Warping of the frequency scale in lowpass-to-lowpass transformation. Discrete-Time Signal Processing, Third Edition Alan V. Oppenheim • Ronald W. Schafer Copyright © 2010, © 1999, © 1989 by Pearson Education, Inc. All rights reserved.
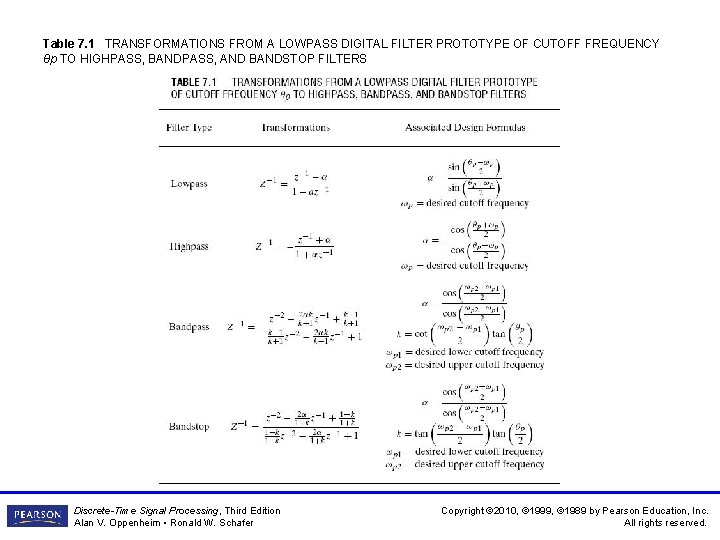
Table 7. 1 TRANSFORMATIONS FROM A LOWPASS DIGITAL FILTER PROTOTYPE OF CUTOFF FREQUENCY θp TO HIGHPASS, BANDPASS, AND BANDSTOP FILTERS Discrete-Time Signal Processing, Third Edition Alan V. Oppenheim • Ronald W. Schafer Copyright © 2010, © 1999, © 1989 by Pearson Education, Inc. All rights reserved.
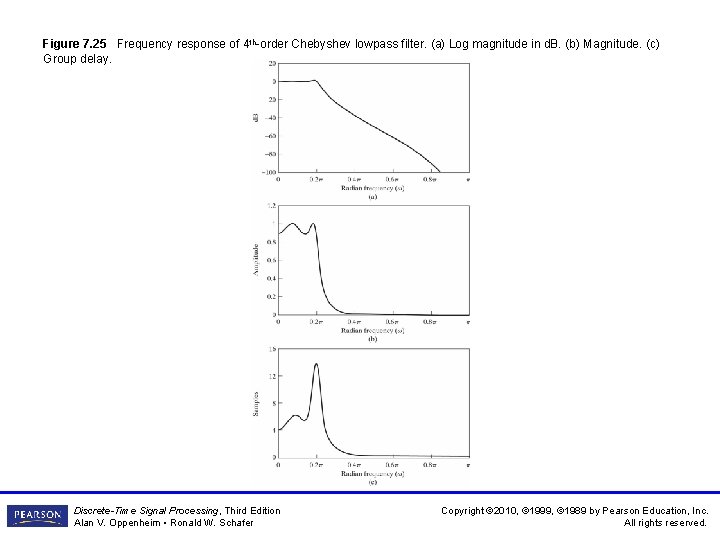
Figure 7. 25 Frequency response of 4 th-order Chebyshev lowpass filter. (a) Log magnitude in d. B. (b) Magnitude. (c) Group delay. Discrete-Time Signal Processing, Third Edition Alan V. Oppenheim • Ronald W. Schafer Copyright © 2010, © 1999, © 1989 by Pearson Education, Inc. All rights reserved.
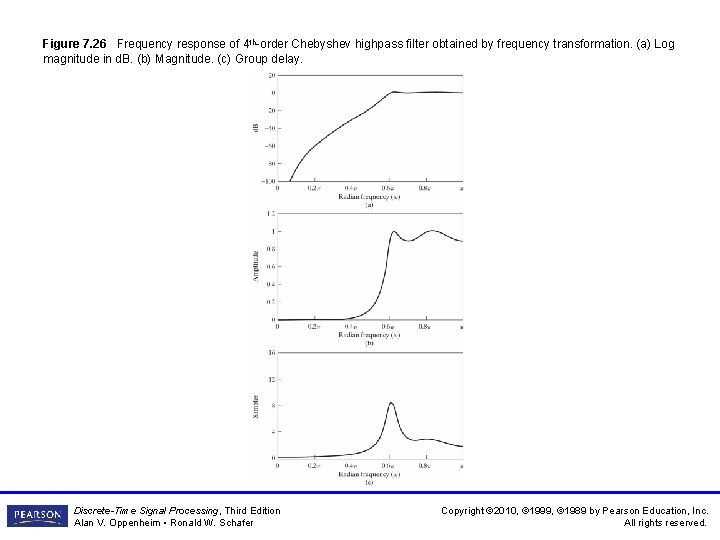
Figure 7. 26 Frequency response of 4 th-order Chebyshev highpass filter obtained by frequency transformation. (a) Log magnitude in d. B. (b) Magnitude. (c) Group delay. Discrete-Time Signal Processing, Third Edition Alan V. Oppenheim • Ronald W. Schafer Copyright © 2010, © 1999, © 1989 by Pearson Education, Inc. All rights reserved.
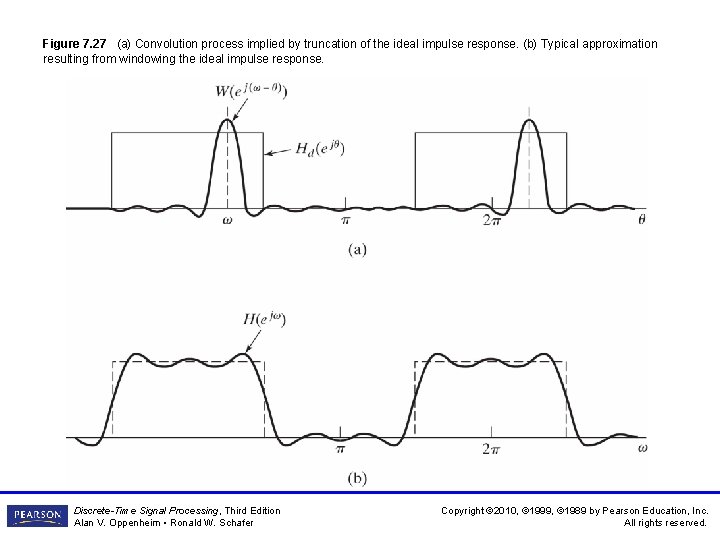
Figure 7. 27 (a) Convolution process implied by truncation of the ideal impulse response. (b) Typical approximation resulting from windowing the ideal impulse response. Discrete-Time Signal Processing, Third Edition Alan V. Oppenheim • Ronald W. Schafer Copyright © 2010, © 1999, © 1989 by Pearson Education, Inc. All rights reserved.
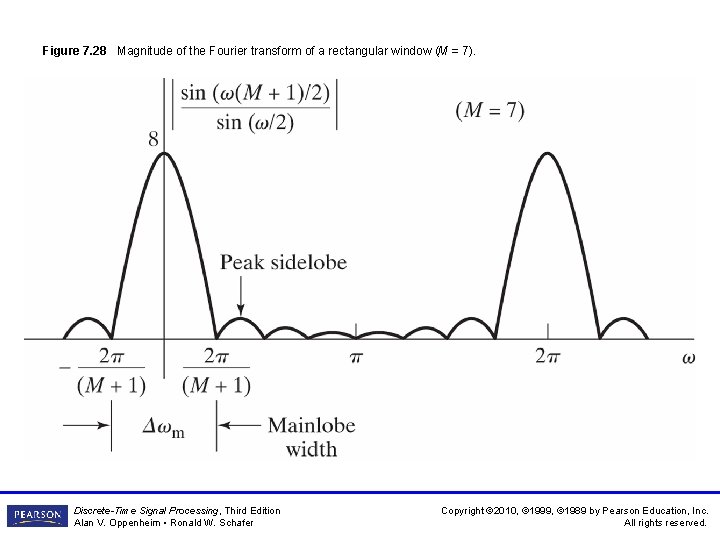
Figure 7. 28 Magnitude of the Fourier transform of a rectangular window (M = 7). Discrete-Time Signal Processing, Third Edition Alan V. Oppenheim • Ronald W. Schafer Copyright © 2010, © 1999, © 1989 by Pearson Education, Inc. All rights reserved.
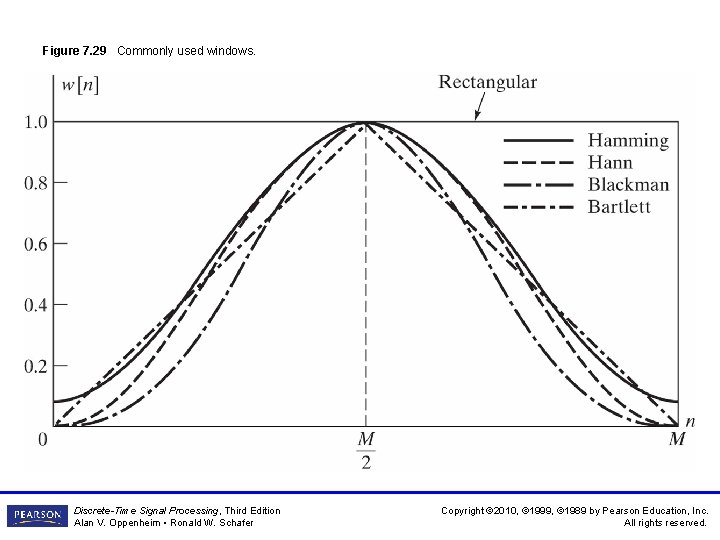
Figure 7. 29 Commonly used windows. Discrete-Time Signal Processing, Third Edition Alan V. Oppenheim • Ronald W. Schafer Copyright © 2010, © 1999, © 1989 by Pearson Education, Inc. All rights reserved.
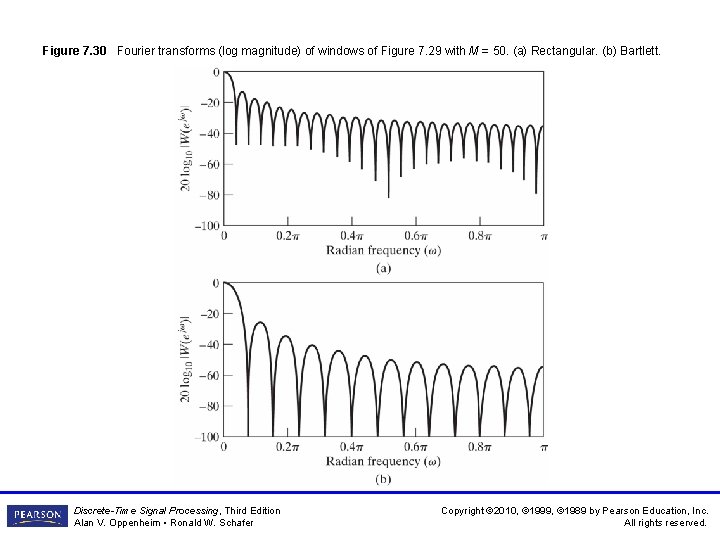
Figure 7. 30 Fourier transforms (log magnitude) of windows of Figure 7. 29 with M = 50. (a) Rectangular. (b) Bartlett. Discrete-Time Signal Processing, Third Edition Alan V. Oppenheim • Ronald W. Schafer Copyright © 2010, © 1999, © 1989 by Pearson Education, Inc. All rights reserved.
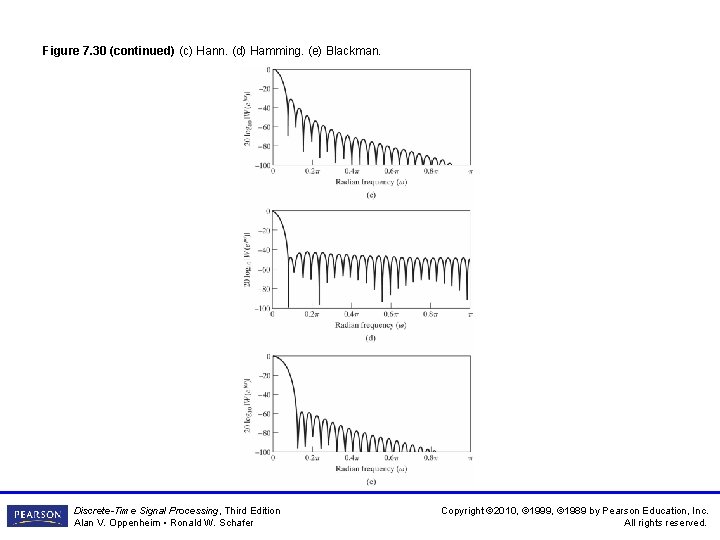
Figure 7. 30 (continued) (c) Hann. (d) Hamming. (e) Blackman. Discrete-Time Signal Processing, Third Edition Alan V. Oppenheim • Ronald W. Schafer Copyright © 2010, © 1999, © 1989 by Pearson Education, Inc. All rights reserved.
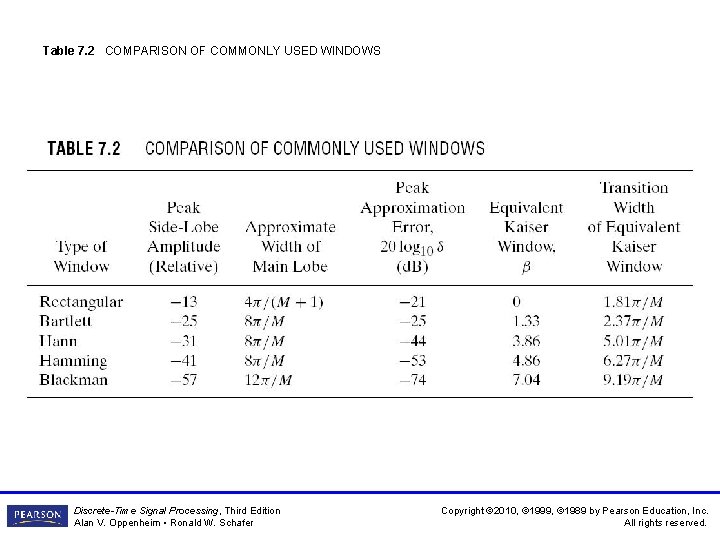
Table 7. 2 COMPARISON OF COMMONLY USED WINDOWS Discrete-Time Signal Processing, Third Edition Alan V. Oppenheim • Ronald W. Schafer Copyright © 2010, © 1999, © 1989 by Pearson Education, Inc. All rights reserved.
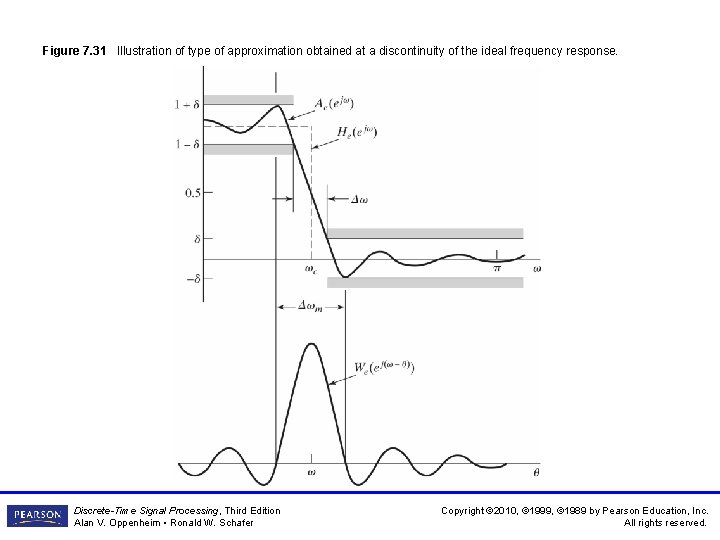
Figure 7. 31 Illustration of type of approximation obtained at a discontinuity of the ideal frequency response. Discrete-Time Signal Processing, Third Edition Alan V. Oppenheim • Ronald W. Schafer Copyright © 2010, © 1999, © 1989 by Pearson Education, Inc. All rights reserved.
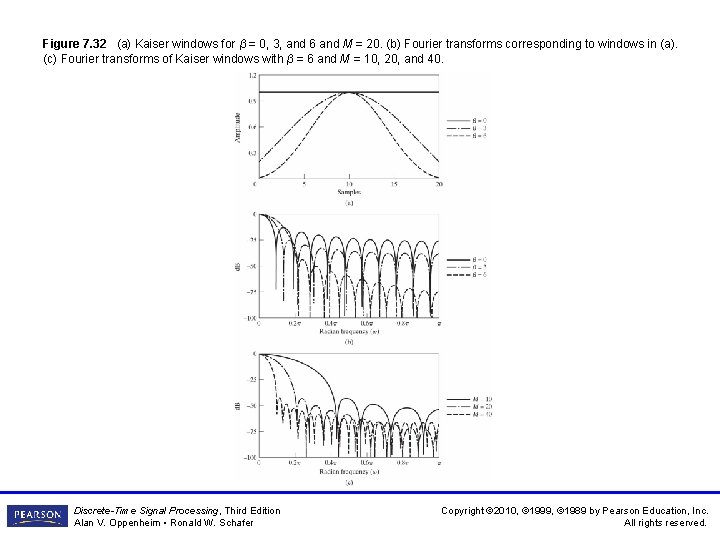
Figure 7. 32 (a) Kaiser windows for β = 0, 3, and 6 and M = 20. (b) Fourier transforms corresponding to windows in (a). (c) Fourier transforms of Kaiser windows with β = 6 and M = 10, 20, and 40. Discrete-Time Signal Processing, Third Edition Alan V. Oppenheim • Ronald W. Schafer Copyright © 2010, © 1999, © 1989 by Pearson Education, Inc. All rights reserved.
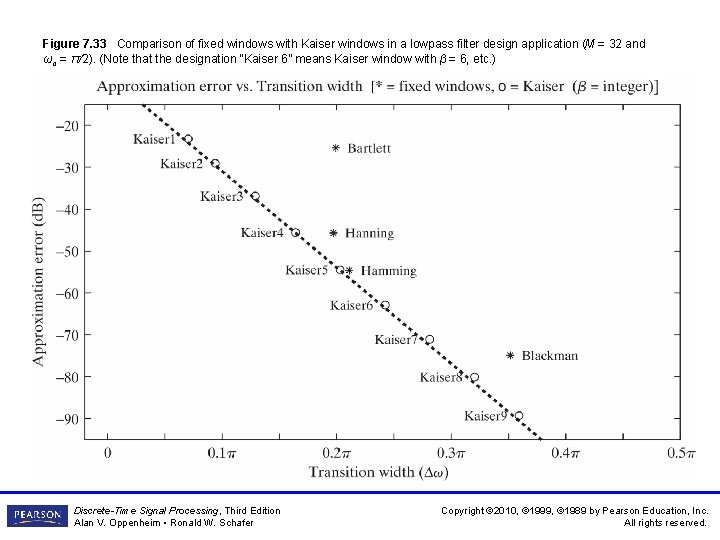
Figure 7. 33 Comparison of fixed windows with Kaiser windows in a lowpass filter design application (M = 32 and ωc = π/2). (Note that the designation “Kaiser 6” means Kaiser window with β = 6, etc. ) Discrete-Time Signal Processing, Third Edition Alan V. Oppenheim • Ronald W. Schafer Copyright © 2010, © 1999, © 1989 by Pearson Education, Inc. All rights reserved.
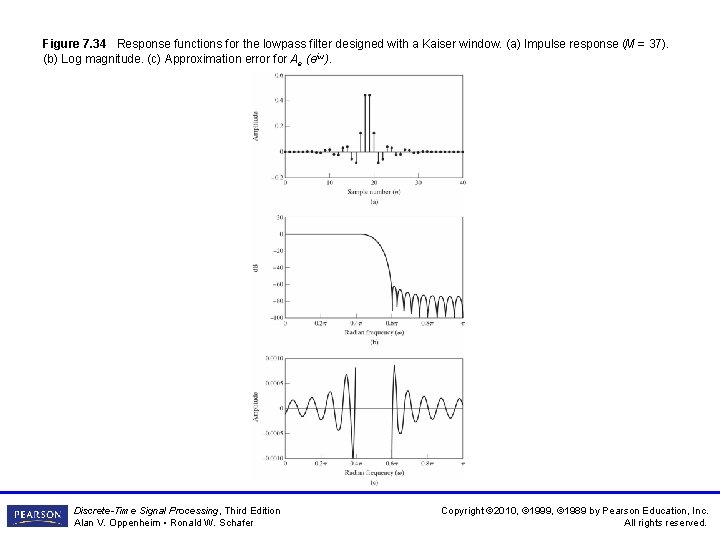
Figure 7. 34 Response functions for the lowpass filter designed with a Kaiser window. (a) Impulse response (M = 37). (b) Log magnitude. (c) Approximation error for Ae (ejω). Discrete-Time Signal Processing, Third Edition Alan V. Oppenheim • Ronald W. Schafer Copyright © 2010, © 1999, © 1989 by Pearson Education, Inc. All rights reserved.
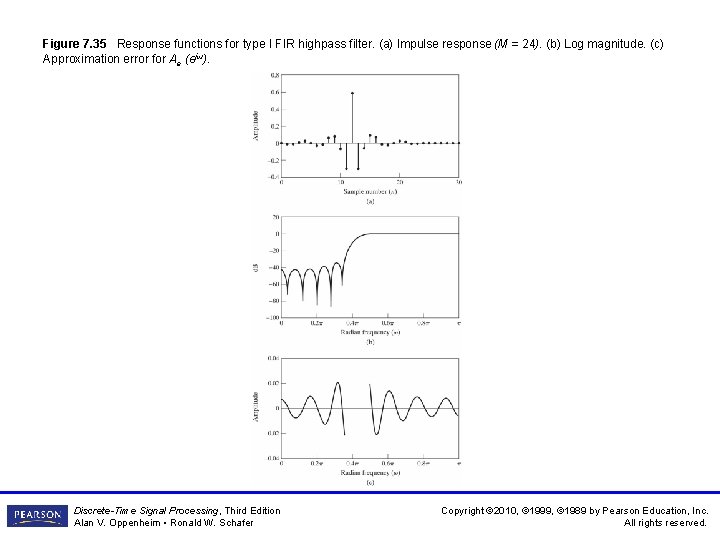
Figure 7. 35 Response functions for type I FIR highpass filter. (a) Impulse response (M = 24). (b) Log magnitude. (c) Approximation error for Ae (ejω). Discrete-Time Signal Processing, Third Edition Alan V. Oppenheim • Ronald W. Schafer Copyright © 2010, © 1999, © 1989 by Pearson Education, Inc. All rights reserved.
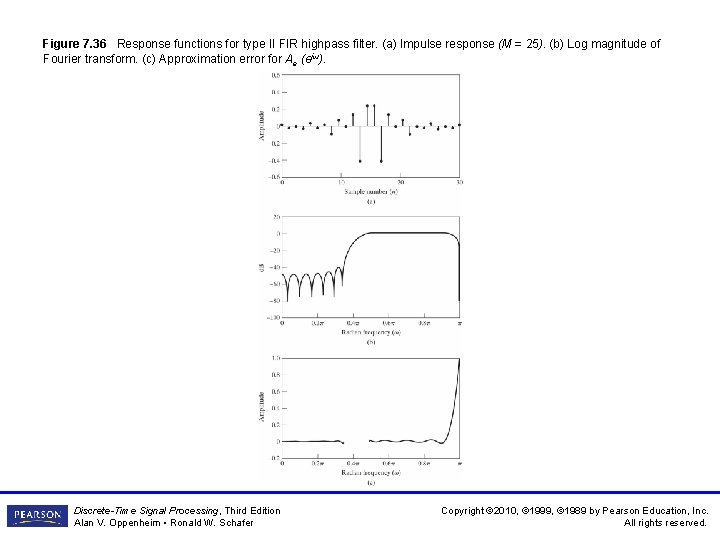
Figure 7. 36 Response functions for type II FIR highpass filter. (a) Impulse response (M = 25). (b) Log magnitude of Fourier transform. (c) Approximation error for Ae (ejω). Discrete-Time Signal Processing, Third Edition Alan V. Oppenheim • Ronald W. Schafer Copyright © 2010, © 1999, © 1989 by Pearson Education, Inc. All rights reserved.
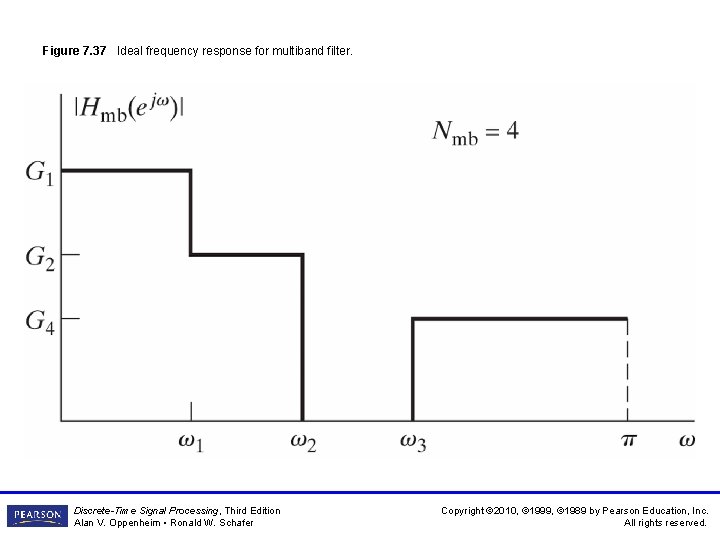
Figure 7. 37 Ideal frequency response for multiband filter. Discrete-Time Signal Processing, Third Edition Alan V. Oppenheim • Ronald W. Schafer Copyright © 2010, © 1999, © 1989 by Pearson Education, Inc. All rights reserved.
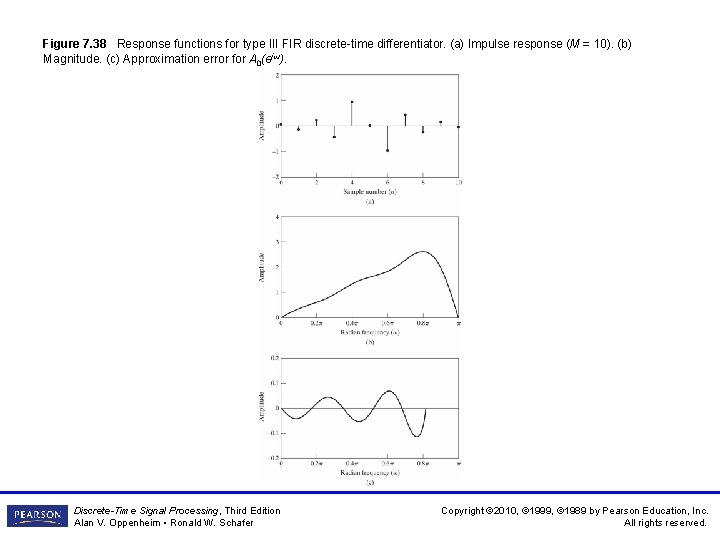
Figure 7. 38 Response functions for type III FIR discrete-time differentiator. (a) Impulse response (M = 10). (b) Magnitude. (c) Approximation error for A 0(ejω). Discrete-Time Signal Processing, Third Edition Alan V. Oppenheim • Ronald W. Schafer Copyright © 2010, © 1999, © 1989 by Pearson Education, Inc. All rights reserved.
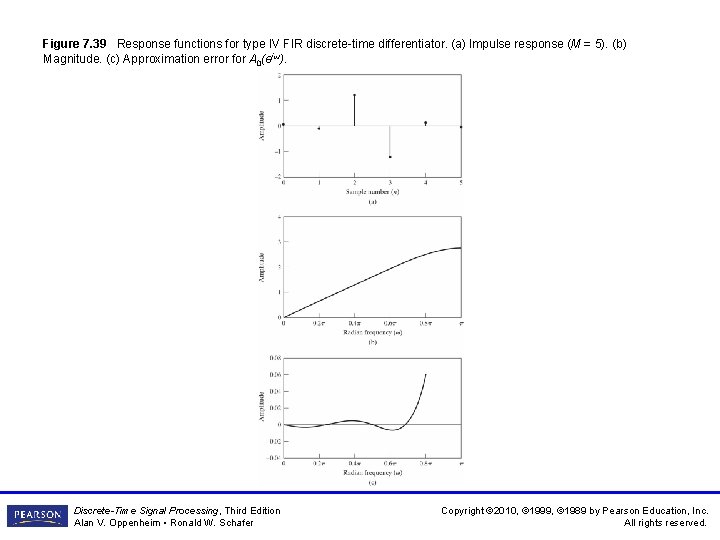
Figure 7. 39 Response functions for type IV FIR discrete-time differentiator. (a) Impulse response (M = 5). (b) Magnitude. (c) Approximation error for A 0(ejω). Discrete-Time Signal Processing, Third Edition Alan V. Oppenheim • Ronald W. Schafer Copyright © 2010, © 1999, © 1989 by Pearson Education, Inc. All rights reserved.
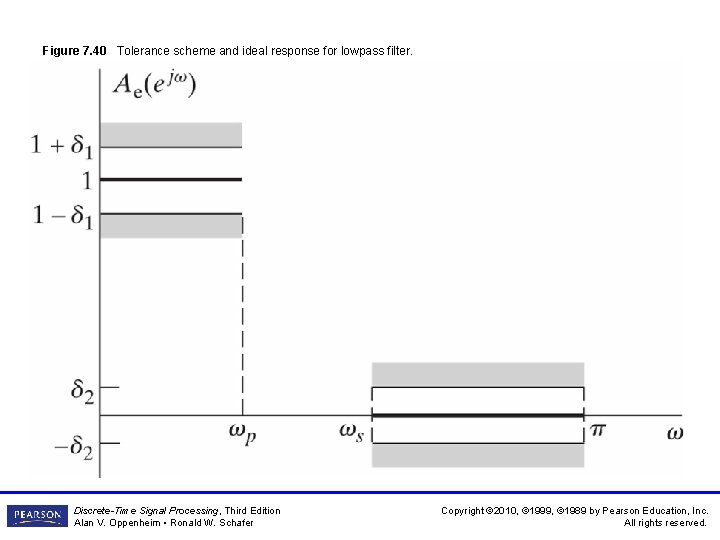
Figure 7. 40 Tolerance scheme and ideal response for lowpass filter. Discrete-Time Signal Processing, Third Edition Alan V. Oppenheim • Ronald W. Schafer Copyright © 2010, © 1999, © 1989 by Pearson Education, Inc. All rights reserved.
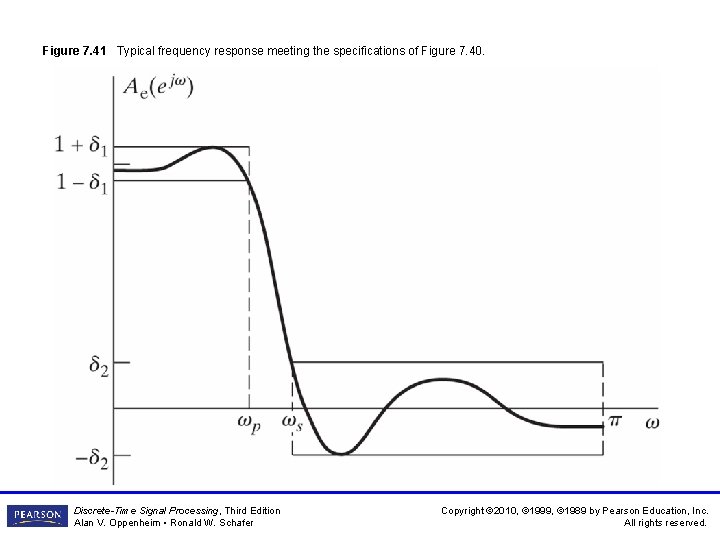
Figure 7. 41 Typical frequency response meeting the specifications of Figure 7. 40. Discrete-Time Signal Processing, Third Edition Alan V. Oppenheim • Ronald W. Schafer Copyright © 2010, © 1999, © 1989 by Pearson Education, Inc. All rights reserved.
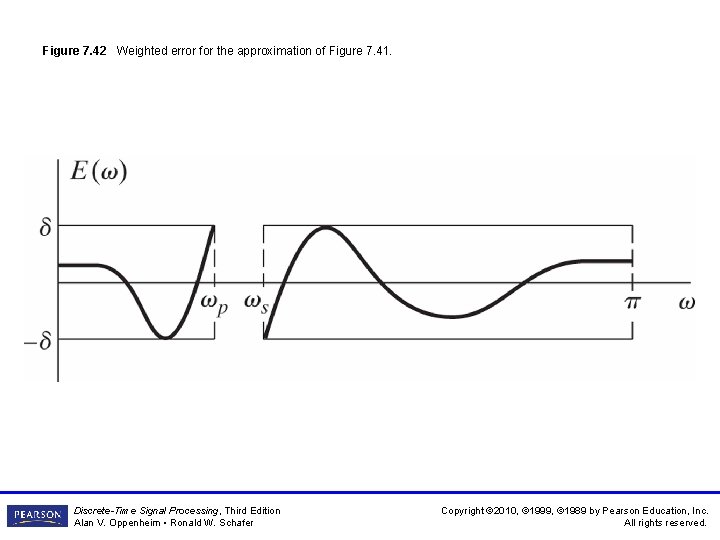
Figure 7. 42 Weighted error for the approximation of Figure 7. 41. Discrete-Time Signal Processing, Third Edition Alan V. Oppenheim • Ronald W. Schafer Copyright © 2010, © 1999, © 1989 by Pearson Education, Inc. All rights reserved.
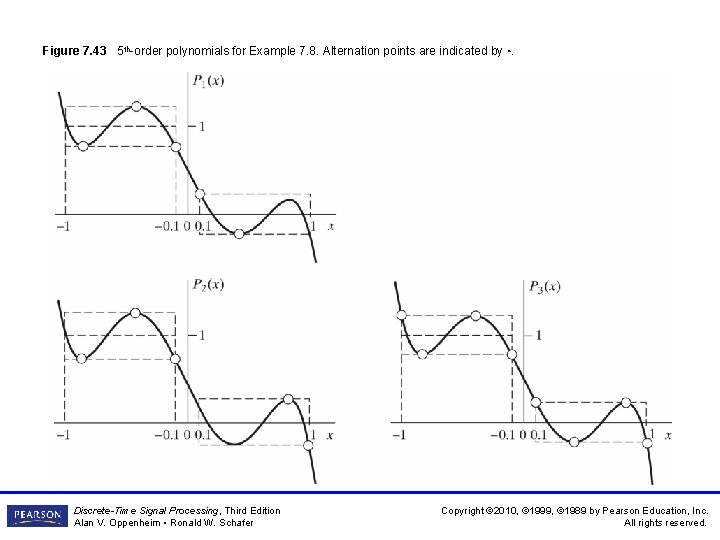
Figure 7. 43 5 th-order polynomials for Example 7. 8. Alternation points are indicated by ◦. Discrete-Time Signal Processing, Third Edition Alan V. Oppenheim • Ronald W. Schafer Copyright © 2010, © 1999, © 1989 by Pearson Education, Inc. All rights reserved.
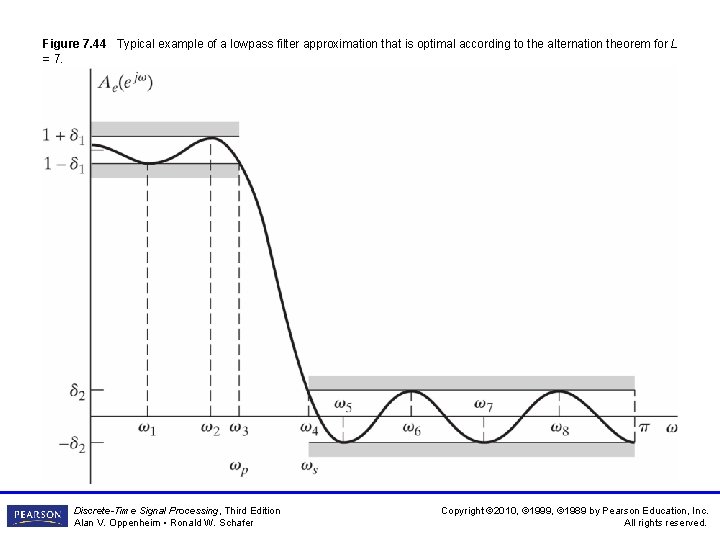
Figure 7. 44 Typical example of a lowpass filter approximation that is optimal according to the alternation theorem for L = 7. Discrete-Time Signal Processing, Third Edition Alan V. Oppenheim • Ronald W. Schafer Copyright © 2010, © 1999, © 1989 by Pearson Education, Inc. All rights reserved.
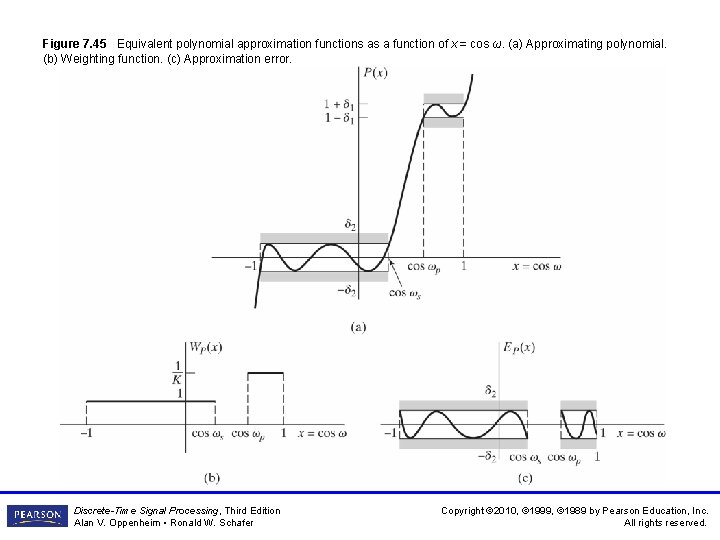
Figure 7. 45 Equivalent polynomial approximation functions as a function of x = cos ω. (a) Approximating polynomial. (b) Weighting function. (c) Approximation error. Discrete-Time Signal Processing, Third Edition Alan V. Oppenheim • Ronald W. Schafer Copyright © 2010, © 1999, © 1989 by Pearson Education, Inc. All rights reserved.
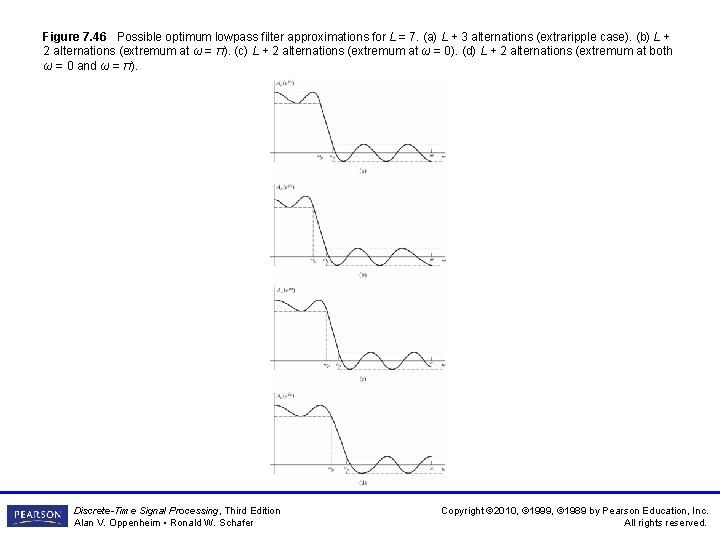
Figure 7. 46 Possible optimum lowpass filter approximations for L = 7. (a) L + 3 alternations (extraripple case). (b) L + 2 alternations (extremum at ω = π). (c) L + 2 alternations (extremum at ω = 0). (d) L + 2 alternations (extremum at both ω = 0 and ω = π). Discrete-Time Signal Processing, Third Edition Alan V. Oppenheim • Ronald W. Schafer Copyright © 2010, © 1999, © 1989 by Pearson Education, Inc. All rights reserved.
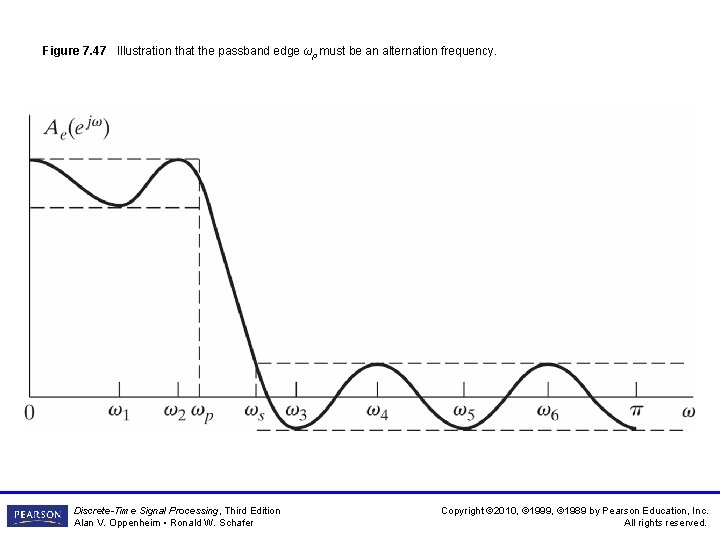
Figure 7. 47 Illustration that the passband edge ωp must be an alternation frequency. Discrete-Time Signal Processing, Third Edition Alan V. Oppenheim • Ronald W. Schafer Copyright © 2010, © 1999, © 1989 by Pearson Education, Inc. All rights reserved.
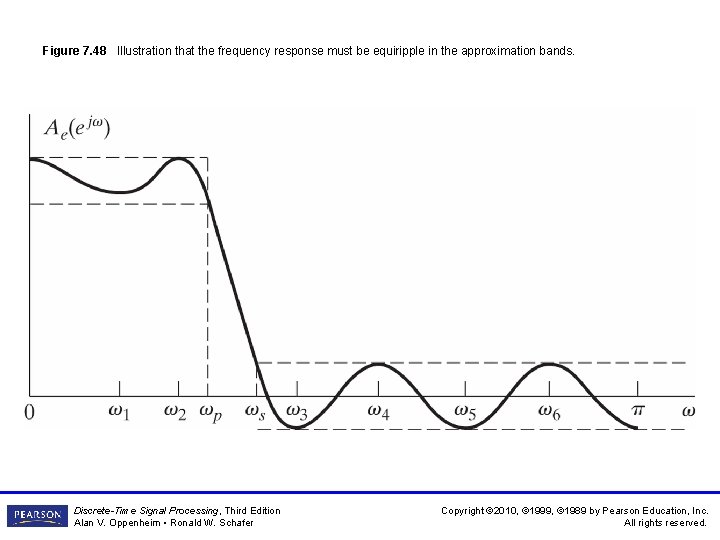
Figure 7. 48 Illustration that the frequency response must be equiripple in the approximation bands. Discrete-Time Signal Processing, Third Edition Alan V. Oppenheim • Ronald W. Schafer Copyright © 2010, © 1999, © 1989 by Pearson Education, Inc. All rights reserved.
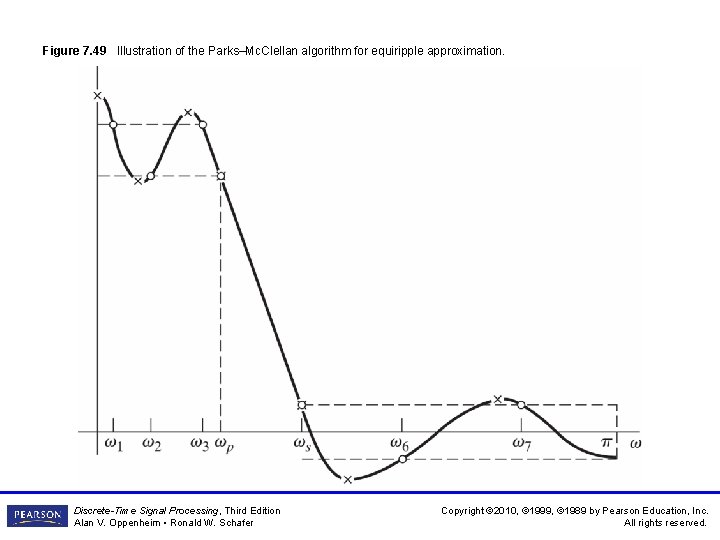
Figure 7. 49 Illustration of the Parks–Mc. Clellan algorithm for equiripple approximation. Discrete-Time Signal Processing, Third Edition Alan V. Oppenheim • Ronald W. Schafer Copyright © 2010, © 1999, © 1989 by Pearson Education, Inc. All rights reserved.
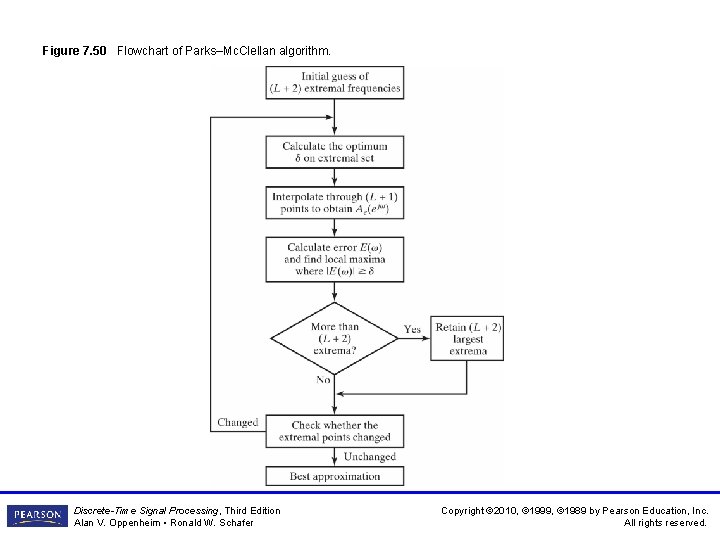
Figure 7. 50 Flowchart of Parks–Mc. Clellan algorithm. Discrete-Time Signal Processing, Third Edition Alan V. Oppenheim • Ronald W. Schafer Copyright © 2010, © 1999, © 1989 by Pearson Education, Inc. All rights reserved.
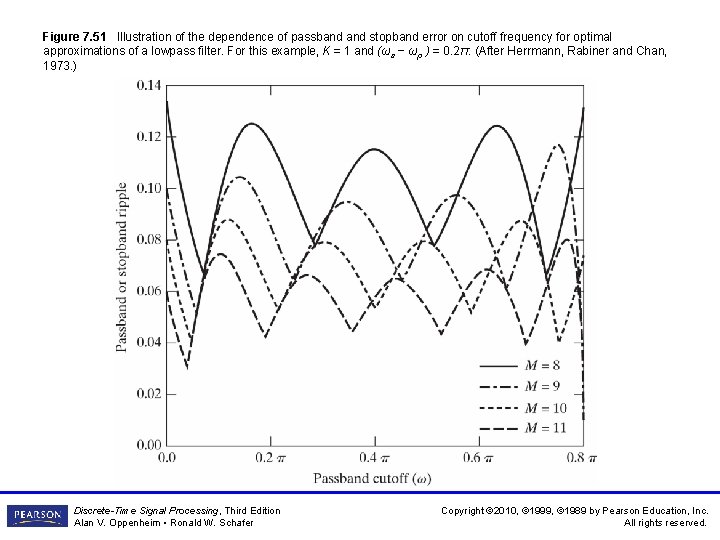
Figure 7. 51 Illustration of the dependence of passband stopband error on cutoff frequency for optimal approximations of a lowpass filter. For this example, K = 1 and (ωs − ωp ) = 0. 2π. (After Herrmann, Rabiner and Chan, 1973. ) Discrete-Time Signal Processing, Third Edition Alan V. Oppenheim • Ronald W. Schafer Copyright © 2010, © 1999, © 1989 by Pearson Education, Inc. All rights reserved.
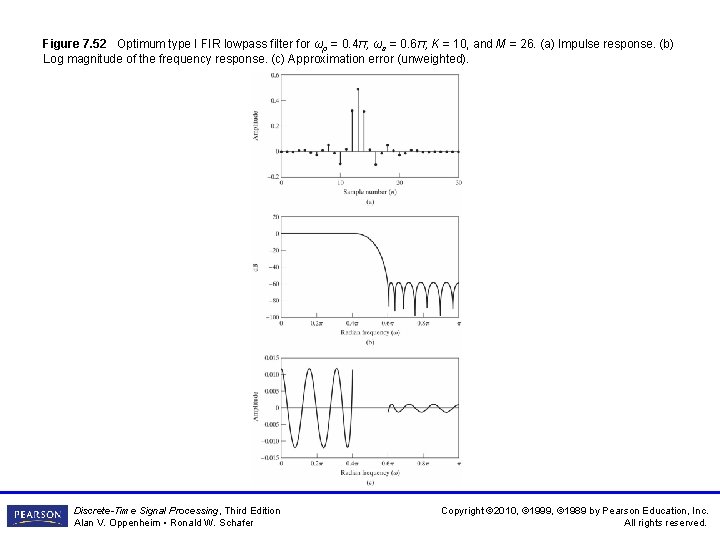
Figure 7. 52 Optimum type I FIR lowpass filter for ωp = 0. 4π, ωs = 0. 6π, K = 10, and M = 26. (a) Impulse response. (b) Log magnitude of the frequency response. (c) Approximation error (unweighted). Discrete-Time Signal Processing, Third Edition Alan V. Oppenheim • Ronald W. Schafer Copyright © 2010, © 1999, © 1989 by Pearson Education, Inc. All rights reserved.
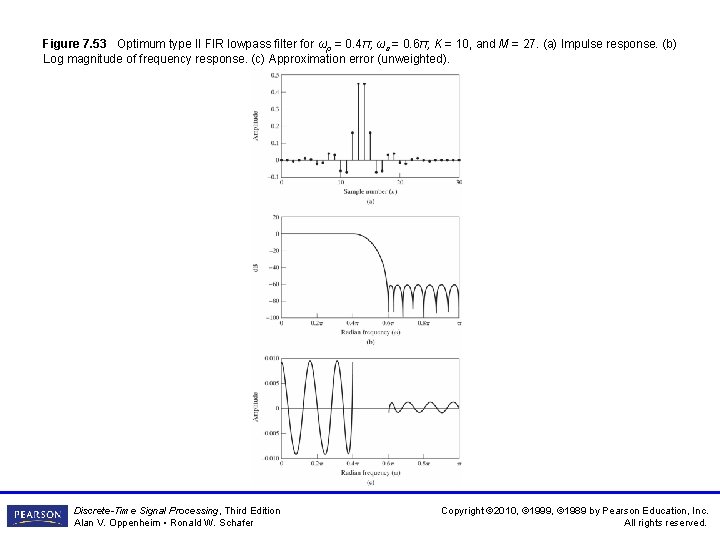
Figure 7. 53 Optimum type II FIR lowpass filter for ωp = 0. 4π, ωs = 0. 6π, K = 10, and M = 27. (a) Impulse response. (b) Log magnitude of frequency response. (c) Approximation error (unweighted). Discrete-Time Signal Processing, Third Edition Alan V. Oppenheim • Ronald W. Schafer Copyright © 2010, © 1999, © 1989 by Pearson Education, Inc. All rights reserved.
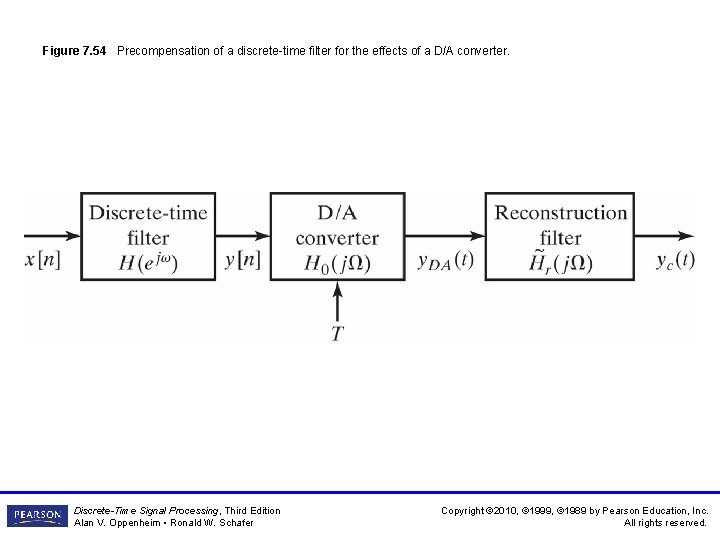
Figure 7. 54 Precompensation of a discrete-time filter for the effects of a D/A converter. Discrete-Time Signal Processing, Third Edition Alan V. Oppenheim • Ronald W. Schafer Copyright © 2010, © 1999, © 1989 by Pearson Education, Inc. All rights reserved.
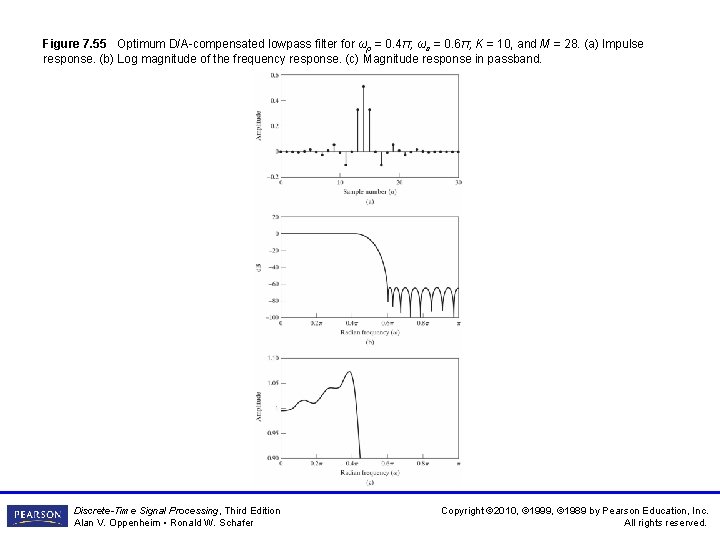
Figure 7. 55 Optimum D/A-compensated lowpass filter for ωp = 0. 4π, ωs = 0. 6π, K = 10, and M = 28. (a) Impulse response. (b) Log magnitude of the frequency response. (c) Magnitude response in passband. Discrete-Time Signal Processing, Third Edition Alan V. Oppenheim • Ronald W. Schafer Copyright © 2010, © 1999, © 1989 by Pearson Education, Inc. All rights reserved.
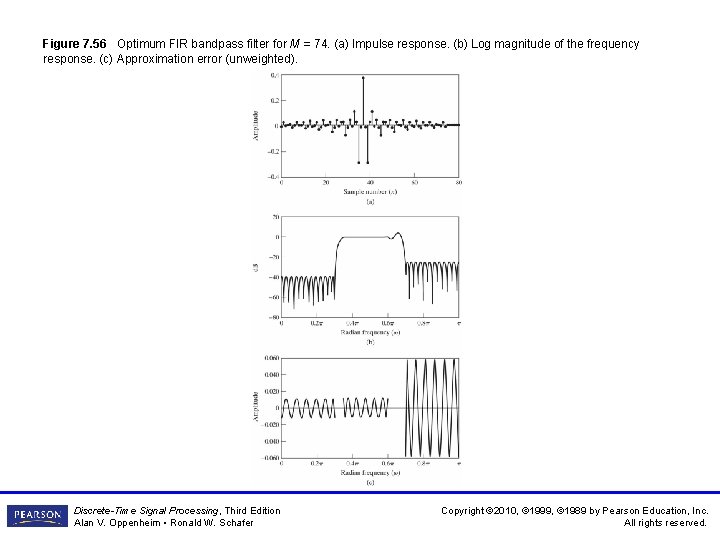
Figure 7. 56 Optimum FIR bandpass filter for M = 74. (a) Impulse response. (b) Log magnitude of the frequency response. (c) Approximation error (unweighted). Discrete-Time Signal Processing, Third Edition Alan V. Oppenheim • Ronald W. Schafer Copyright © 2010, © 1999, © 1989 by Pearson Education, Inc. All rights reserved.
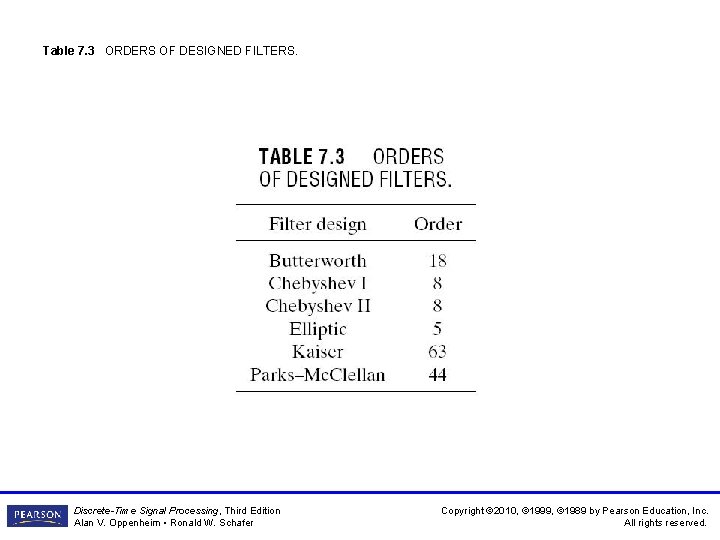
Table 7. 3 ORDERS OF DESIGNED FILTERS. Discrete-Time Signal Processing, Third Edition Alan V. Oppenheim • Ronald W. Schafer Copyright © 2010, © 1999, © 1989 by Pearson Education, Inc. All rights reserved.
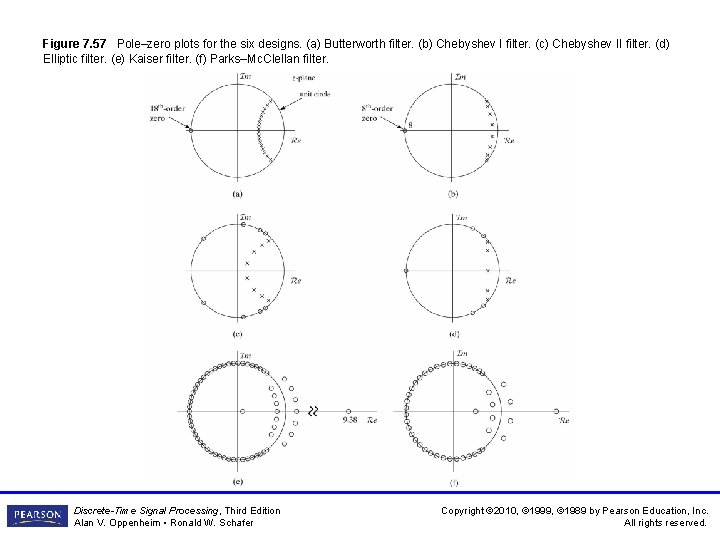
Figure 7. 57 Pole–zero plots for the six designs. (a) Butterworth filter. (b) Chebyshev I filter. (c) Chebyshev II filter. (d) Elliptic filter. (e) Kaiser filter. (f) Parks–Mc. Clellan filter. Discrete-Time Signal Processing, Third Edition Alan V. Oppenheim • Ronald W. Schafer Copyright © 2010, © 1999, © 1989 by Pearson Education, Inc. All rights reserved.
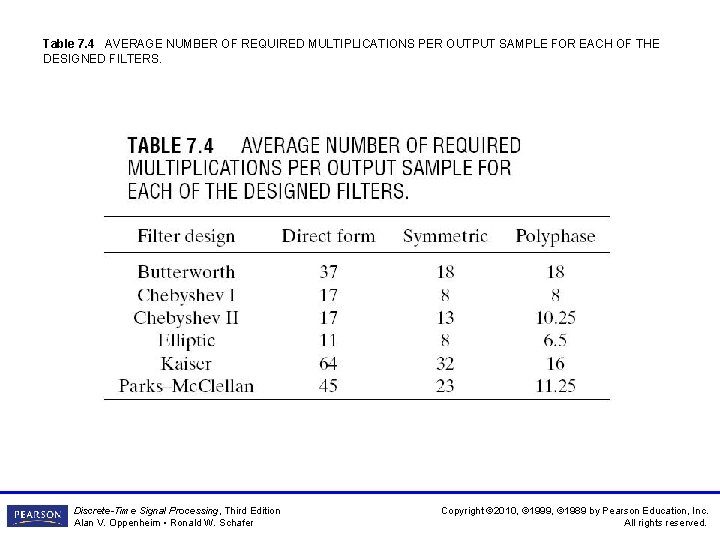
Table 7. 4 AVERAGE NUMBER OF REQUIRED MULTIPLICATIONS PER OUTPUT SAMPLE FOR EACH OF THE DESIGNED FILTERS. Discrete-Time Signal Processing, Third Edition Alan V. Oppenheim • Ronald W. Schafer Copyright © 2010, © 1999, © 1989 by Pearson Education, Inc. All rights reserved.
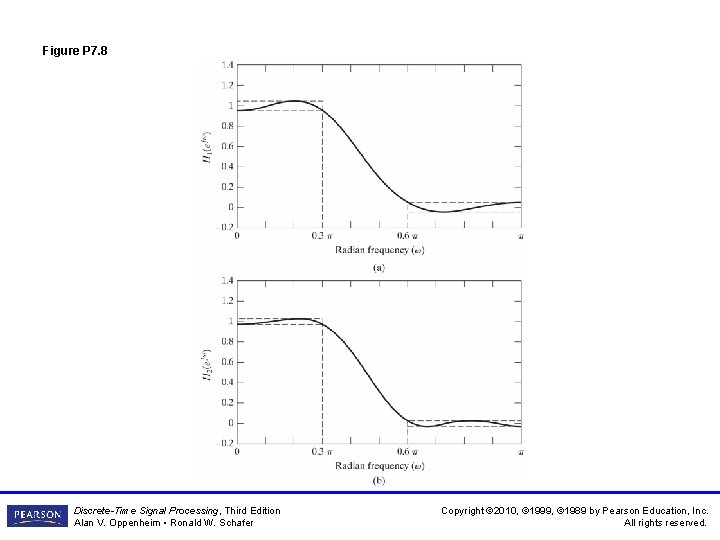
Figure P 7. 8 Discrete-Time Signal Processing, Third Edition Alan V. Oppenheim • Ronald W. Schafer Copyright © 2010, © 1999, © 1989 by Pearson Education, Inc. All rights reserved.
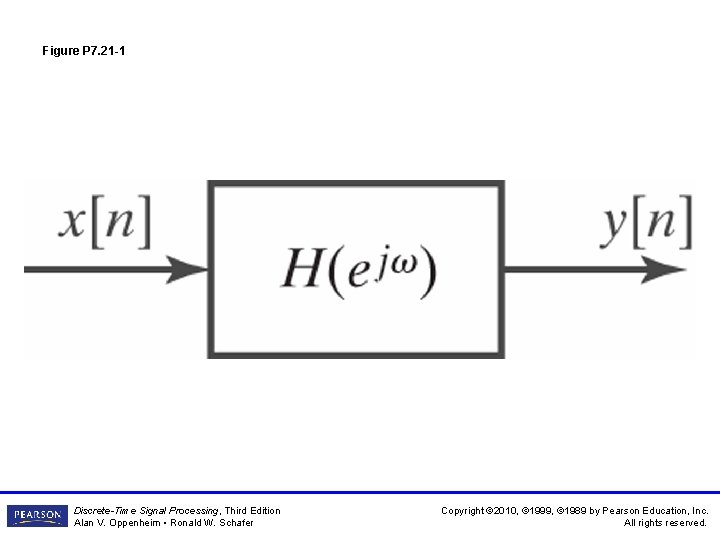
Figure P 7. 21 -1 Discrete-Time Signal Processing, Third Edition Alan V. Oppenheim • Ronald W. Schafer Copyright © 2010, © 1999, © 1989 by Pearson Education, Inc. All rights reserved.
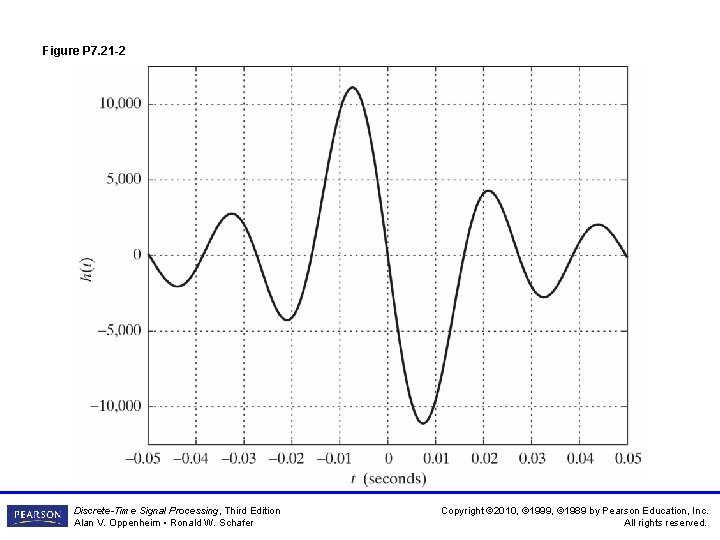
Figure P 7. 21 -2 Discrete-Time Signal Processing, Third Edition Alan V. Oppenheim • Ronald W. Schafer Copyright © 2010, © 1999, © 1989 by Pearson Education, Inc. All rights reserved.
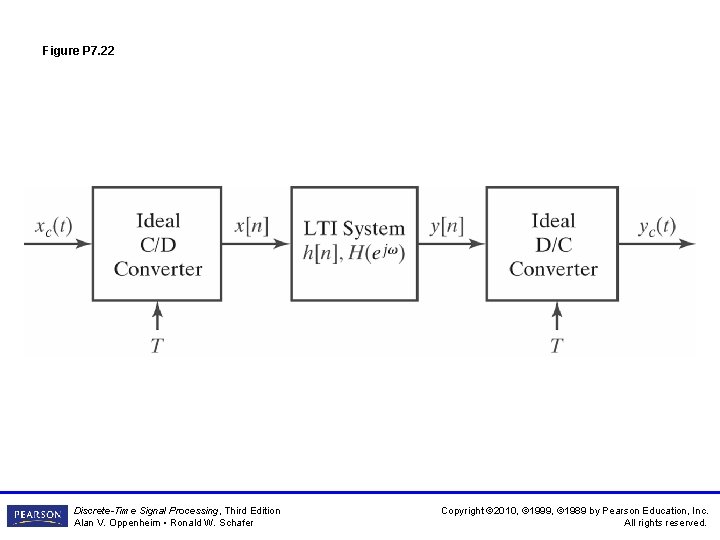
Figure P 7. 22 Discrete-Time Signal Processing, Third Edition Alan V. Oppenheim • Ronald W. Schafer Copyright © 2010, © 1999, © 1989 by Pearson Education, Inc. All rights reserved.
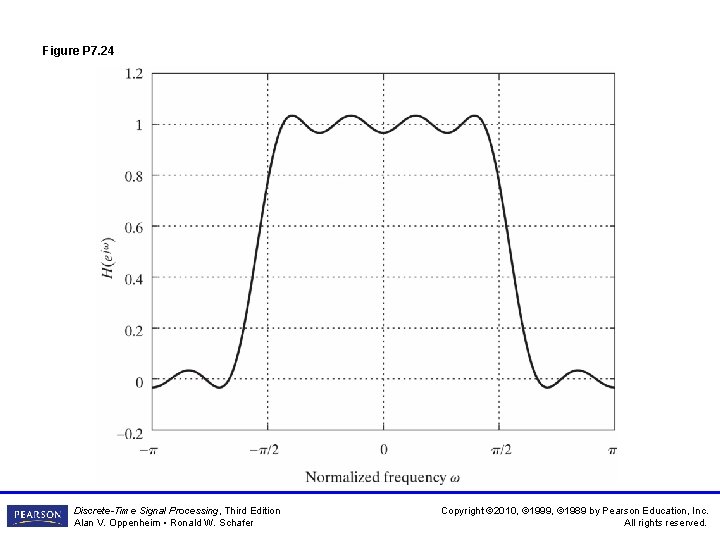
Figure P 7. 24 Discrete-Time Signal Processing, Third Edition Alan V. Oppenheim • Ronald W. Schafer Copyright © 2010, © 1999, © 1989 by Pearson Education, Inc. All rights reserved.
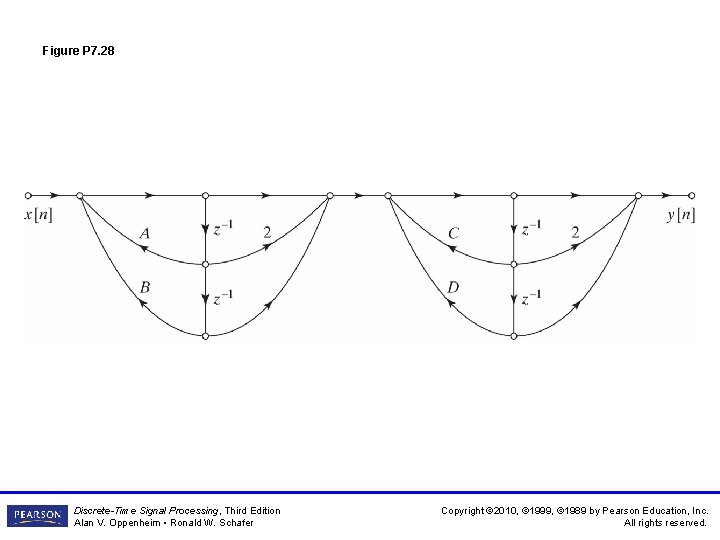
Figure P 7. 28 Discrete-Time Signal Processing, Third Edition Alan V. Oppenheim • Ronald W. Schafer Copyright © 2010, © 1999, © 1989 by Pearson Education, Inc. All rights reserved.
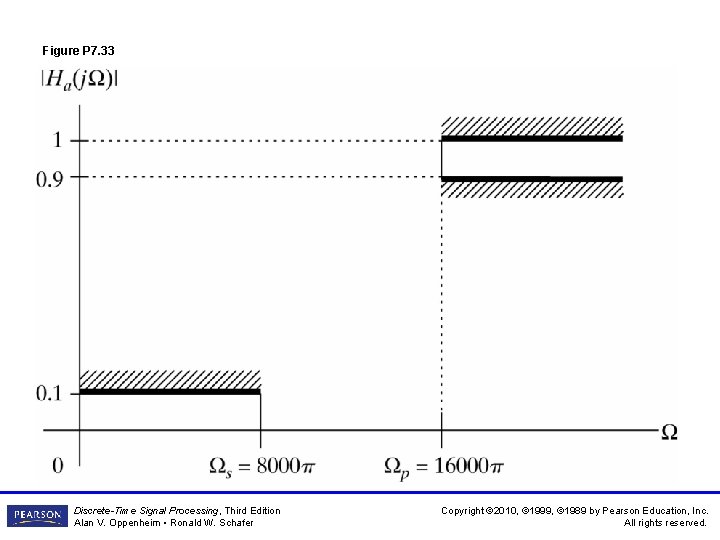
Figure P 7. 33 Discrete-Time Signal Processing, Third Edition Alan V. Oppenheim • Ronald W. Schafer Copyright © 2010, © 1999, © 1989 by Pearson Education, Inc. All rights reserved.
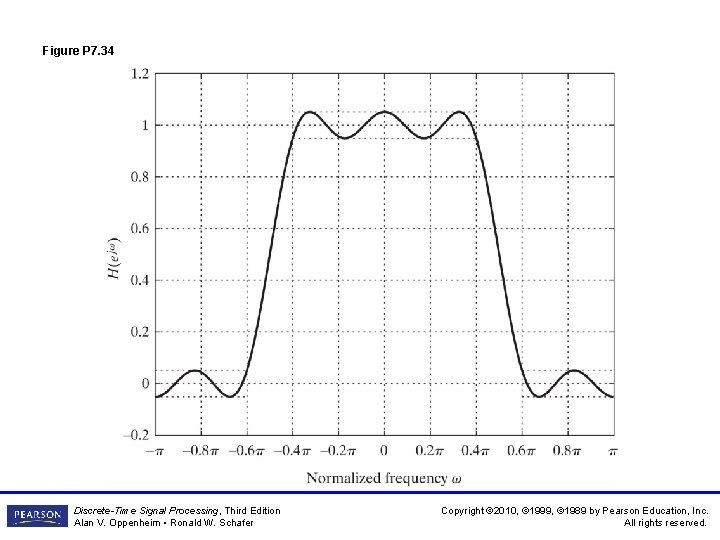
Figure P 7. 34 Discrete-Time Signal Processing, Third Edition Alan V. Oppenheim • Ronald W. Schafer Copyright © 2010, © 1999, © 1989 by Pearson Education, Inc. All rights reserved.
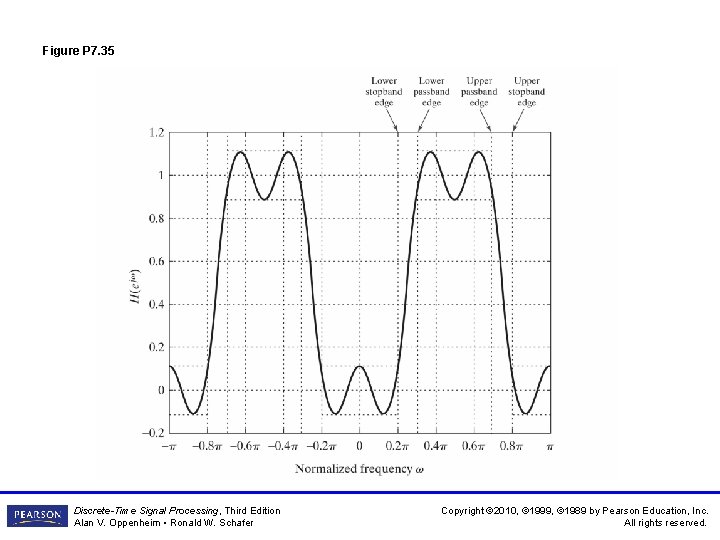
Figure P 7. 35 Discrete-Time Signal Processing, Third Edition Alan V. Oppenheim • Ronald W. Schafer Copyright © 2010, © 1999, © 1989 by Pearson Education, Inc. All rights reserved.
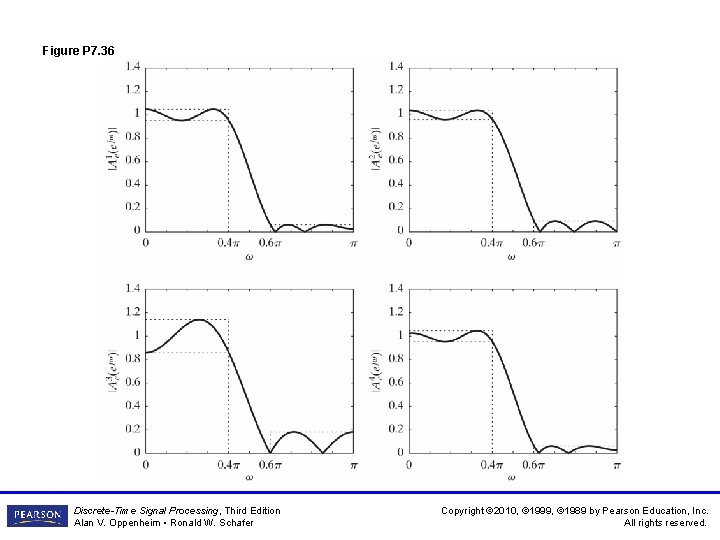
Figure P 7. 36 Discrete-Time Signal Processing, Third Edition Alan V. Oppenheim • Ronald W. Schafer Copyright © 2010, © 1999, © 1989 by Pearson Education, Inc. All rights reserved.
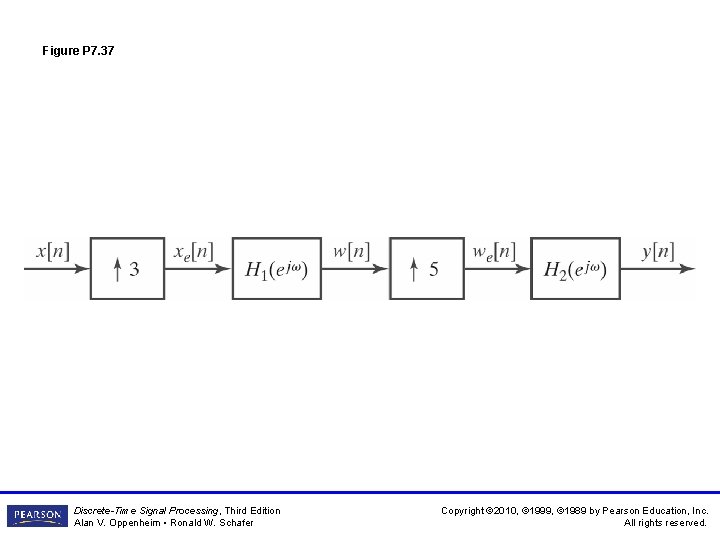
Figure P 7. 37 Discrete-Time Signal Processing, Third Edition Alan V. Oppenheim • Ronald W. Schafer Copyright © 2010, © 1999, © 1989 by Pearson Education, Inc. All rights reserved.
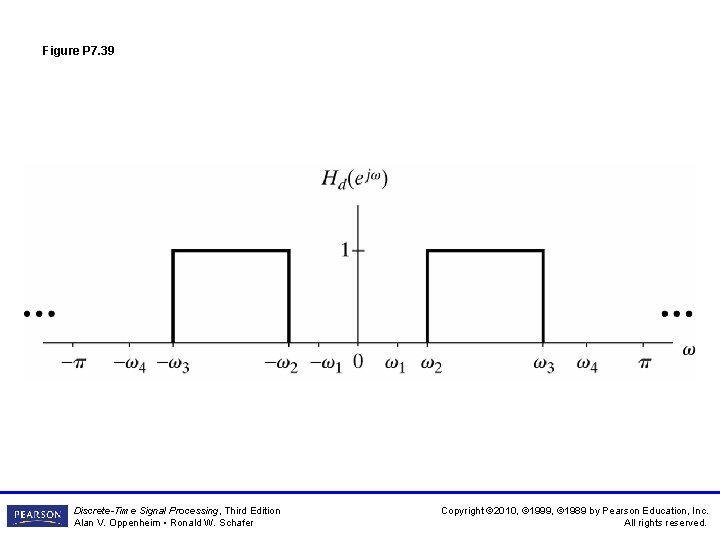
Figure P 7. 39 Discrete-Time Signal Processing, Third Edition Alan V. Oppenheim • Ronald W. Schafer Copyright © 2010, © 1999, © 1989 by Pearson Education, Inc. All rights reserved.
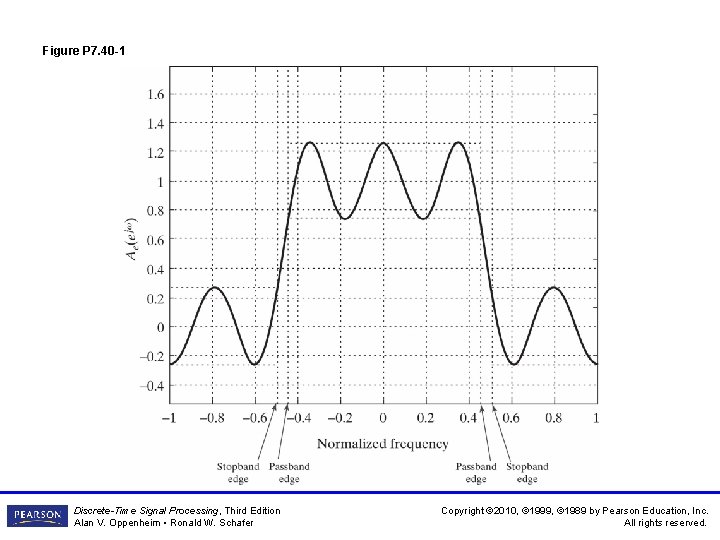
Figure P 7. 40 -1 Discrete-Time Signal Processing, Third Edition Alan V. Oppenheim • Ronald W. Schafer Copyright © 2010, © 1999, © 1989 by Pearson Education, Inc. All rights reserved.
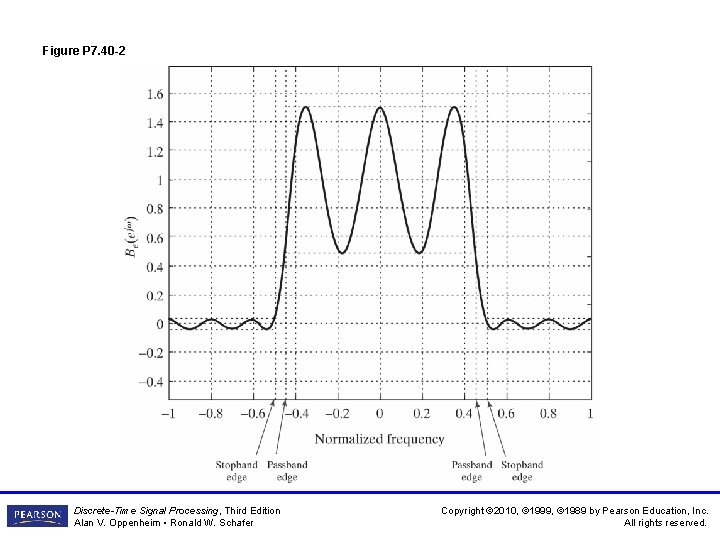
Figure P 7. 40 -2 Discrete-Time Signal Processing, Third Edition Alan V. Oppenheim • Ronald W. Schafer Copyright © 2010, © 1999, © 1989 by Pearson Education, Inc. All rights reserved.
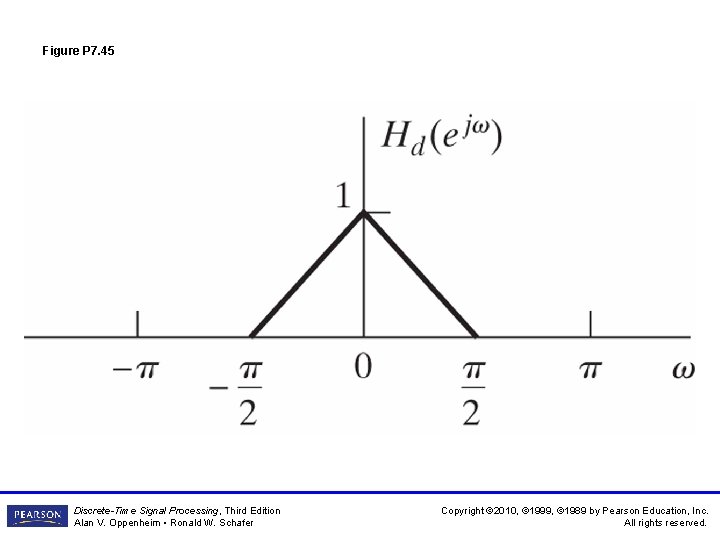
Figure P 7. 45 Discrete-Time Signal Processing, Third Edition Alan V. Oppenheim • Ronald W. Schafer Copyright © 2010, © 1999, © 1989 by Pearson Education, Inc. All rights reserved.
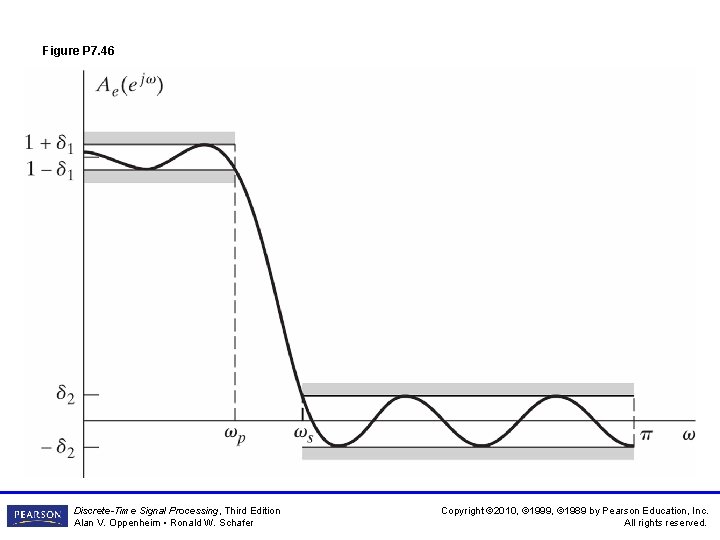
Figure P 7. 46 Discrete-Time Signal Processing, Third Edition Alan V. Oppenheim • Ronald W. Schafer Copyright © 2010, © 1999, © 1989 by Pearson Education, Inc. All rights reserved.
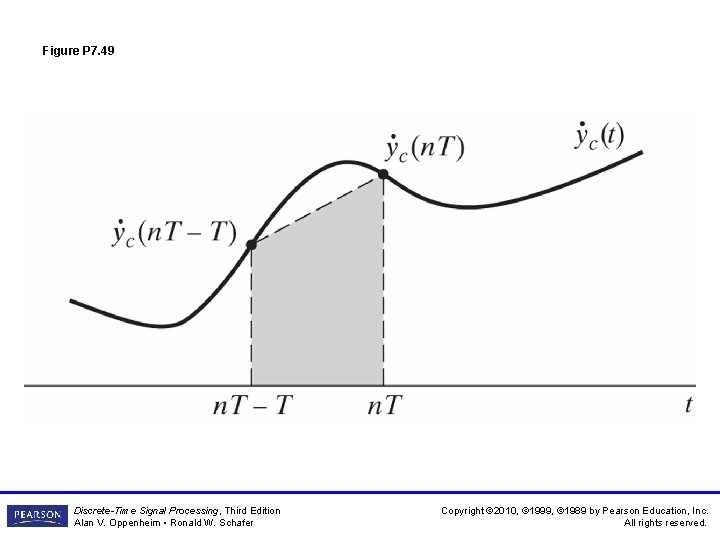
Figure P 7. 49 Discrete-Time Signal Processing, Third Edition Alan V. Oppenheim • Ronald W. Schafer Copyright © 2010, © 1999, © 1989 by Pearson Education, Inc. All rights reserved.
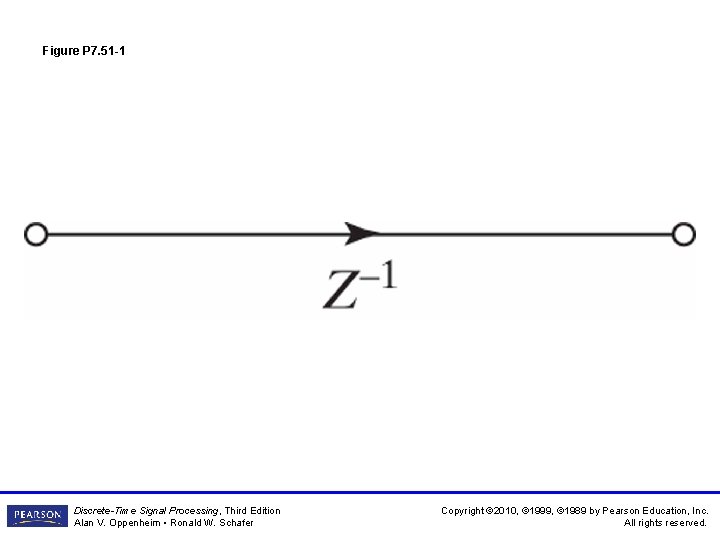
Figure P 7. 51 -1 Discrete-Time Signal Processing, Third Edition Alan V. Oppenheim • Ronald W. Schafer Copyright © 2010, © 1999, © 1989 by Pearson Education, Inc. All rights reserved.
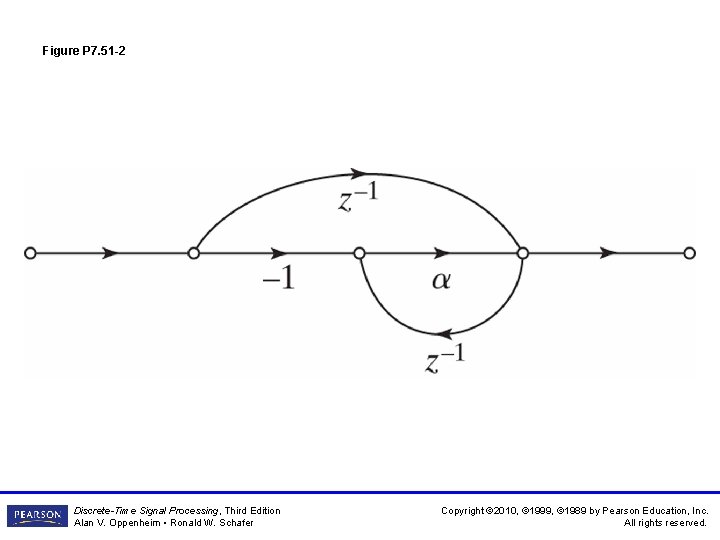
Figure P 7. 51 -2 Discrete-Time Signal Processing, Third Edition Alan V. Oppenheim • Ronald W. Schafer Copyright © 2010, © 1999, © 1989 by Pearson Education, Inc. All rights reserved.
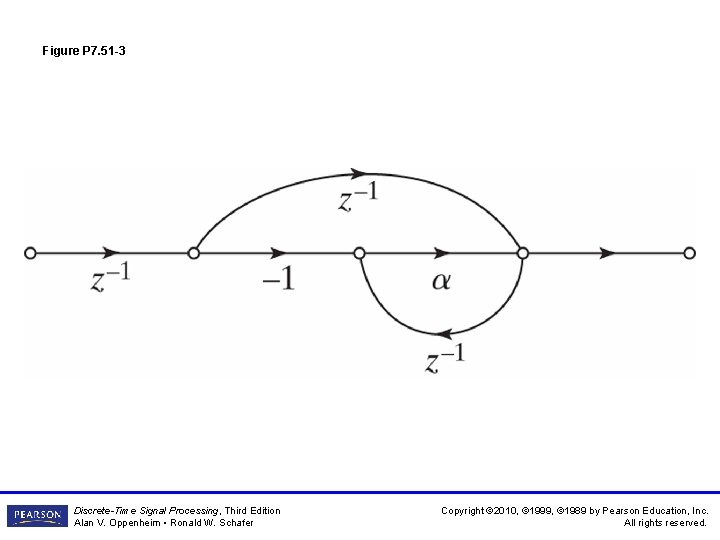
Figure P 7. 51 -3 Discrete-Time Signal Processing, Third Edition Alan V. Oppenheim • Ronald W. Schafer Copyright © 2010, © 1999, © 1989 by Pearson Education, Inc. All rights reserved.
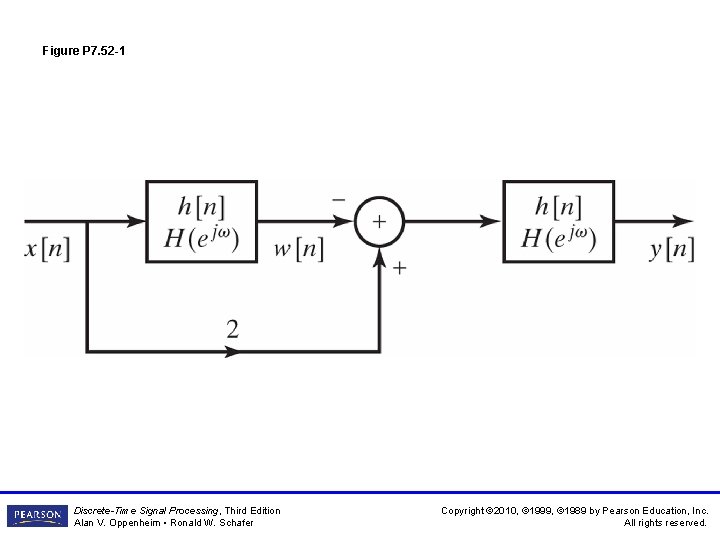
Figure P 7. 52 -1 Discrete-Time Signal Processing, Third Edition Alan V. Oppenheim • Ronald W. Schafer Copyright © 2010, © 1999, © 1989 by Pearson Education, Inc. All rights reserved.
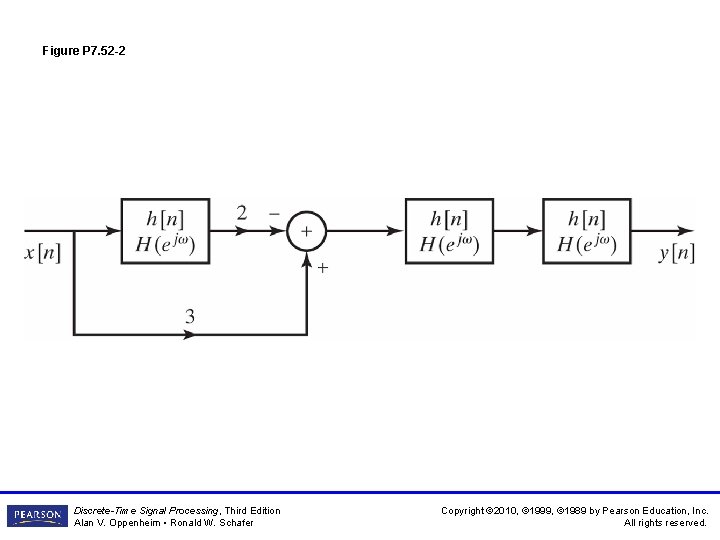
Figure P 7. 52 -2 Discrete-Time Signal Processing, Third Edition Alan V. Oppenheim • Ronald W. Schafer Copyright © 2010, © 1999, © 1989 by Pearson Education, Inc. All rights reserved.
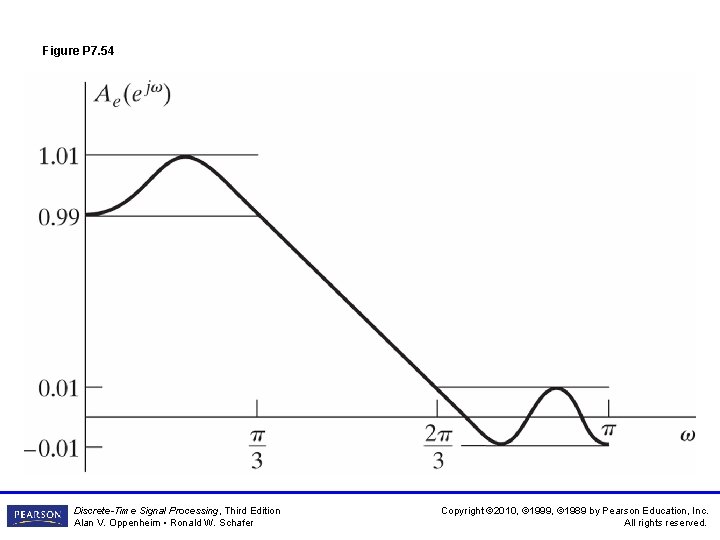
Figure P 7. 54 Discrete-Time Signal Processing, Third Edition Alan V. Oppenheim • Ronald W. Schafer Copyright © 2010, © 1999, © 1989 by Pearson Education, Inc. All rights reserved.
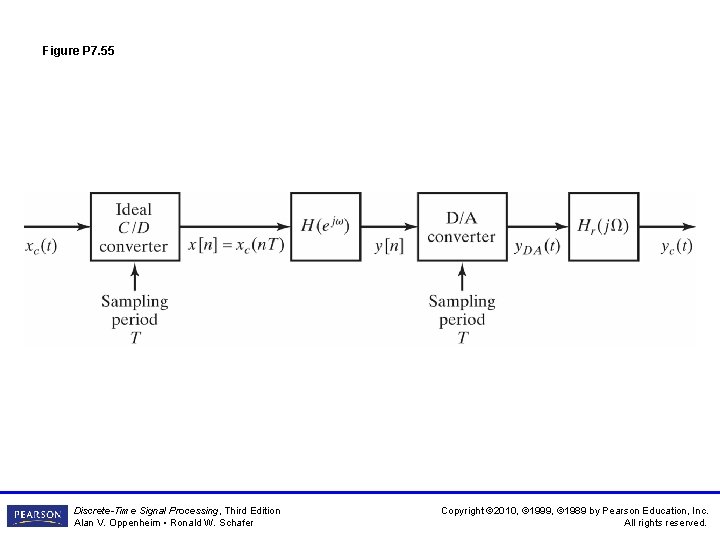
Figure P 7. 55 Discrete-Time Signal Processing, Third Edition Alan V. Oppenheim • Ronald W. Schafer Copyright © 2010, © 1999, © 1989 by Pearson Education, Inc. All rights reserved.
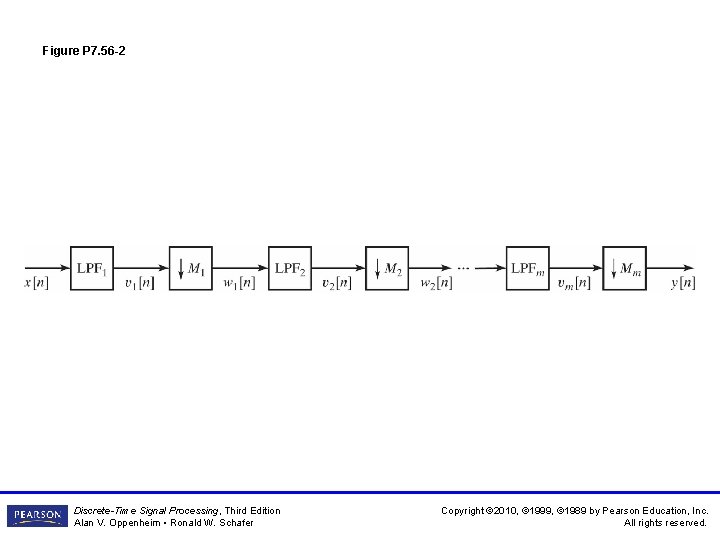
Figure P 7. 56 -1 Discrete-Time Signal Processing, Third Edition Alan V. Oppenheim • Ronald W. Schafer Copyright © 2010, © 1999, © 1989 by Pearson Education, Inc. All rights reserved.
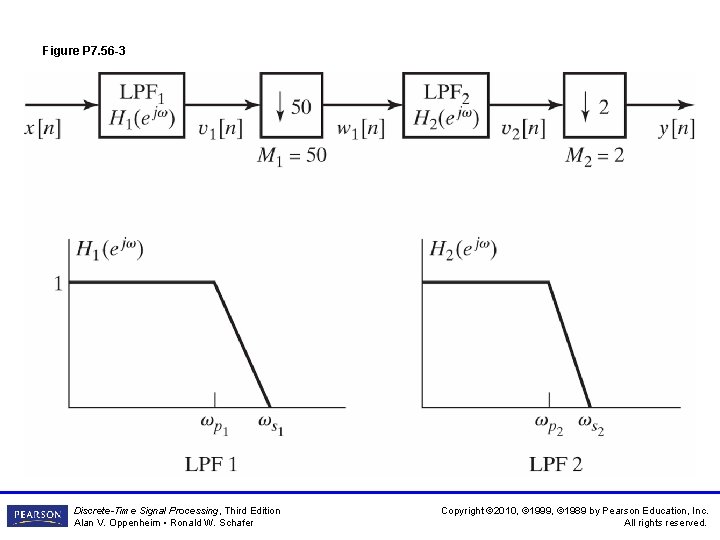
Figure P 7. 56 -2 Discrete-Time Signal Processing, Third Edition Alan V. Oppenheim • Ronald W. Schafer Copyright © 2010, © 1999, © 1989 by Pearson Education, Inc. All rights reserved.
Figure P 7. 56 -3 Discrete-Time Signal Processing, Third Edition Alan V. Oppenheim • Ronald W. Schafer Copyright © 2010, © 1999, © 1989 by Pearson Education, Inc. All rights reserved.
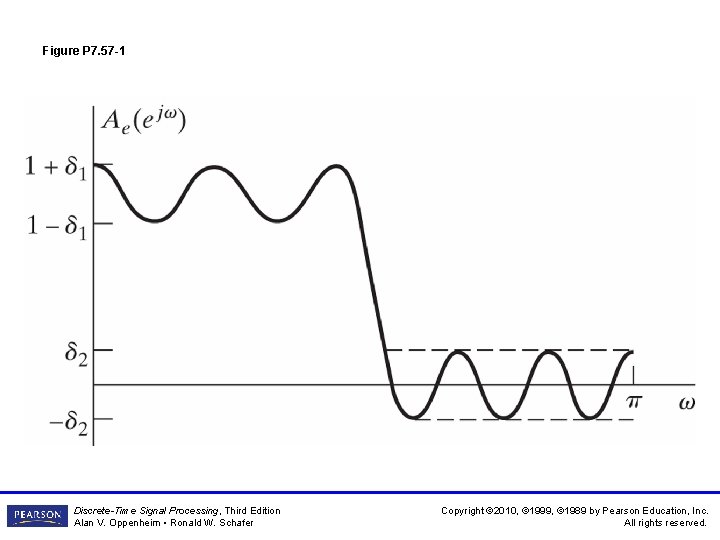
Figure P 7. 57 -1 Discrete-Time Signal Processing, Third Edition Alan V. Oppenheim • Ronald W. Schafer Copyright © 2010, © 1999, © 1989 by Pearson Education, Inc. All rights reserved.
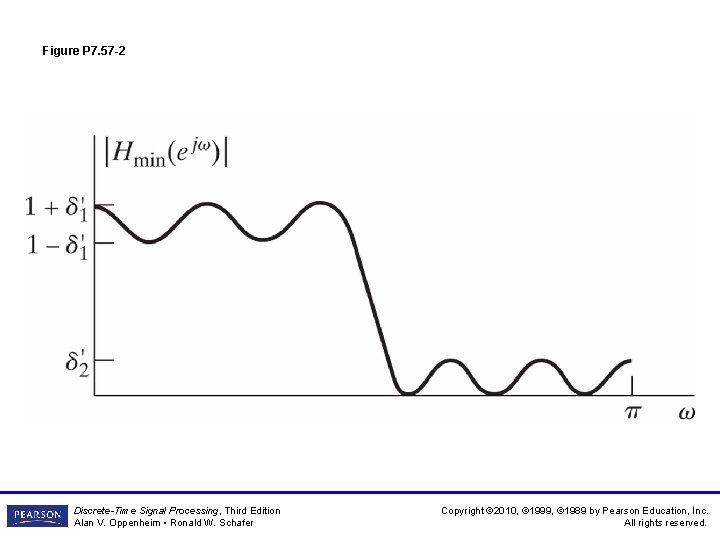
Figure P 7. 57 -2 Discrete-Time Signal Processing, Third Edition Alan V. Oppenheim • Ronald W. Schafer Copyright © 2010, © 1999, © 1989 by Pearson Education, Inc. All rights reserved.
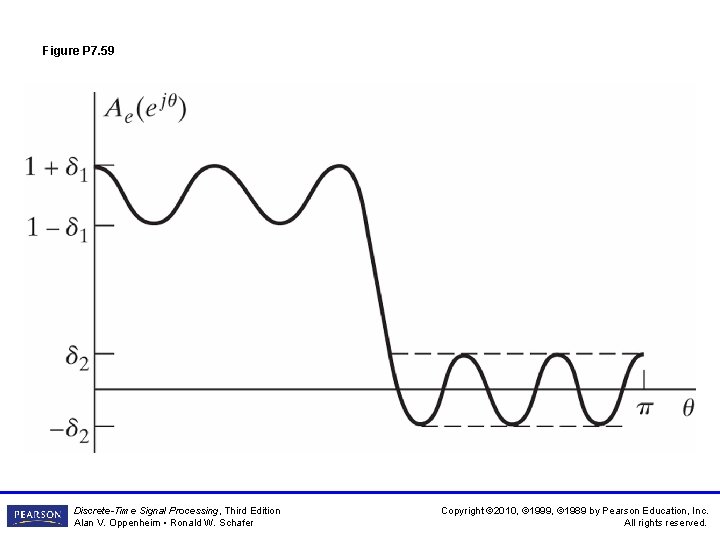
Figure P 7. 59 Discrete-Time Signal Processing, Third Edition Alan V. Oppenheim • Ronald W. Schafer Copyright © 2010, © 1999, © 1989 by Pearson Education, Inc. All rights reserved.
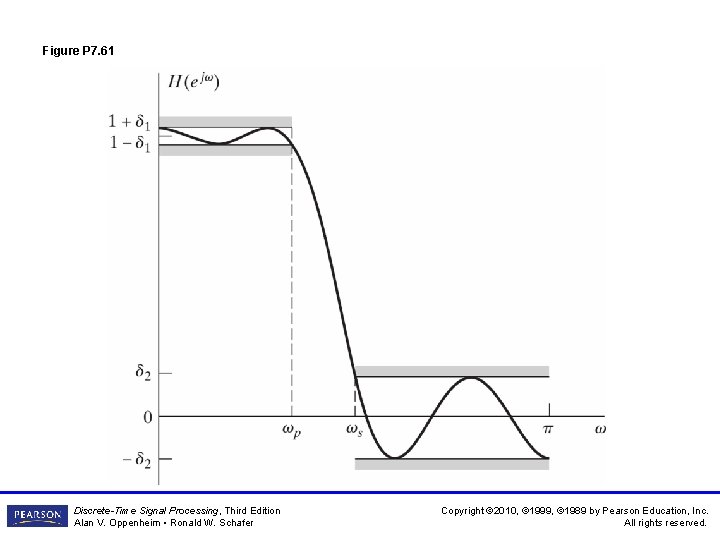
Figure P 7. 61 Discrete-Time Signal Processing, Third Edition Alan V. Oppenheim • Ronald W. Schafer Copyright © 2010, © 1999, © 1989 by Pearson Education, Inc. All rights reserved.
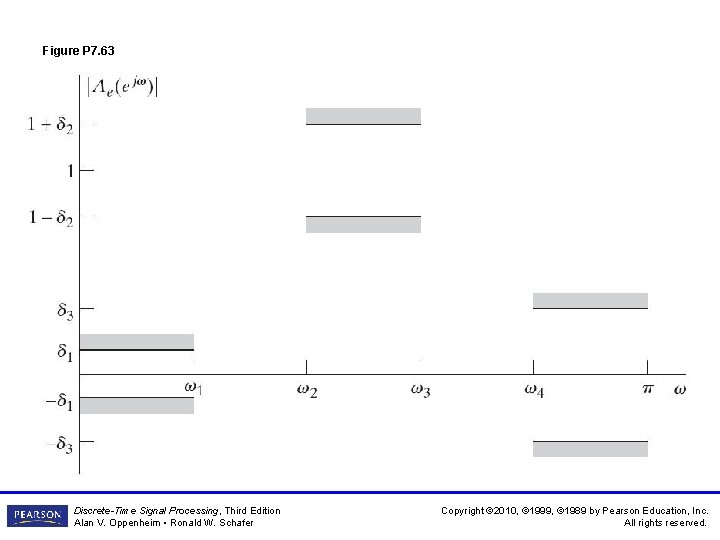
Figure P 7. 63 Discrete-Time Signal Processing, Third Edition Alan V. Oppenheim • Ronald W. Schafer Copyright © 2010, © 1999, © 1989 by Pearson Education, Inc. All rights reserved.