
Figure 5 2 Yelloweyed junco This small bird
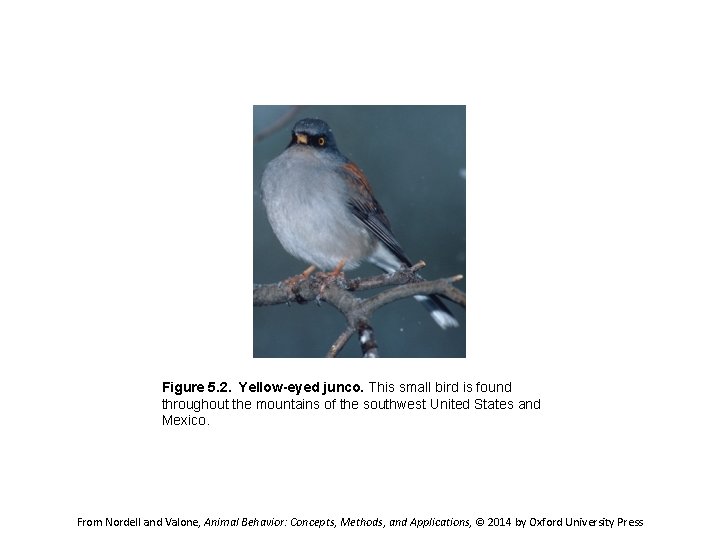
Figure 5. 2. Yellow-eyed junco. This small bird is found throughout the mountains of the southwest United States and Mexico. From Nordell and Valone, Animal Behavior: Concepts, Methods, and Applications, © 2014 by Oxford University Press
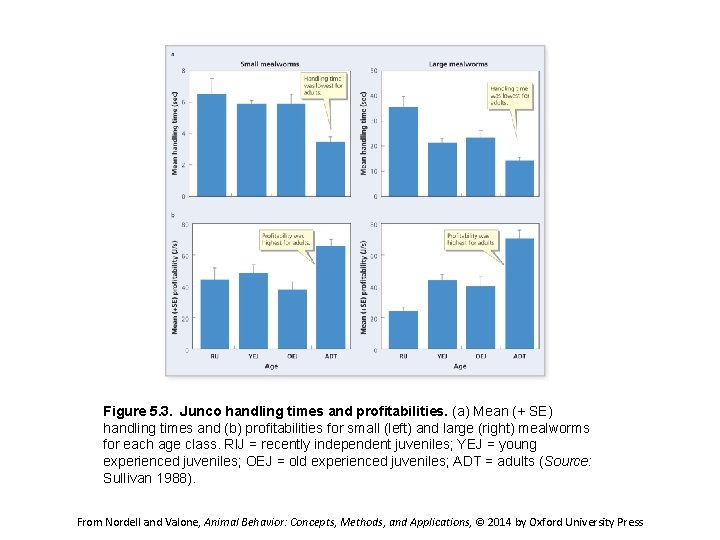
Figure 5. 3. Junco handling times and profitabilities. (a) Mean (+ SE) handling times and (b) profitabilities for small (left) and large (right) mealworms for each age class. RIJ = recently independent juveniles; YEJ = young experienced juveniles; OEJ = old experienced juveniles; ADT = adults (Source: Sullivan 1988). From Nordell and Valone, Animal Behavior: Concepts, Methods, and Applications, © 2014 by Oxford University Press
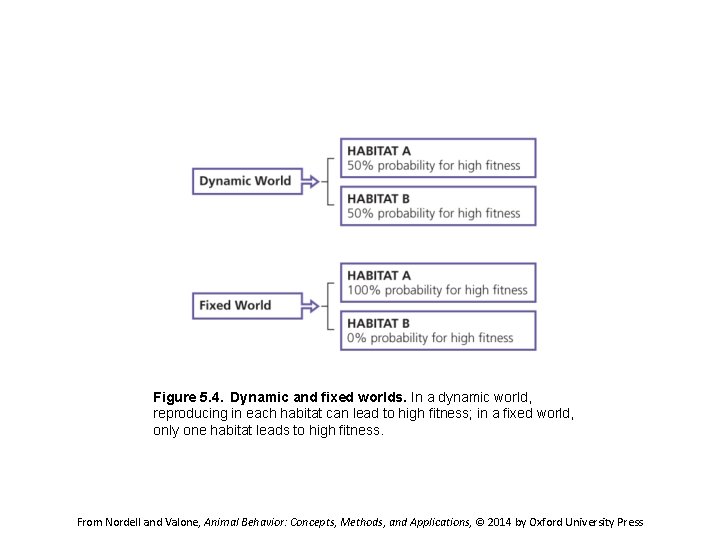
Figure 5. 4. Dynamic and fixed worlds. In a dynamic world, reproducing in each habitat can lead to high fitness; in a fixed world, only one habitat leads to high fitness. From Nordell and Valone, Animal Behavior: Concepts, Methods, and Applications, © 2014 by Oxford University Press
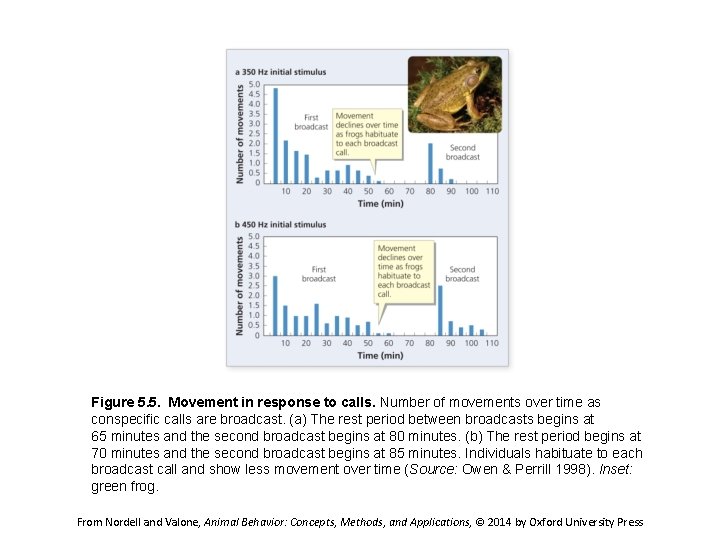
Figure 5. 5. Movement in response to calls. Number of movements over time as conspecific calls are broadcast. (a) The rest period between broadcasts begins at 65 minutes and the second broadcast begins at 80 minutes. (b) The rest period begins at 70 minutes and the second broadcast begins at 85 minutes. Individuals habituate to each broadcast call and show less movement over time (Source: Owen & Perrill 1998). Inset: green frog. From Nordell and Valone, Animal Behavior: Concepts, Methods, and Applications, © 2014 by Oxford University Press
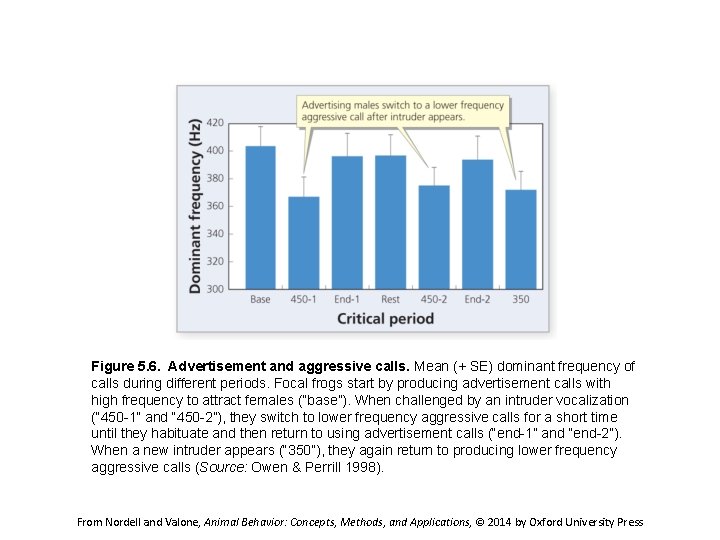
Figure 5. 6. Advertisement and aggressive calls. Mean (+ SE) dominant frequency of calls during different periods. Focal frogs start by producing advertisement calls with high frequency to attract females (“base”). When challenged by an intruder vocalization (“ 450 1” and “ 450 2”), they switch to lower frequency aggressive calls for a short time until they habituate and then return to using advertisement calls (“end 1” and “end 2”). When a new intruder appears (“ 350”), they again return to producing lower frequency aggressive calls (Source: Owen & Perrill 1998). From Nordell and Valone, Animal Behavior: Concepts, Methods, and Applications, © 2014 by Oxford University Press
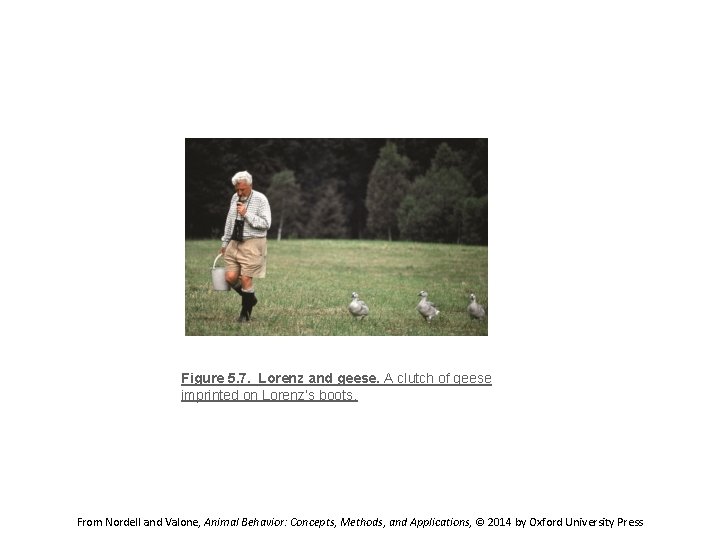
Figure 5. 7. Lorenz and geese. A clutch of geese imprinted on Lorenz’s boots. From Nordell and Valone, Animal Behavior: Concepts, Methods, and Applications, © 2014 by Oxford University Press
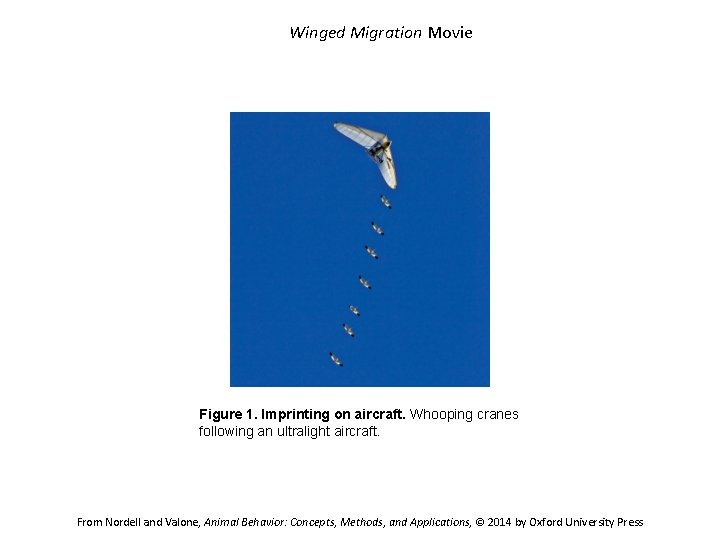
Winged Migration Movie Figure 1. Imprinting on aircraft. Whooping cranes following an ultralight aircraft. From Nordell and Valone, Animal Behavior: Concepts, Methods, and Applications, © 2014 by Oxford University Press
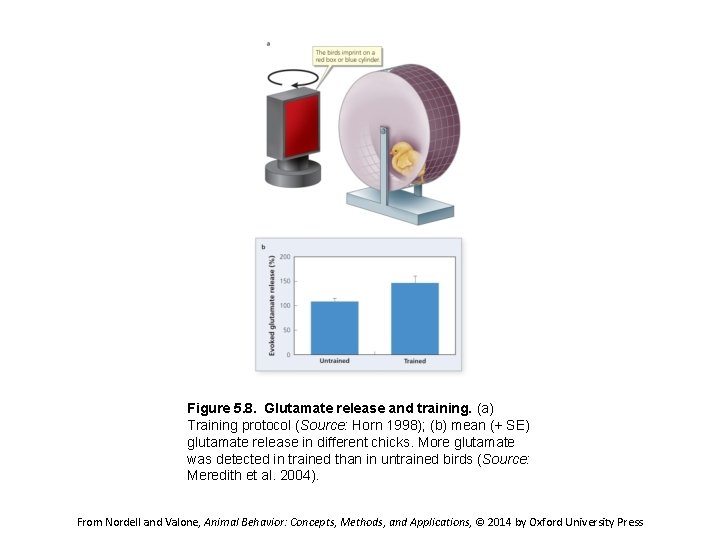
Figure 5. 8. Glutamate release and training. (a) Training protocol (Source: Horn 1998); (b) mean (+ SE) glutamate release in different chicks. More glutamate was detected in trained than in untrained birds (Source: Meredith et al. 2004). From Nordell and Valone, Animal Behavior: Concepts, Methods, and Applications, © 2014 by Oxford University Press
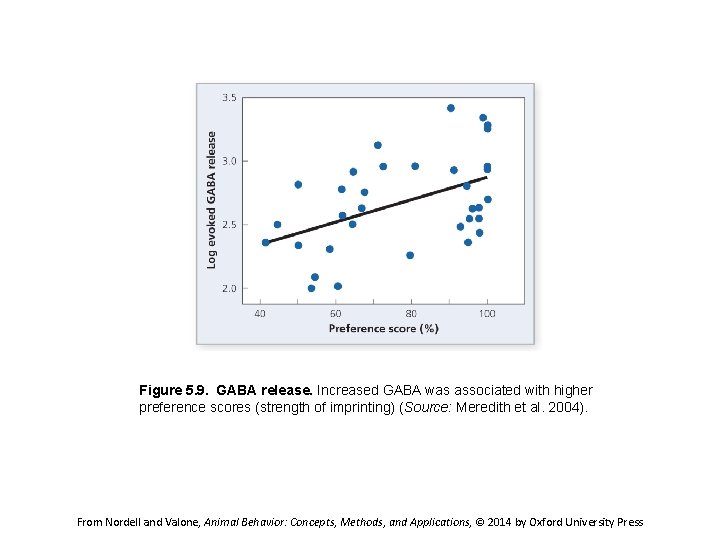
Figure 5. 9. GABA release. Increased GABA was associated with higher preference scores (strength of imprinting) (Source: Meredith et al. 2004). From Nordell and Valone, Animal Behavior: Concepts, Methods, and Applications, © 2014 by Oxford University Press
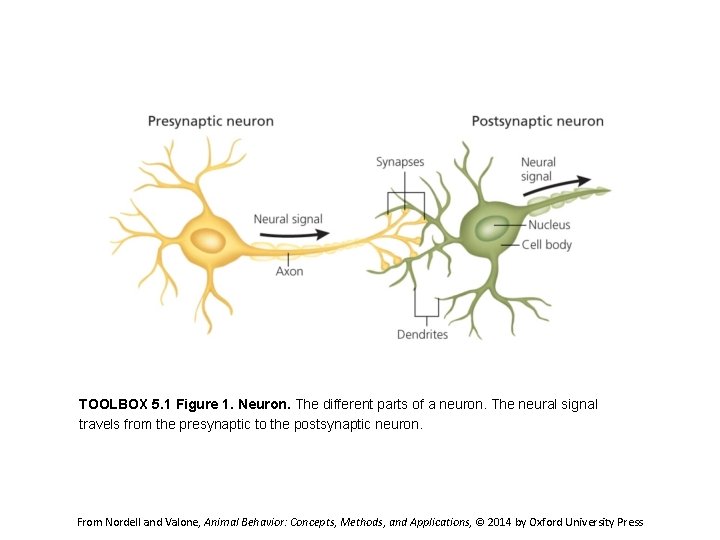
TOOLBOX 5. 1 Figure 1. Neuron. The different parts of a neuron. The neural signal travels from the presynaptic to the postsynaptic neuron. From Nordell and Valone, Animal Behavior: Concepts, Methods, and Applications, © 2014 by Oxford University Press
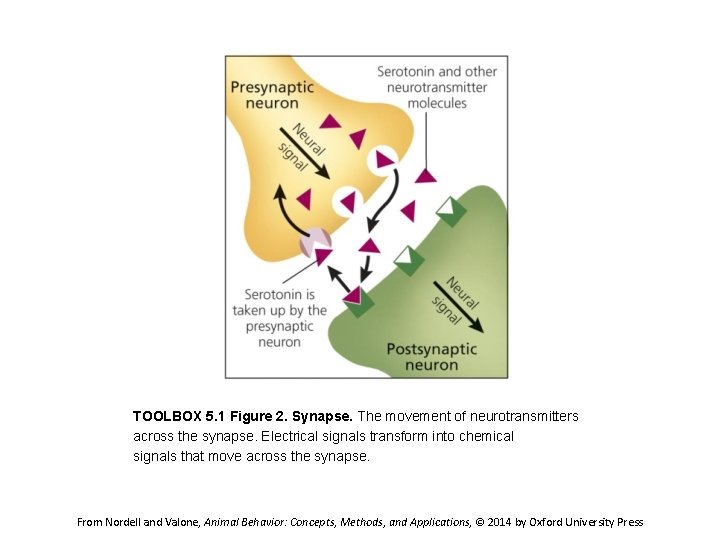
TOOLBOX 5. 1 Figure 2. Synapse. The movement of neurotransmitters across the synapse. Electrical signals transform into chemical signals that move across the synapse. From Nordell and Valone, Animal Behavior: Concepts, Methods, and Applications, © 2014 by Oxford University Press
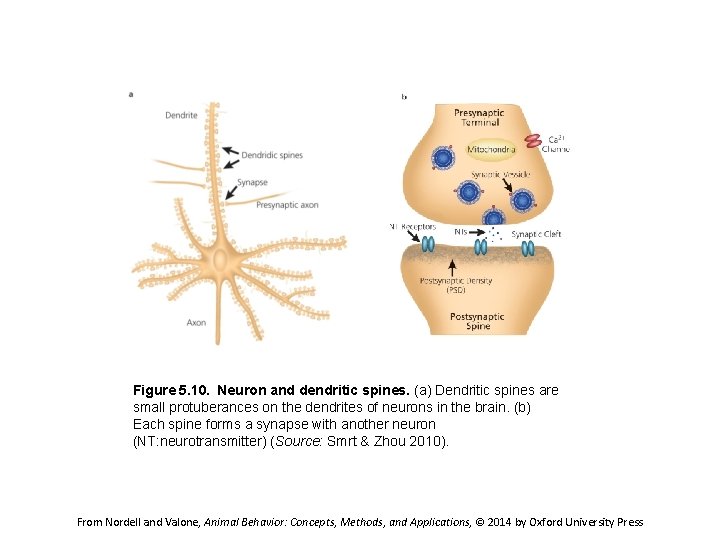
Figure 5. 10. Neuron and dendritic spines. (a) Dendritic spines are small protuberances on the dendrites of neurons in the brain. (b) Each spine forms a synapse with another neuron (NT: neurotransmitter) (Source: Smrt & Zhou 2010). From Nordell and Valone, Animal Behavior: Concepts, Methods, and Applications, © 2014 by Oxford University Press
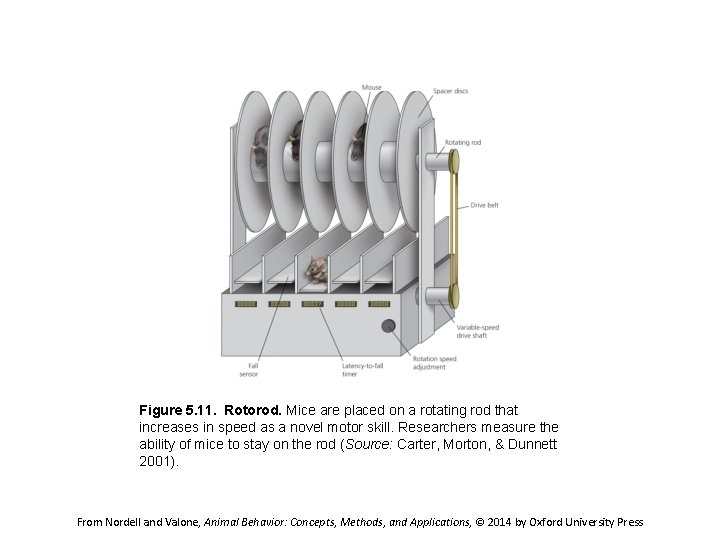
Figure 5. 11. Rotorod. Mice are placed on a rotating rod that increases in speed as a novel motor skill. Researchers measure the ability of mice to stay on the rod (Source: Carter, Morton, & Dunnett 2001). From Nordell and Valone, Animal Behavior: Concepts, Methods, and Applications, © 2014 by Oxford University Press
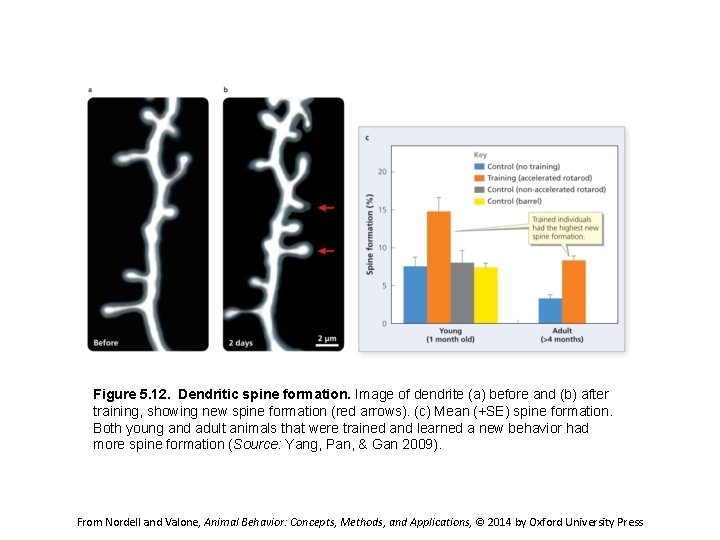
Figure 5. 12. Dendritic spine formation. Image of dendrite (a) before and (b) after training, showing new spine formation (red arrows). (c) Mean (+SE) spine formation. Both young and adult animals that were trained and learned a new behavior had more spine formation (Source: Yang, Pan, & Gan 2009). From Nordell and Valone, Animal Behavior: Concepts, Methods, and Applications, © 2014 by Oxford University Press
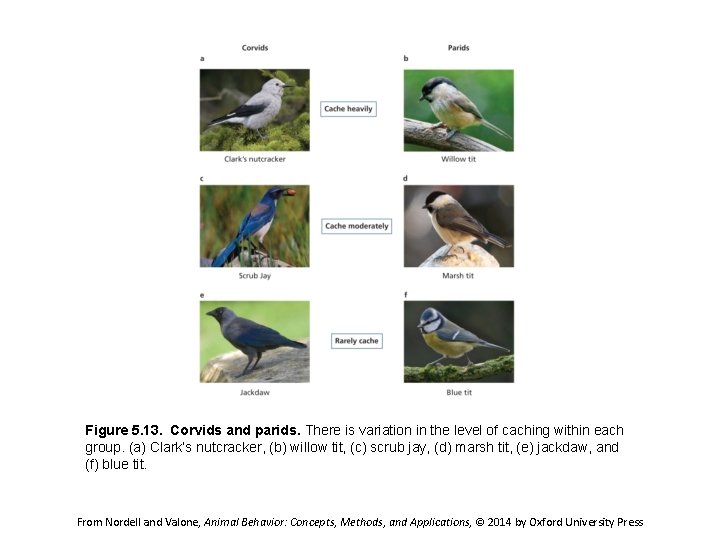
Figure 5. 13. Corvids and parids. There is variation in the level of caching within each group. (a) Clark’s nutcracker, (b) willow tit, (c) scrub jay, (d) marsh tit, (e) jackdaw, and (f) blue tit. From Nordell and Valone, Animal Behavior: Concepts, Methods, and Applications, © 2014 by Oxford University Press
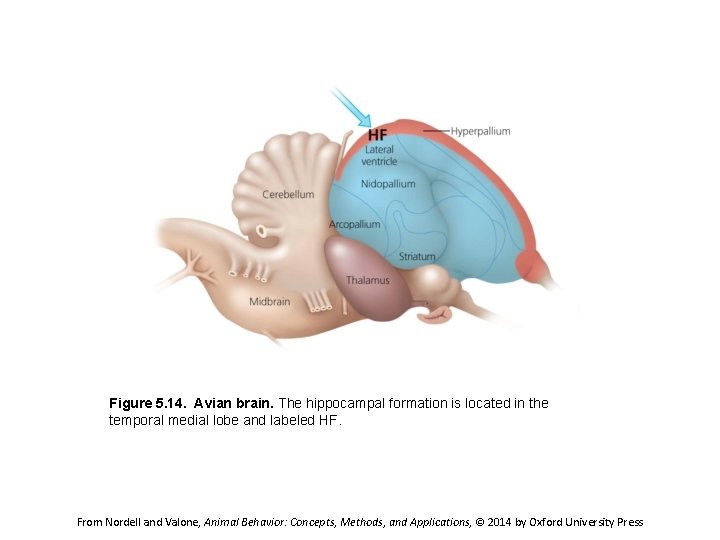
Figure 5. 14. Avian brain. The hippocampal formation is located in the temporal medial lobe and labeled HF. From Nordell and Valone, Animal Behavior: Concepts, Methods, and Applications, © 2014 by Oxford University Press
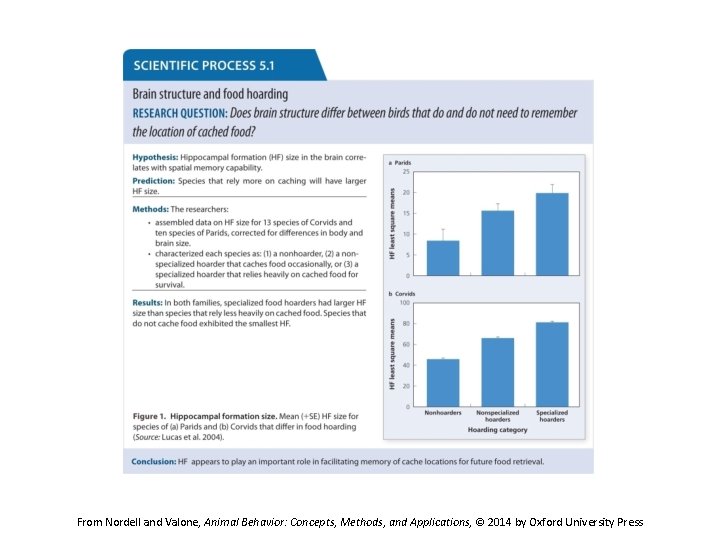
From Nordell and Valone, Animal Behavior: Concepts, Methods, and Applications, © 2014 by Oxford University Press
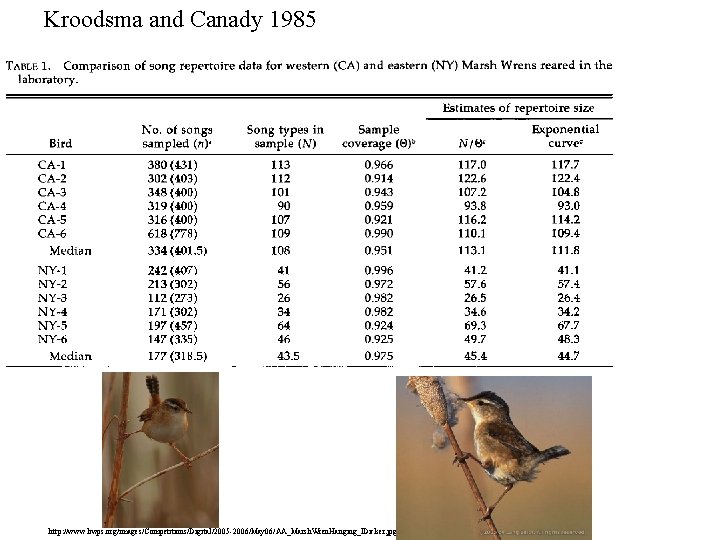
Kroodsma and Canady 1985 http: //www. bwps. org/images/Competitions/Digital/2005 -2006/May 06/AA_Marsh. Wren. Hanging_IDicker. jpg
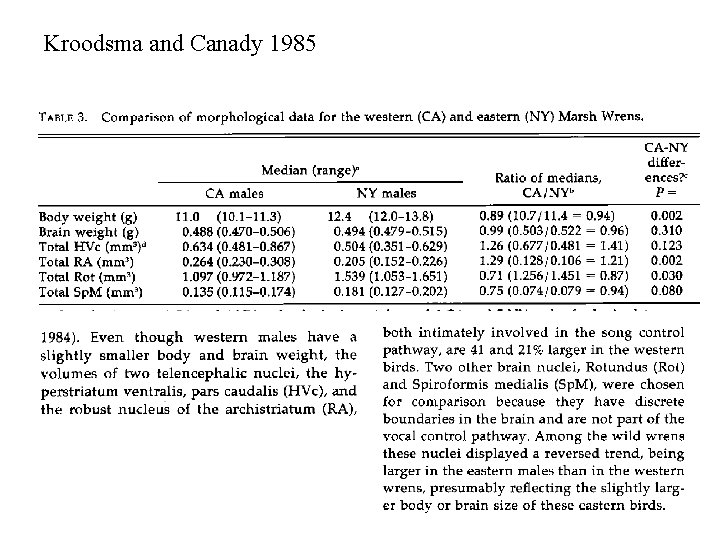
Kroodsma and Canady 1985
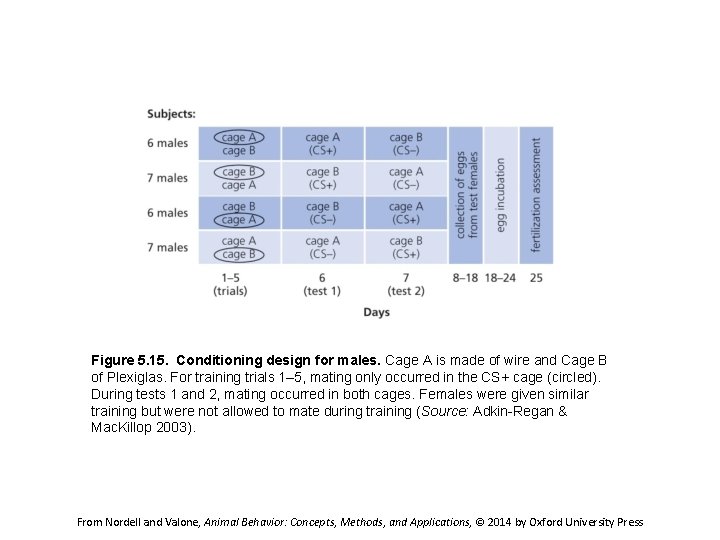
Figure 5. 15. Conditioning design for males. Cage A is made of wire and Cage B of Plexiglas. For training trials 1– 5, mating only occurred in the CS+ cage (circled). During tests 1 and 2, mating occurred in both cages. Females were given similar training but were not allowed to mate during training (Source: Adkin Regan & Mac. Killop 2003). From Nordell and Valone, Animal Behavior: Concepts, Methods, and Applications, © 2014 by Oxford University Press
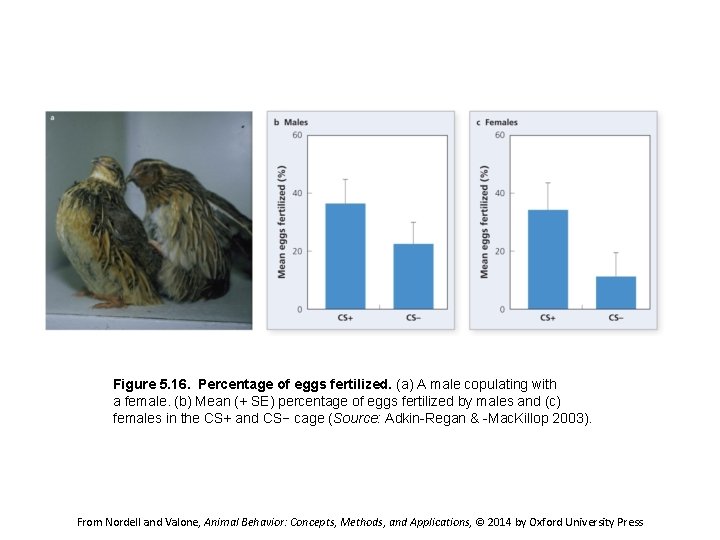
Figure 5. 16. Percentage of eggs fertilized. (a) A male copulating with a female. (b) Mean (+ SE) percentage of eggs fertilized by males and (c) females in the CS+ and CS− cage (Source: Adkin Regan & Mac. Killop 2003). From Nordell and Valone, Animal Behavior: Concepts, Methods, and Applications, © 2014 by Oxford University Press
From Nordell and Valone, Animal Behavior: Concepts, Methods, and Applications, © 2014 by Oxford University Press
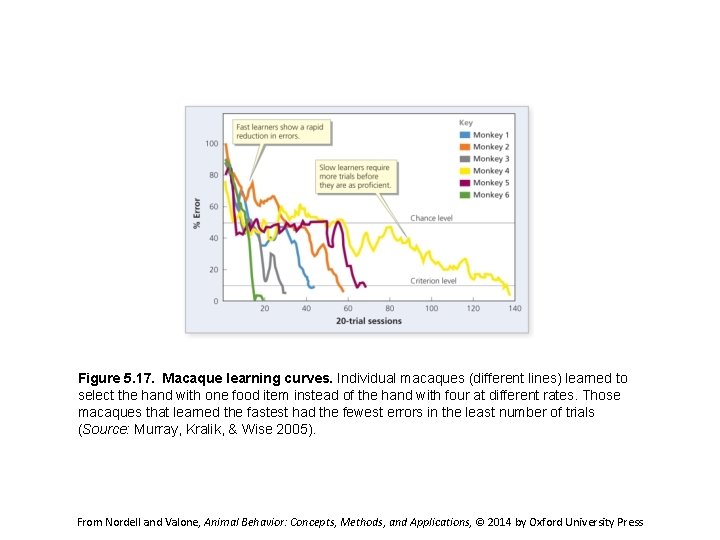
Figure 5. 17. Macaque learning curves. Individual macaques (different lines) learned to select the hand with one food item instead of the hand with four at different rates. Those macaques that learned the fastest had the fewest errors in the least number of trials (Source: Murray, Kralik, & Wise 2005). From Nordell and Valone, Animal Behavior: Concepts, Methods, and Applications, © 2014 by Oxford University Press
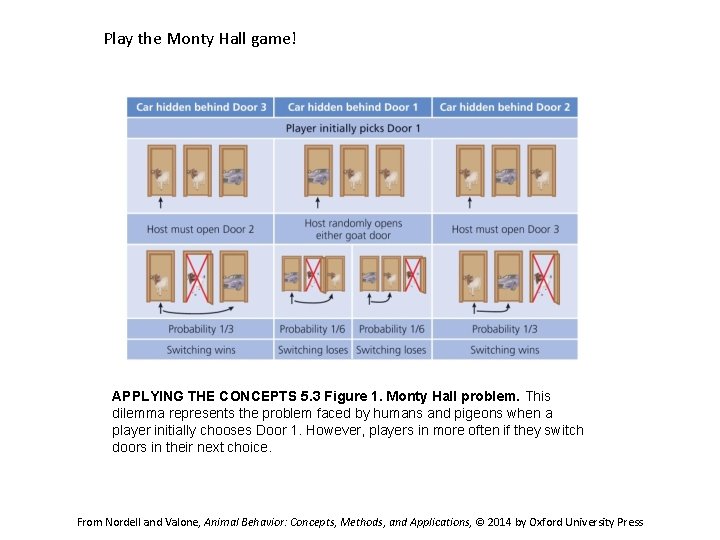
Play the Monty Hall game! APPLYING THE CONCEPTS 5. 3 Figure 1. Monty Hall problem. This dilemma represents the problem faced by humans and pigeons when a player initially chooses Door 1. However, players in more often if they switch doors in their next choice. From Nordell and Valone, Animal Behavior: Concepts, Methods, and Applications, © 2014 by Oxford University Press
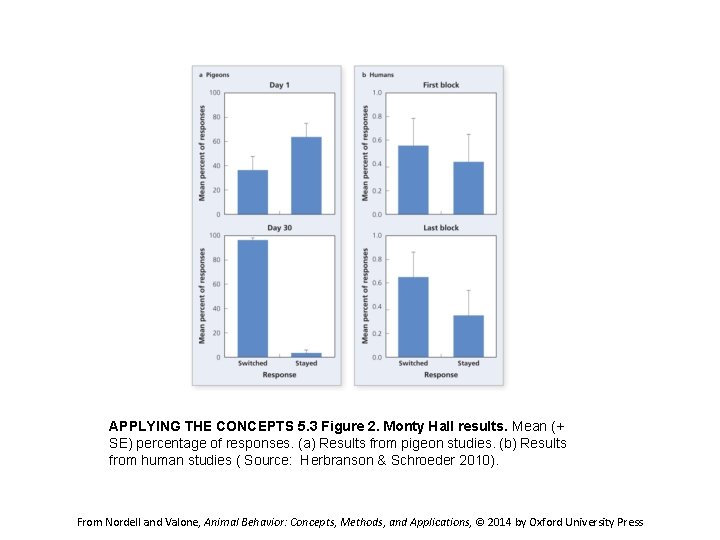
APPLYING THE CONCEPTS 5. 3 Figure 2. Monty Hall results. Mean (+ SE) percentage of responses. (a) Results from pigeon studies. (b) Results from human studies ( Source: Herbranson & Schroeder 2010). From Nordell and Valone, Animal Behavior: Concepts, Methods, and Applications, © 2014 by Oxford University Press
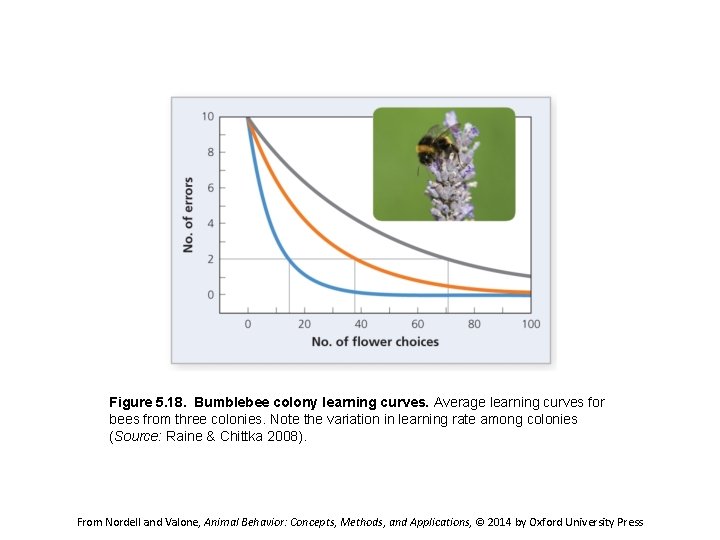
Figure 5. 18. Bumblebee colony learning curves. Average learning curves for bees from three colonies. Note the variation in learning rate among colonies (Source: Raine & Chittka 2008). From Nordell and Valone, Animal Behavior: Concepts, Methods, and Applications, © 2014 by Oxford University Press
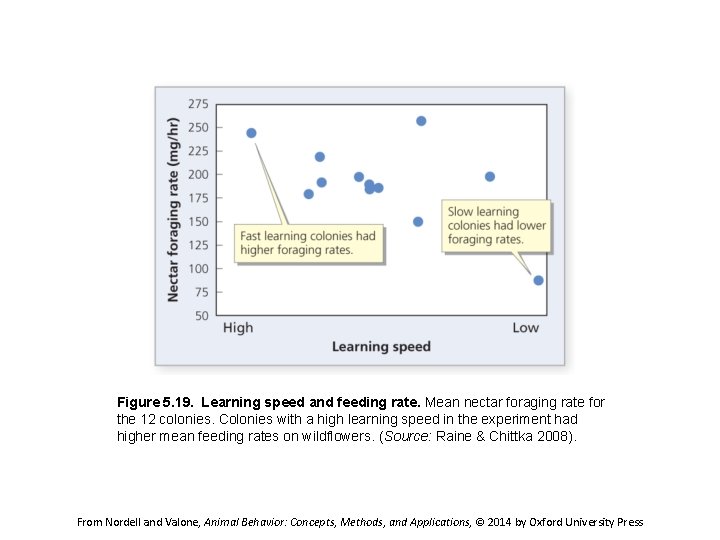
Figure 5. 19. Learning speed and feeding rate. Mean nectar foraging rate for the 12 colonies. Colonies with a high learning speed in the experiment had higher mean feeding rates on wildflowers. (Source: Raine & Chittka 2008). From Nordell and Valone, Animal Behavior: Concepts, Methods, and Applications, © 2014 by Oxford University Press
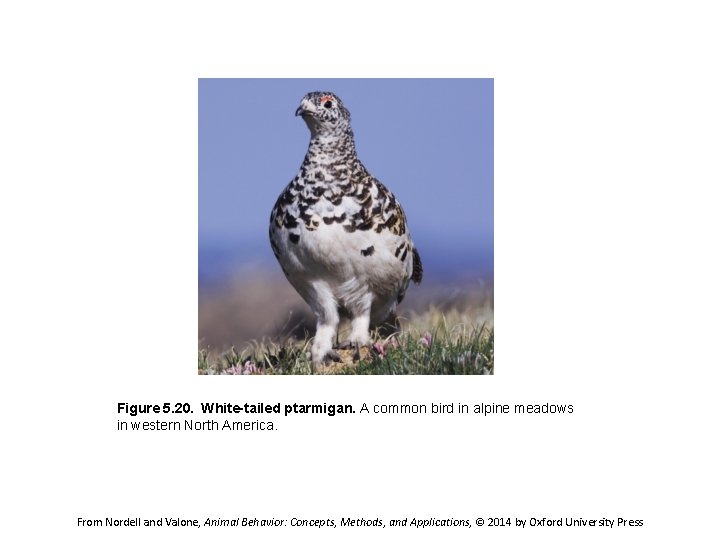
Figure 5. 20. White-tailed ptarmigan. A common bird in alpine meadows in western North America. From Nordell and Valone, Animal Behavior: Concepts, Methods, and Applications, © 2014 by Oxford University Press
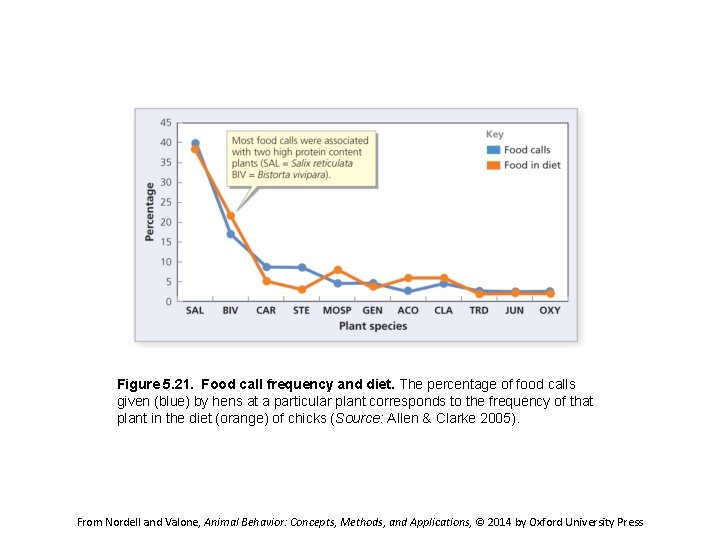
Figure 5. 21. Food call frequency and diet. The percentage of food calls given (blue) by hens at a particular plant corresponds to the frequency of that plant in the diet (orange) of chicks (Source: Allen & Clarke 2005). From Nordell and Valone, Animal Behavior: Concepts, Methods, and Applications, © 2014 by Oxford University Press
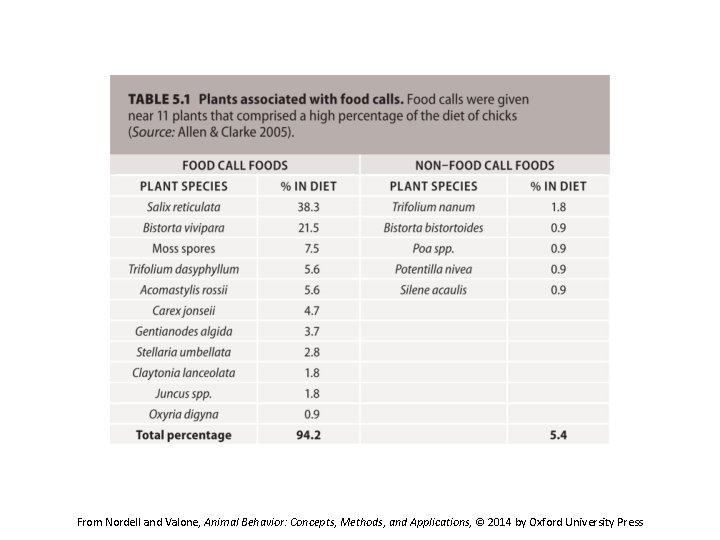
From Nordell and Valone, Animal Behavior: Concepts, Methods, and Applications, © 2014 by Oxford University Press
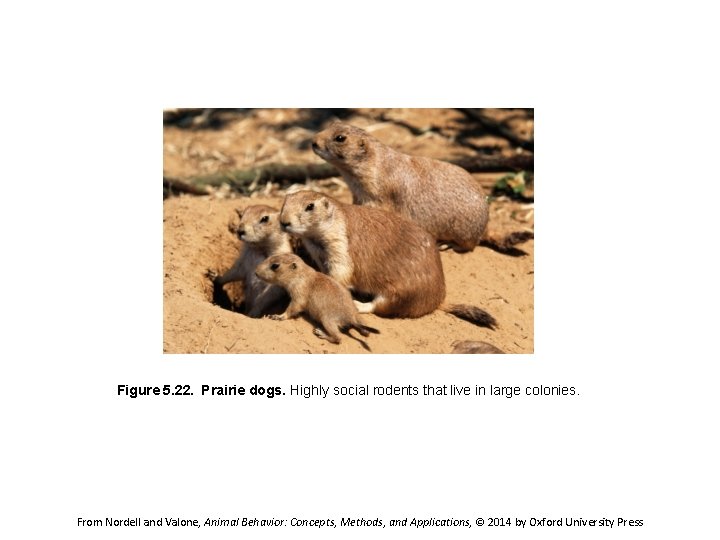
Figure 5. 22. Prairie dogs. Highly social rodents that live in large colonies. From Nordell and Valone, Animal Behavior: Concepts, Methods, and Applications, © 2014 by Oxford University Press
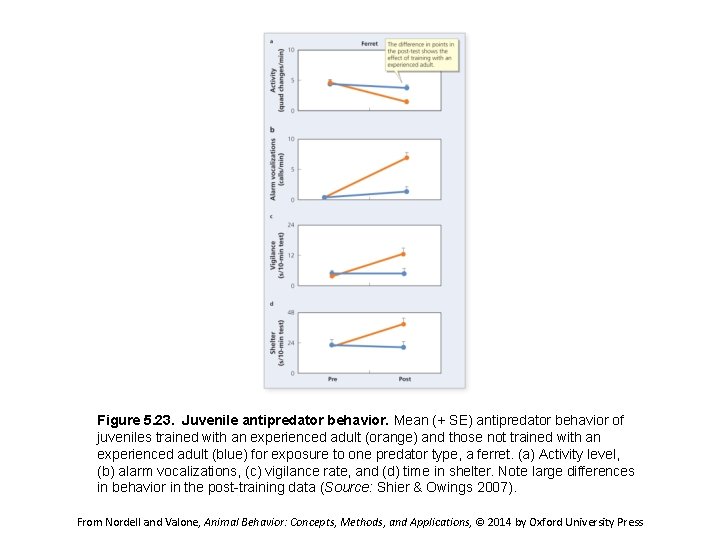
Figure 5. 23. Juvenile antipredator behavior. Mean (+ SE) antipredator behavior of juveniles trained with an experienced adult (orange) and those not trained with an experienced adult (blue) for exposure to one predator type, a ferret. (a) Activity level, (b) alarm vocalizations, (c) vigilance rate, and (d) time in shelter. Note large differences in behavior in the post training data (Source: Shier & Owings 2007). From Nordell and Valone, Animal Behavior: Concepts, Methods, and Applications, © 2014 by Oxford University Press
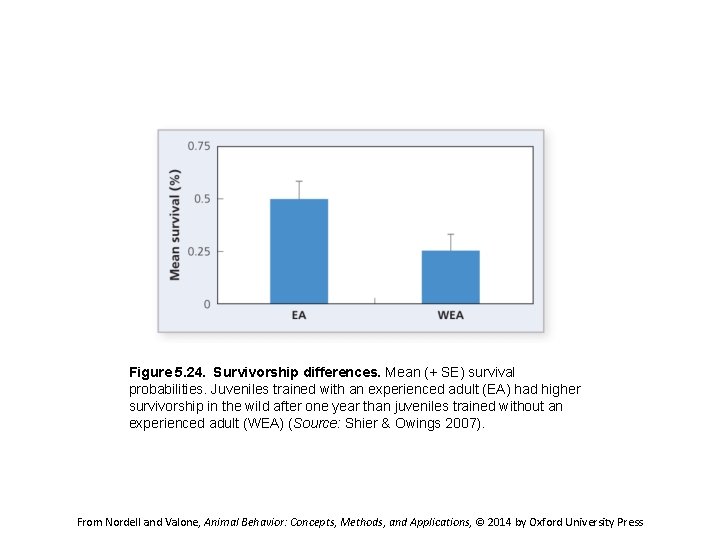
Figure 5. 24. Survivorship differences. Mean (+ SE) survival probabilities. Juveniles trained with an experienced adult (EA) had higher survivorship in the wild after one year than juveniles trained without an experienced adult (WEA) (Source: Shier & Owings 2007). From Nordell and Valone, Animal Behavior: Concepts, Methods, and Applications, © 2014 by Oxford University Press
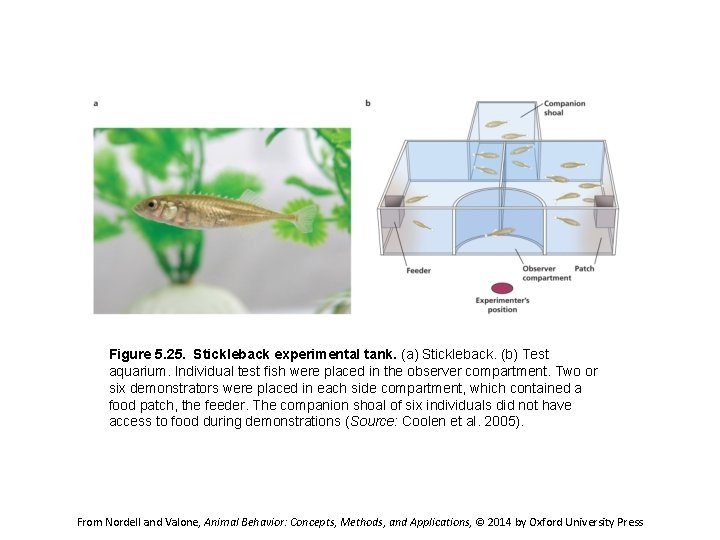
Figure 5. 25. Stickleback experimental tank. (a) Stickleback. (b) Test aquarium. Individual test fish were placed in the observer compartment. Two or six demonstrators were placed in each side compartment, which contained a food patch, the feeder. The companion shoal of six individuals did not have access to food during demonstrations (Source: Coolen et al. 2005). From Nordell and Valone, Animal Behavior: Concepts, Methods, and Applications, © 2014 by Oxford University Press
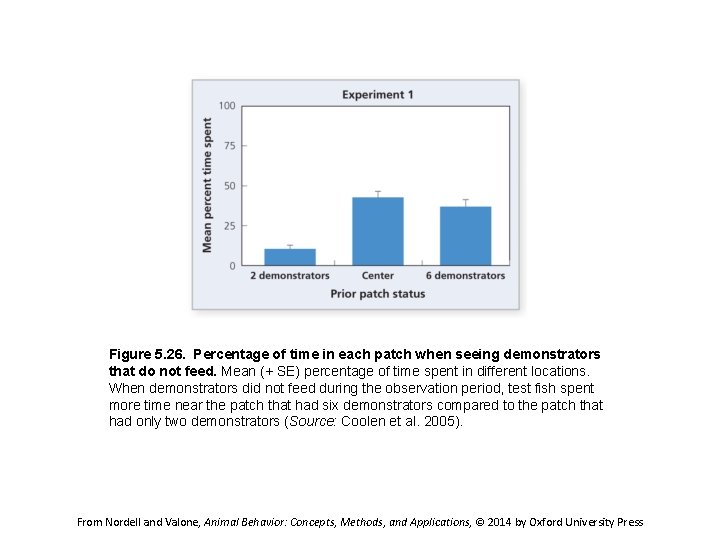
Figure 5. 26. Percentage of time in each patch when seeing demonstrators that do not feed. Mean (+ SE) percentage of time spent in different locations. When demonstrators did not feed during the observation period, test fish spent more time near the patch that had six demonstrators compared to the patch that had only two demonstrators (Source: Coolen et al. 2005). From Nordell and Valone, Animal Behavior: Concepts, Methods, and Applications, © 2014 by Oxford University Press
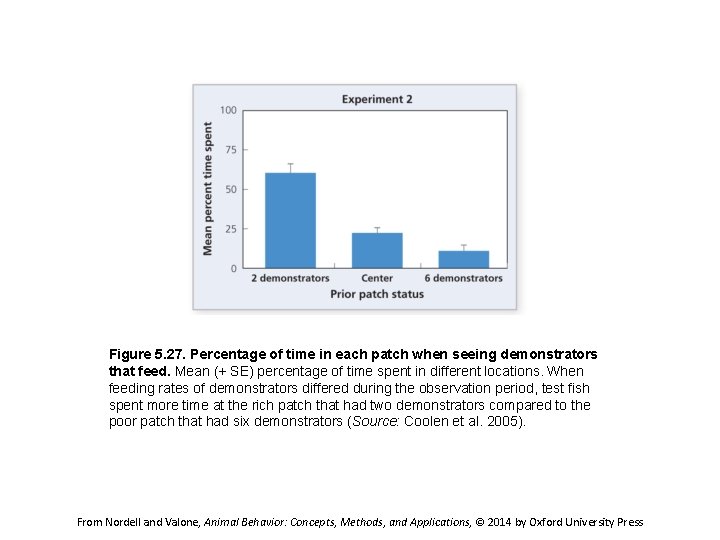
Figure 5. 27. Percentage of time in each patch when seeing demonstrators that feed. Mean (+ SE) percentage of time spent in different locations. When feeding rates of demonstrators differed during the observation period, test fish spent more time at the rich patch that had two demonstrators compared to the poor patch that had six demonstrators (Source: Coolen et al. 2005). From Nordell and Valone, Animal Behavior: Concepts, Methods, and Applications, © 2014 by Oxford University Press
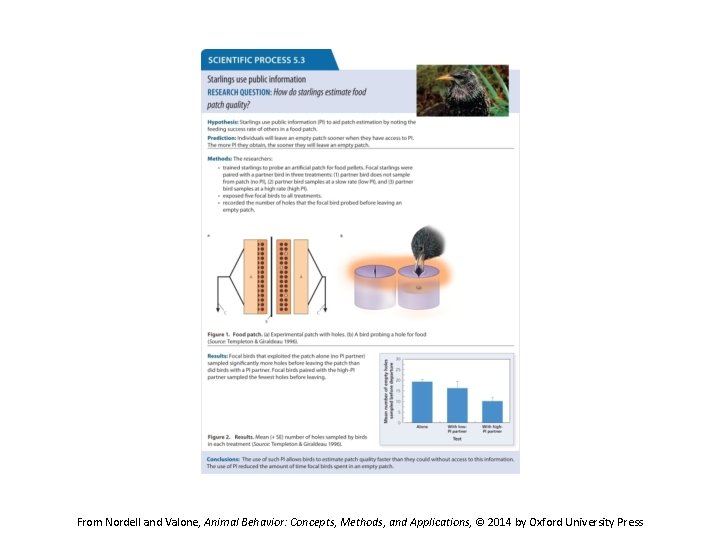
From Nordell and Valone, Animal Behavior: Concepts, Methods, and Applications, © 2014 by Oxford University Press
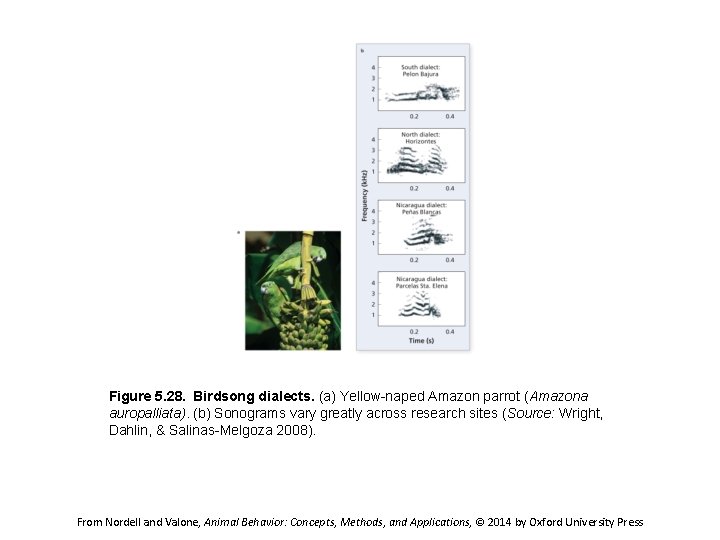
Figure 5. 28. Birdsong dialects. (a) Yellow naped Amazon parrot (Amazona auropalliata). (b) Sonograms vary greatly across research sites (Source: Wright, Dahlin, & Salinas Melgoza 2008). From Nordell and Valone, Animal Behavior: Concepts, Methods, and Applications, © 2014 by Oxford University Press
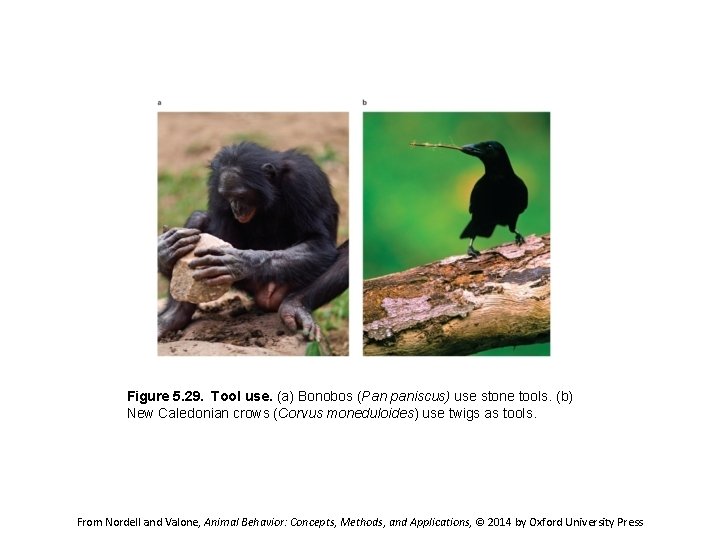
Figure 5. 29. Tool use. (a) Bonobos (Pan paniscus) use stone tools. (b) New Caledonian crows (Corvus moneduloides) use twigs as tools. From Nordell and Valone, Animal Behavior: Concepts, Methods, and Applications, © 2014 by Oxford University Press
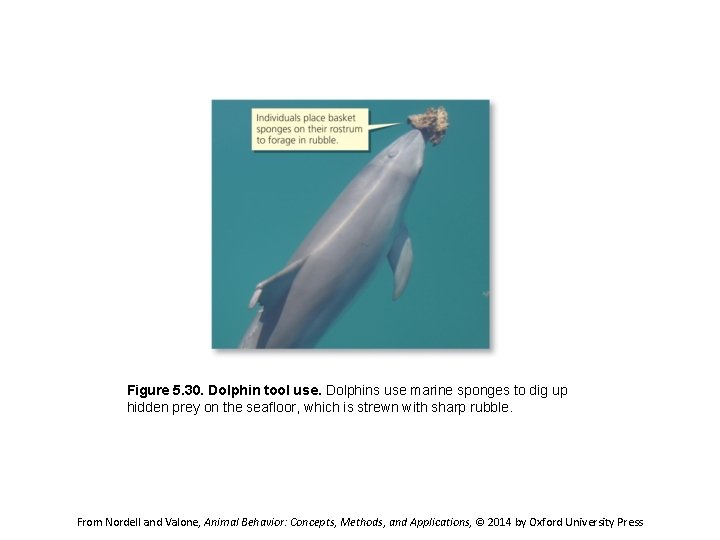
Figure 5. 30. Dolphin tool use. Dolphins use marine sponges to dig up hidden prey on the seafloor, which is strewn with sharp rubble. From Nordell and Valone, Animal Behavior: Concepts, Methods, and Applications, © 2014 by Oxford University Press
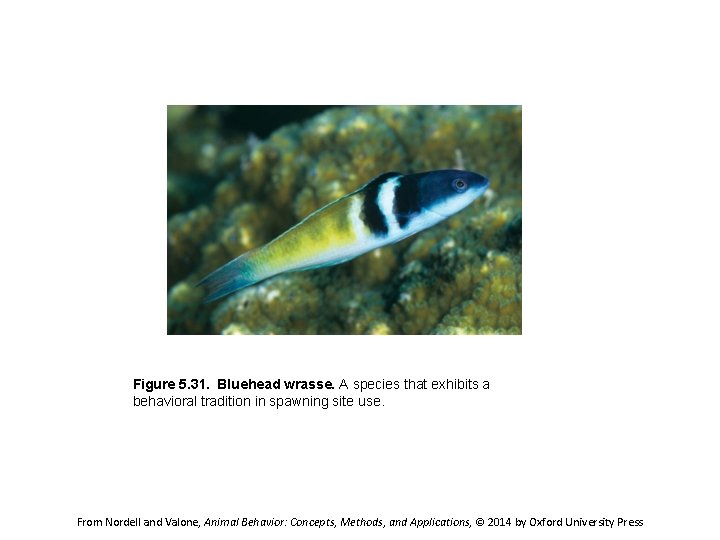
Figure 5. 31. Bluehead wrasse. A species that exhibits a behavioral tradition in spawning site use. From Nordell and Valone, Animal Behavior: Concepts, Methods, and Applications, © 2014 by Oxford University Press
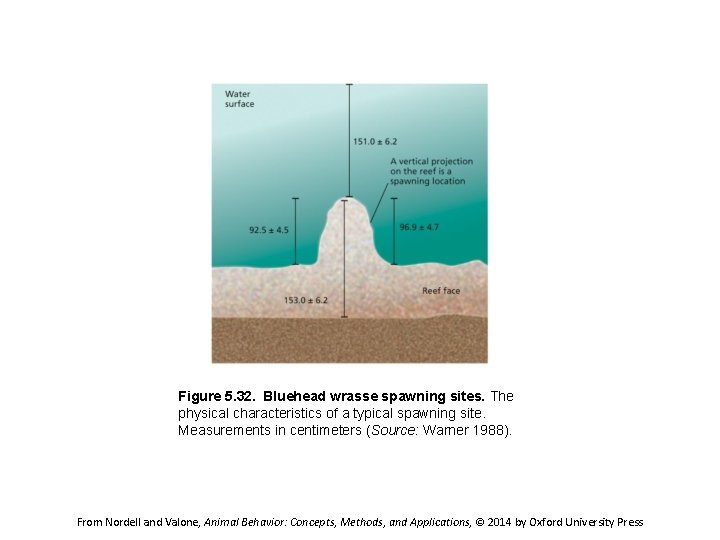
Figure 5. 32. Bluehead wrasse spawning sites. The physical characteristics of a typical spawning site. Measurements in centimeters (Source: Warner 1988). From Nordell and Valone, Animal Behavior: Concepts, Methods, and Applications, © 2014 by Oxford University Press
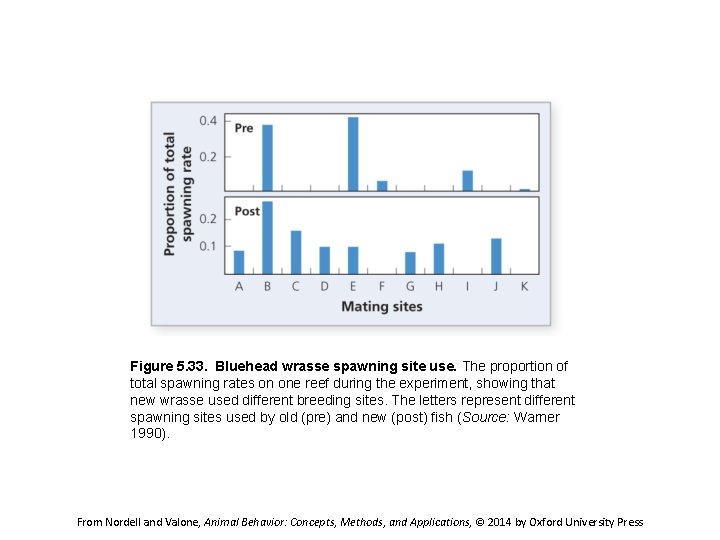
Figure 5. 33. Bluehead wrasse spawning site use. The proportion of total spawning rates on one reef during the experiment, showing that new wrasse used different breeding sites. The letters represent different spawning sites used by old (pre) and new (post) fish (Source: Warner 1990). From Nordell and Valone, Animal Behavior: Concepts, Methods, and Applications, © 2014 by Oxford University Press
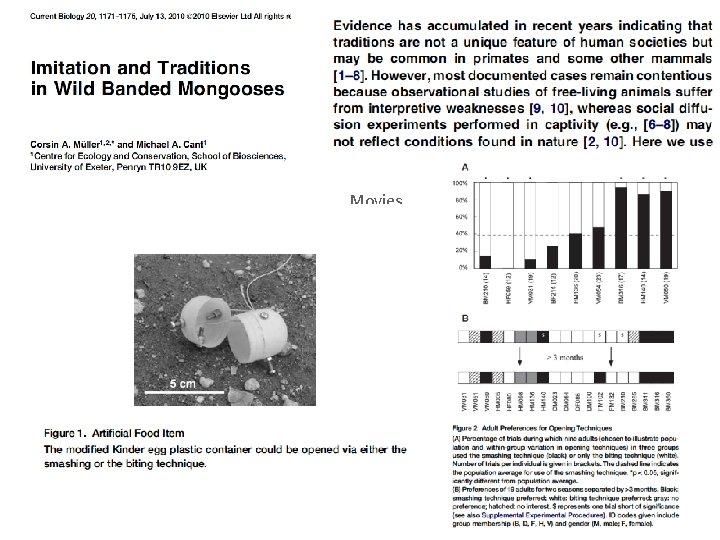
Movies
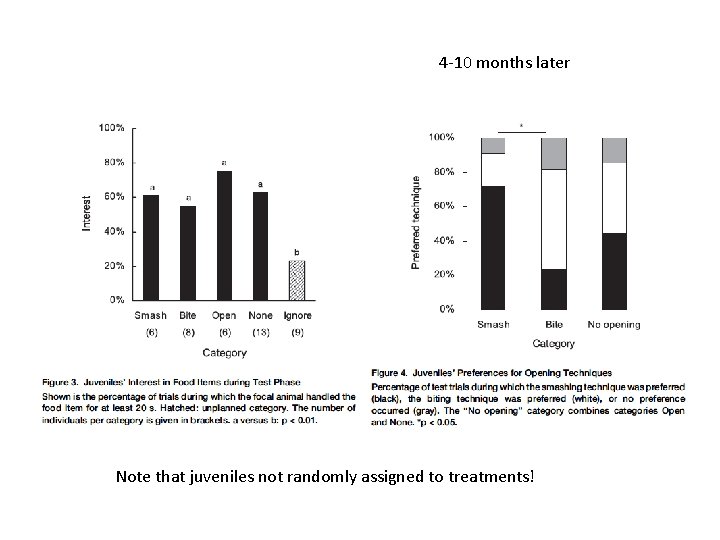
4 -10 months later Note that juveniles not randomly assigned to treatments!
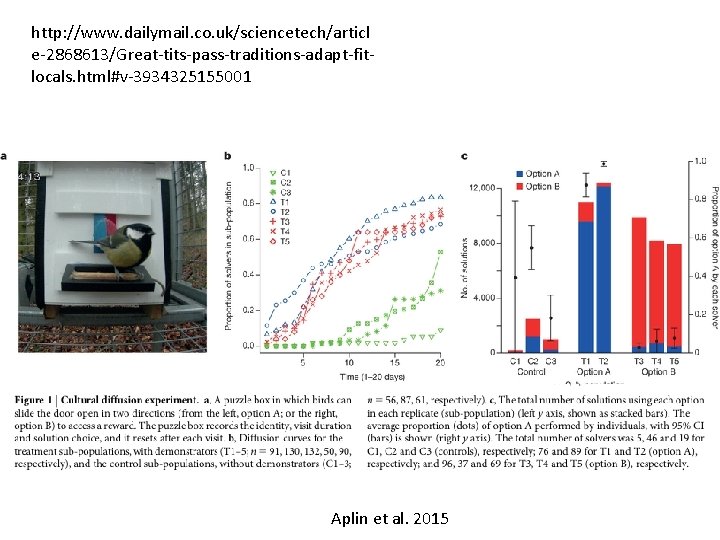
http: //www. dailymail. co. uk/sciencetech/articl e-2868613/Great-tits-pass-traditions-adapt-fitlocals. html#v-3934325155001 Aplin et al. 2015
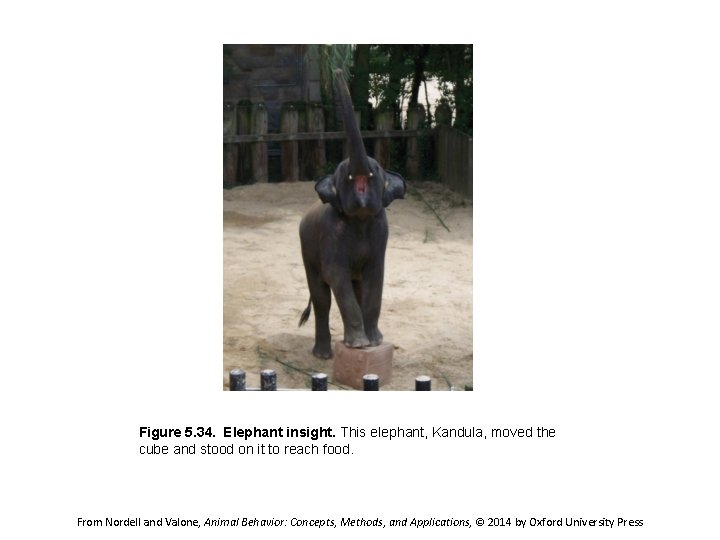
Figure 5. 34. Elephant insight. This elephant, Kandula, moved the cube and stood on it to reach food. From Nordell and Valone, Animal Behavior: Concepts, Methods, and Applications, © 2014 by Oxford University Press
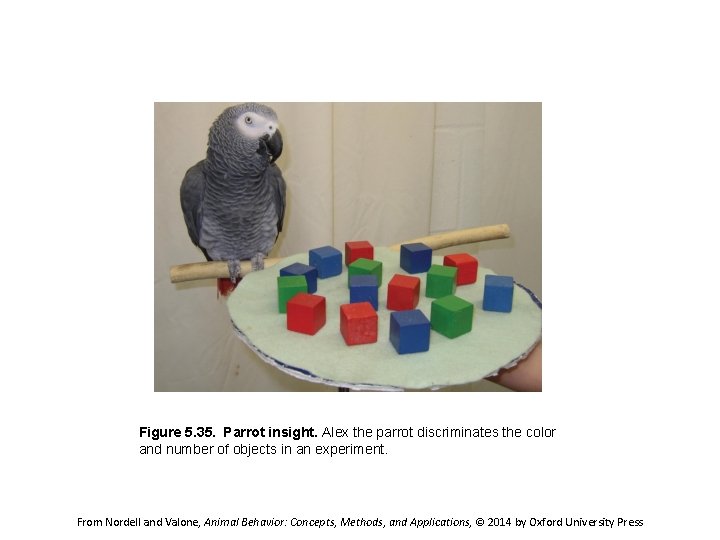
Figure 5. 35. Parrot insight. Alex the parrot discriminates the color and number of objects in an experiment. From Nordell and Valone, Animal Behavior: Concepts, Methods, and Applications, © 2014 by Oxford University Press
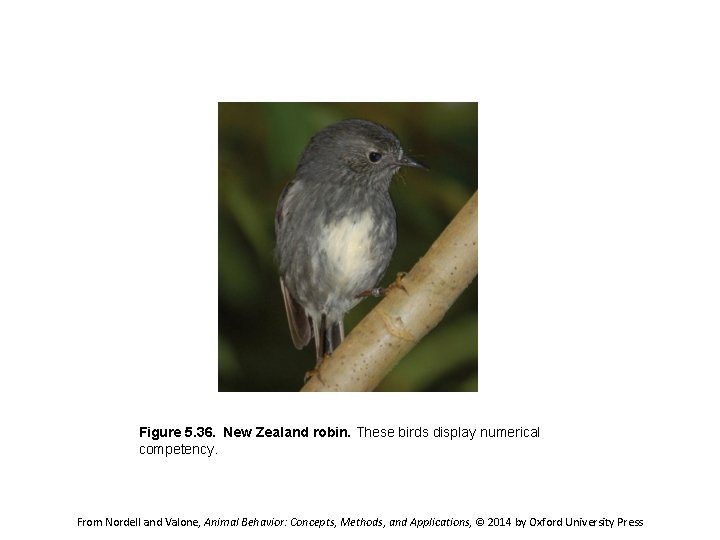
Figure 5. 36. New Zealand robin. These birds display numerical competency. From Nordell and Valone, Animal Behavior: Concepts, Methods, and Applications, © 2014 by Oxford University Press
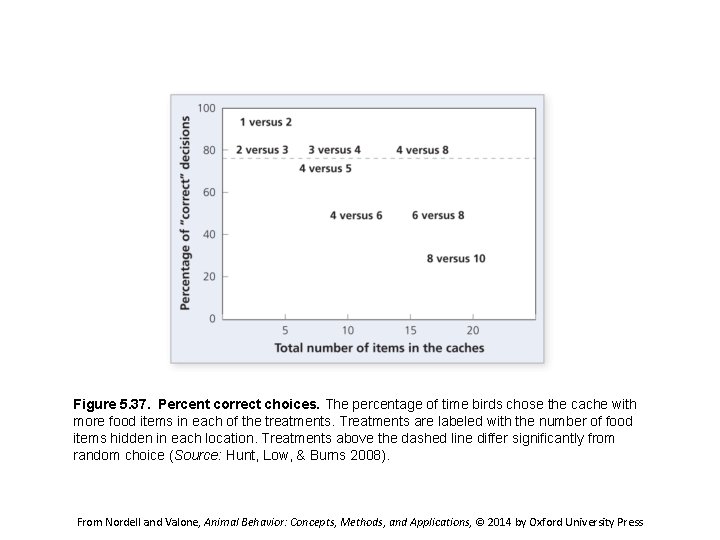
Figure 5. 37. Percent correct choices. The percentage of time birds chose the cache with more food items in each of the treatments. Treatments are labeled with the number of food items hidden in each location. Treatments above the dashed line differ significantly from random choice (Source: Hunt, Low, & Burns 2008). From Nordell and Valone, Animal Behavior: Concepts, Methods, and Applications, © 2014 by Oxford University Press
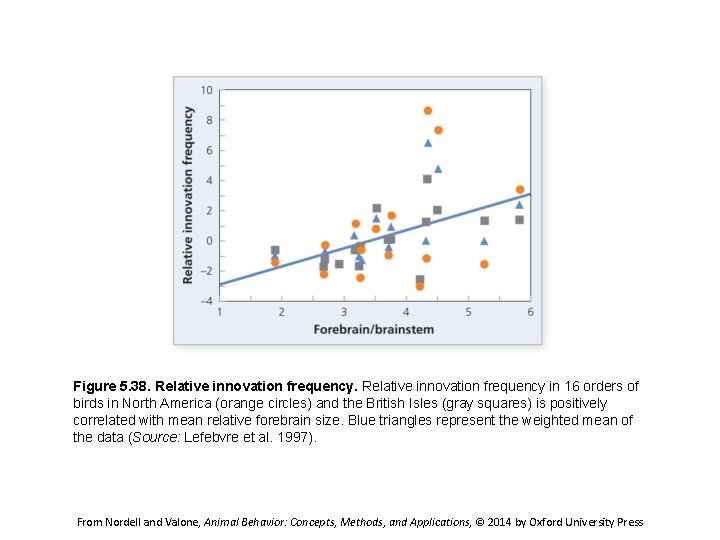
Figure 5. 38. Relative innovation frequency in 16 orders of birds in North America (orange circles) and the British Isles (gray squares) is positively correlated with mean relative forebrain size. Blue triangles represent the weighted mean of the data (Source: Lefebvre et al. 1997). From Nordell and Valone, Animal Behavior: Concepts, Methods, and Applications, © 2014 by Oxford University Press
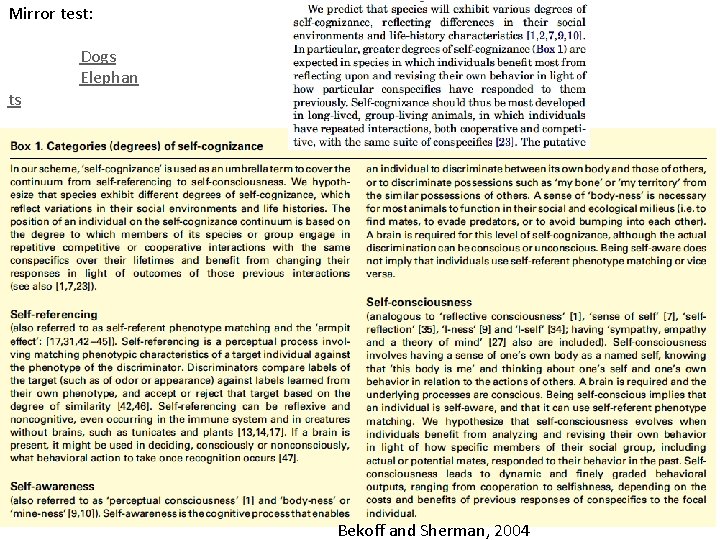
Mirror test: ts Dogs Elephan Chimps Bekoff and Sherman, 2004
- Slides: 56