Figure 14 0 Painting of Mendel Figure 14


")
")


 Drosophila testcross")


")
")
")

- Slides: 53
Figure 14. 0 Painting of Mendel
Figure 14. 0 x Mendel
Figure 14. 1 A genetic cross
Figure 14. 2 Mendel tracked heritable characters for three generations
Figure 14. x 1 Sweet pea flowers
Figure 14. 3 Alleles, alternative versions of a gene
Table 14. 1 The Results of Mendel’s F 1 Crosses for Seven Characters in Pea Plants
Figure 14. x 2 Round and wrinkled peas
Figure 14. 4 Mendel’s law of segregation (Layer 1)
Figure 14. 4 Mendel’s law of segregation (Layer 2)
Figure 14. 5 Genotype versus phenotype
Figure 14. 6 A testcross
Figure 14. 7 Testing two hypotheses for segregation in a dihybrid cross
Figure 14. 8 Segregation of alleles and fertilization as chance events
Figure 14. 9 x Incomplete dominance in carnations
Figure 14. 9 Incomplete dominance in snapdragon color
Figure 14. 10 Multiple alleles for the ABO blood groups
Figure 14. 10 x ABO blood types
Figure 14. 11 An example of epistasis
Figure 14. 12 A simplified model for polygenic inheritance of skin color
Figure 14. 13 The effect of environment of phenotype
Figure 14. 14 Pedigree analysis
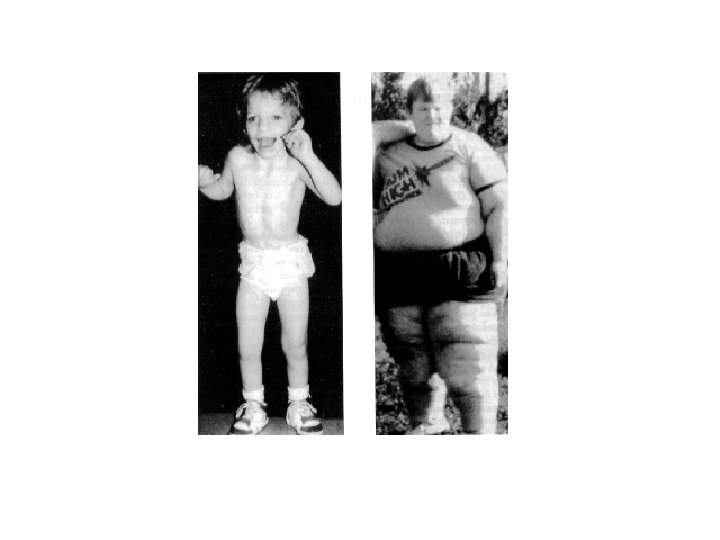
Figure 14. 15 Pleiotropic effects of the sickle-cell allele in a homozygote
Figure 14. 16 Large families provide excellent case studies of human genetics
Figure 14. 17 Testing a fetus for genetic disorders
Figure 15. 0 Chromosomes
Figure 15. 0 x Chromosomes
Figure 15. 1 The chomosomal basis of Mendel’s laws
Figure 15. 2 Morgan’s first mutant
Figure 15. 3 Sex-linked inheritance
Unnumbered Figure (page 272) Drosophila testcross
Figure 15. 4 Evidence for linked genes in Drosophila
Figure 15. 5 a Recombination due to crossing over
Figure 15. 5 b Recombination due to crossing over
Figure 15. 6 Using recombination frequencies to construct a genetic map
Figure 15. 7 A partial genetic map of a Drosophila chromosome
Figure 15. 8 Some chromosomal systems of sex determination
Figure 15. 9 The transmission of sex-linked recessive traits
Figure 15. 10 X inactivation and the tortoiseshell cat
Figure 15. 10 x Calico cat
Figure 15. 11 Meiotic nondisjunction
Figure 15. 12 A tetraploid mammal?
Figure 15. x 1 Translocation
Figure 15. 13 Alterations of chromosome structure
Figure 15. 14 Down syndrome
Figure 15. x 2 Klinefelter syndrome
Figure 15. x 3 XYY karyotype
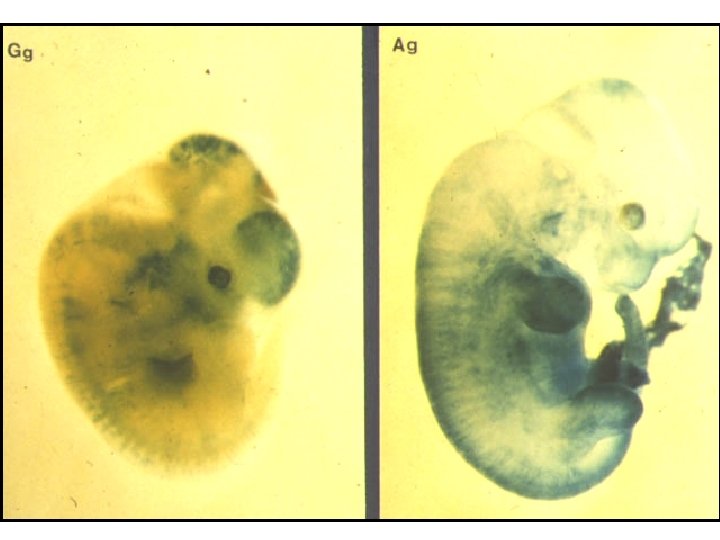
Figure 15. 15 Genomic imprinting (Layer 1)
Figure 15. 15 Genomic imprinting (Layer 2)
Figure 15. 15 Genomic imprinting (Layer 3)
Figure 15. 16 Cytoplasmic inheritance in tomato leaves