Figure 1 Schematic Representation of a Hole Figure


 20 10 0 Acoustic FEM -10 -20 -30 100")
 40 30 20 10 0 -10 r=5. 64 mm")
 30 20 10 0 Acoustic FEM (Converging) Transfer Matrix (Converging)")
 20 10 0 -10 -20 1 2 4 6")


 40 20 0 -20 1 2 4 6 -40 1000")


 30 20 10 0 -10 -20 Acoustic FEM Transfer")
 30 15 0 1 2 4 6 -15 -30")
 30 20 10 0 0. 2 -10 0. 4 0.")

 Acoustic FEM 60 40 Transfer Matrix Without Resonator 20")
 10 5 0 Acoustic FEM -5 Sgard et al. (2007)")
- Slides: 22
Figure 1 Schematic Representation of a Hole
Figure 1 Schematic Representation of a Hole
Figure 2 Schematic Conical Hole
Figure 2 Schematic Conical Hole
Radiation Impedance Diffuse Acoustic Field Figure 3 VA-One Model
Radiation Impedance Diffuse Acoustic Field Figure 3 VA-One Model
30 Transmission Loss (d. B) 20 10 0 Acoustic FEM -10 -20 -30 100 Transfer Matrix Sgard et al. (2007) 1000 Frequency (Hz)
50 Transmission Loss (d. B) 40 30 20 10 0 -10 r=5. 64 mm 10 mm × 10 mm 14. 14 mm × 7. 07 mm 20 mm × 5 mm -20 -30 1000 Frequency (Hz) Figure 5 Effect of Hole Shape
Transmission Loss (d. B) 30 20 10 0 Acoustic FEM (Converging) Transfer Matrix (Converging) -10 Acoustic FEM (Diverging Transfer Matrix (Diverging) -20 1000 Frequency (Hz) Figure 6 Results of Conical Hole
30 Transmission Loss (d. B) 20 10 0 -10 -20 1 2 4 6 -30 1000 Frequency (Hz) Figure 7 Effect of Radius Ratio of Conical Hole
Figure 8 Dimensions of Hole with Area Change
Transmission Loss (d. B) 40 20 0 -20 1 2 4 6 -40 1000 Frequency (Hz) Figure 9 Effect of Radius Change of Straight Hole
Figure 10 Dimensions of Hole with Expansion
40 Transmission Loss (d. B) 30 20 10 0 -10 -20 Acoustic FEM Transfer Matrix -30 -40 1000 Frequency (Hz) Figure 11 Results of Hole with Expansion Chamber
45 Transmission Loss (d. B) 30 15 0 1 2 4 6 -15 -30 -45 1000 Frequency (Hz) Figure 12 Comparison the Effect of Different Cross Area of Hole with Expansion Chamber
Transmission Loss (d. B) 30 20 10 0 0. 2 -10 0. 4 0. 6 -20 0. 8 -30 1000 Frequency (Hz) Figure 13 Comparison of Length Effect of Hole with Expansion Chamber
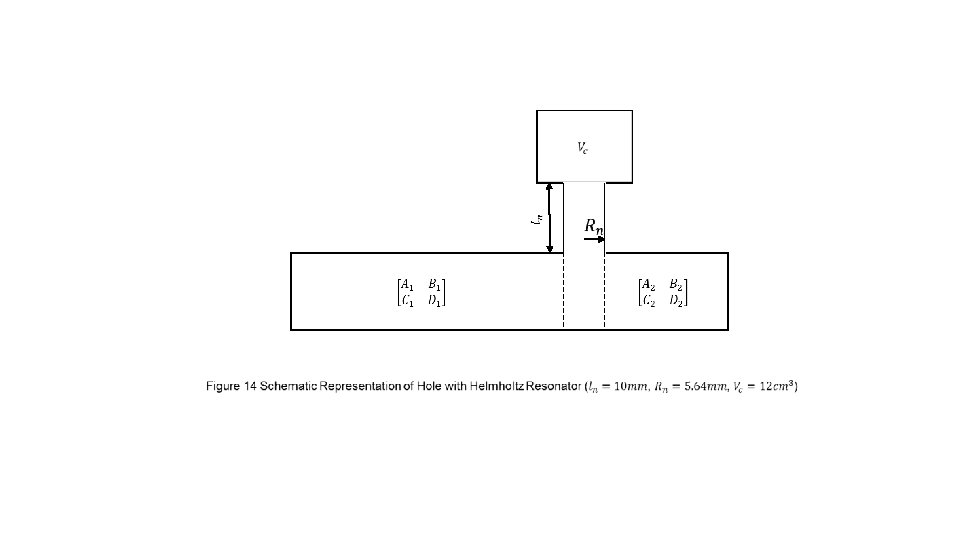
80 Transmission Loss (d. B) Acoustic FEM 60 40 Transfer Matrix Without Resonator 20 0 -20 -40 1000 Frequency (Hz) Figure 15 Comparison of Results of Hole with Helmholtz Resonator
Transmission Loss (d. B) 10 5 0 Acoustic FEM -5 Sgard et al. (2007) -10 10 100 Frequency (Hz) 1000 Figure 16 Comparison of Results of Large Opening