
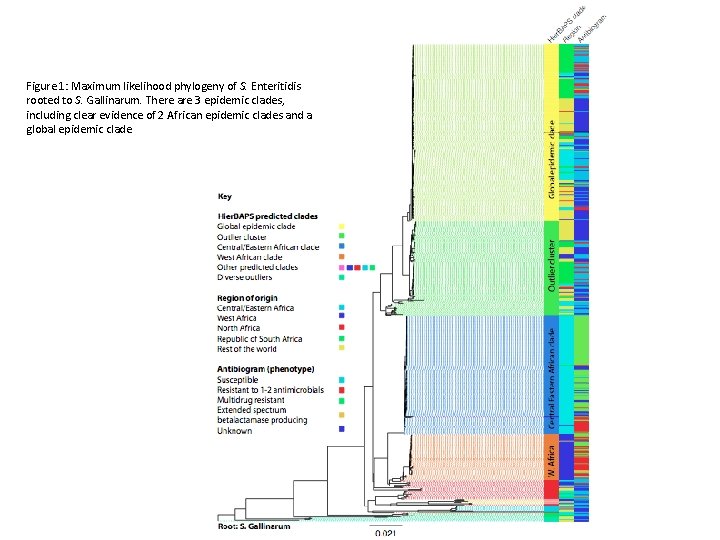
Figure 1 Maximum likelihood phylogeny of S Enteritidis
- Slides: 8
Figure 1: Maximum likelihood phylogeny of S. Enteritidis rooted to S. Gallinarum. There are 3 epidemic clades, including clear evidence of 2 African epidemic clades and a global epidemic clade
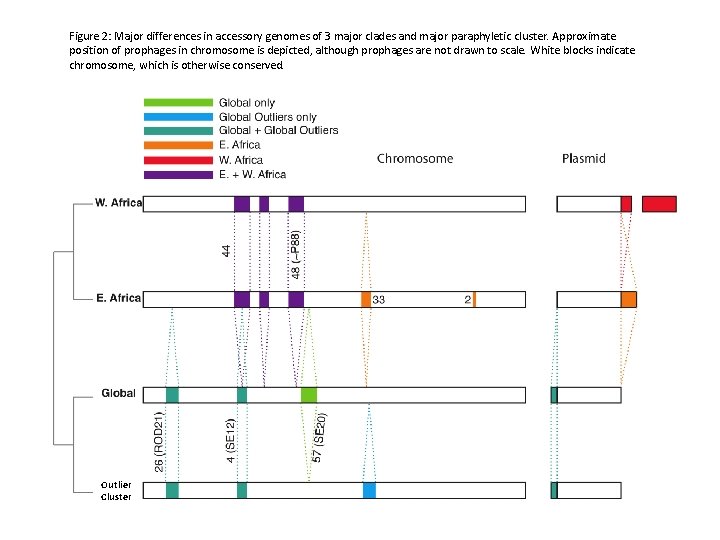
Figure 2: Major differences in accessory genomes of 3 major clades and major paraphyletic cluster. Approximate position of prophages in chromosome is depicted, although prophages are not drawn to scale. White blocks indicate chromosome, which is otherwise conserved. Outlier Cluster
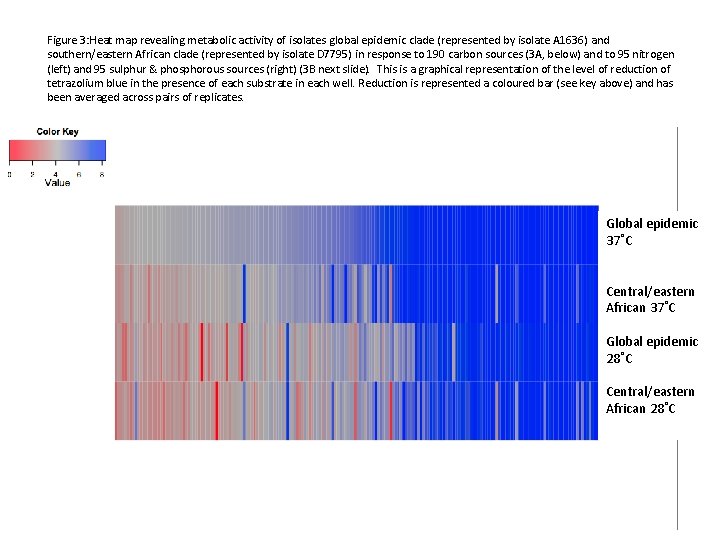
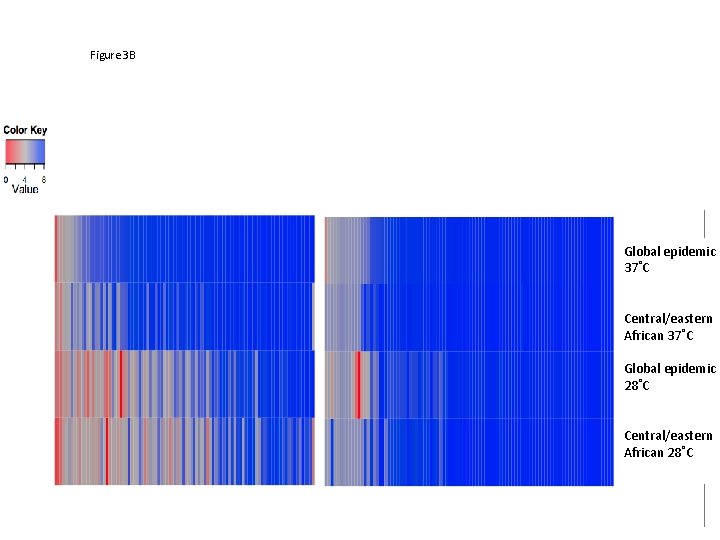
Figure 3: Heat map revealing metabolic activity of isolates global epidemic clade (represented by isolate A 1636) and southern/eastern African clade (represented by isolate D 7795) in response to 190 carbon sources (3 A, below) and to 95 nitrogen (left) and 95 sulphur & phosphorous sources (right) (3 B next slide). This is a graphical representation of the level of reduction of tetrazolium blue in the presence of each substrate in each well. Reduction is represented a coloured bar (see key above) and has been averaged across pairs of replicates. Global epidemic 37˚C Central/eastern African 37˚C Global epidemic 28˚C Central/eastern African 28˚C
Figure 3 B Global epidemic 37˚C Central/eastern African 37˚C Global epidemic 28˚C Central/eastern African 28˚C
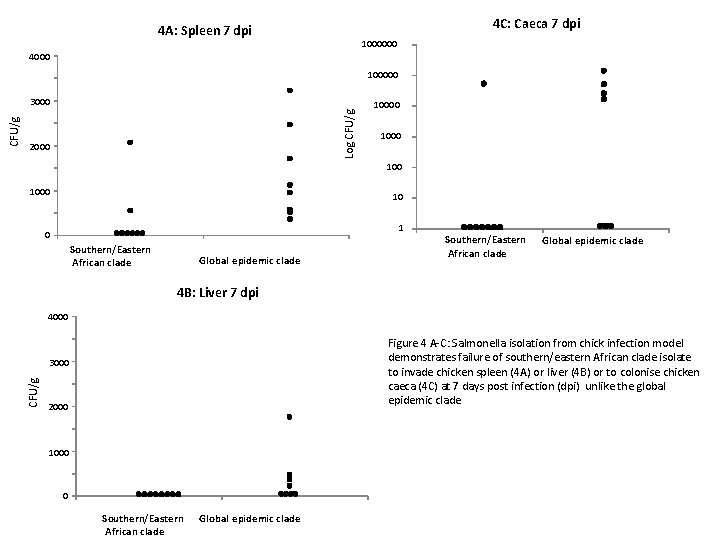
4 C: Caeca 7 dpi 4 A: Spleen 7 dpi 1000000 4000 100000 Log CFU/g 2000 1000 10 1 0 Southern/Eastern African clade Global epidemic clade 4 B: Liver 7 dpi 4000 Figure 4 A-C: Salmonella isolation from chick infection model demonstrates failure of southern/eastern African clade isolate to invade chicken spleen (4 A) or liver (4 B) or to colonise chicken caeca (4 C) at 7 days post infection (dpi) unlike the global epidemic clade 3000 CFU/g 3000 2000 1000 0 Southern/Eastern African clade Global epidemic clade
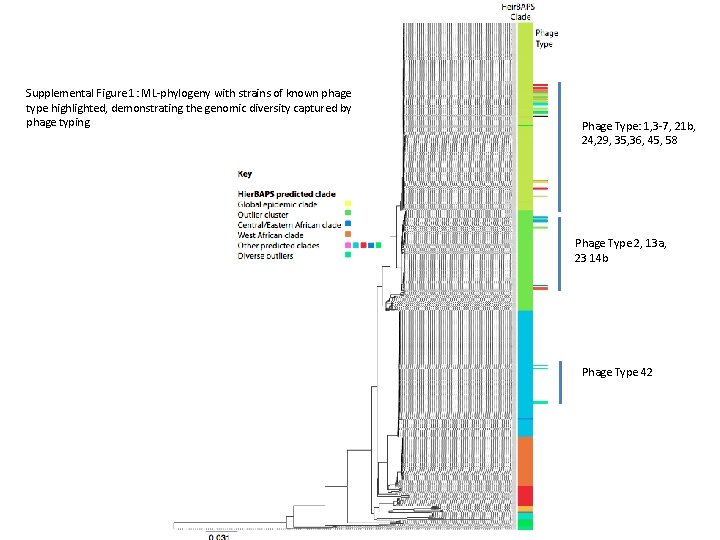
Supplemental Figure 1: ML-phylogeny with strains of known phage type highlighted, demonstrating the genomic diversity captured by phage typing Phage Type: 1, 3 -7, 21 b, 24, 29, 35, 36, 45, 58 Phage Type 2, 13 a, 23 14 b Phage Type 42
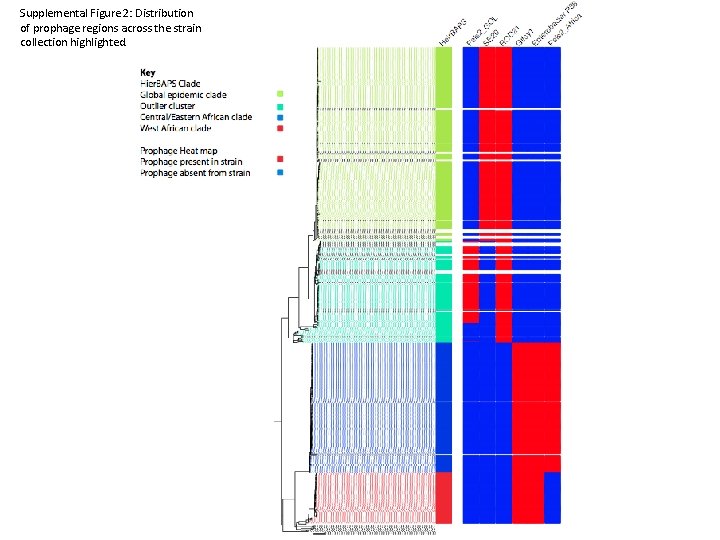
Supplemental Figure 2: Distribution of prophage regions across the strain collection highlighted.
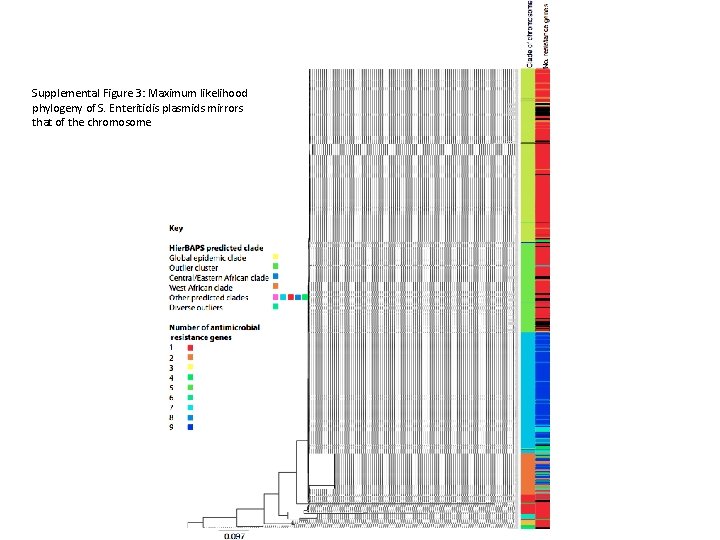
Supplemental Figure 3: Maximum likelihood phylogeny of S. Enteritidis plasmids mirrors that of the chromosome