Figure 1 Economist vs Accountants How an Economist
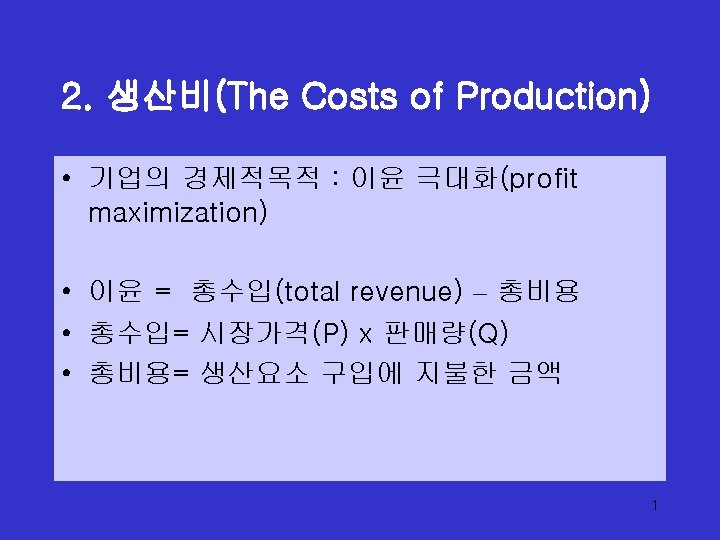


 Production function")


 • 한계비용 (MC): 산출량을 한 단위 증가시킬 때 총비용의 증가분. * How")


 Total-Cost Curve Total Cost TC $18. 00")
 Marginal- and Average-Cost Curves Costs $3. 00")

- Slides: 24
Figure 1 Economist vs. Accountants How an Economist Views a Firm How an Accountant Views a Firm Economic profit Accounting profit Revenue Implicit costs Explicit costs Revenue Total opportunity costs Explicit costs 4 Copyright © 2004 South-Western
Table 1 A Production Function and Total Cost: Cookie Factory 6 Copyright© 2004 South-Western
Figure 2 Cookie Factory’s Production Function Quantity of Output (cookies per hour) Production function 150 140 130 120 110 100 90 80 70 60 50 40 30 20 10 0 1 2 3 4 5 Number of Workers Hired 7 Copyright © 2004 South-Western
Figure 3 Cookie Factory’s Total-Cost Curve Total Cost Total-cost curve $80 70 60 50 40 30 20 10 20 30 40 50 60 70 Quantity of Output (cookies per hour) 80 90 100 110 120 130 140 150 8 Copyright © 2004 South-Western
Table 2 The Various Measures of Cost: Lemonade Shop 10 Copyright© 2004 South-Western
한계비용(marginal cost) • 한계비용 (MC): 산출량을 한 단위 증가시킬 때 총비용의 증가분. * How much does it cost to produce an additional unit of output? 12
Table 2 The Various Measures of Cost: Lemonade Shop 13 Copyright© 2004 South-Western
Lemonade Shop’s Marginal Cost 14
Figure 4 Lemonade Shop’s Total-Cost Curves Total Cost Total-cost curve $15. 00 14. 00 13. 00 12. 00 11. 00 10. 00 9. 00 8. 00 7. 00 6. 00 5. 00 4. 00 3. 00 2. 00 1. 00 0 1 2 3 4 5 6 7 Quantity of Output (glasses of lemonade per hour) 8 9 10 15 Copyright © 2004 South-Western
Figure 5 Lemonade Shop’s Average-Cost and Marginal-Cost Curves Costs $3. 50 3. 25 3. 00 2. 75 2. 50 2. 25 MC 2. 00 1. 75 1. 50 ATC 1. 25 AVC 1. 00 0. 75 0. 50 AFC 0. 25 0 1 2 3 4 5 6 7 8 Quantity of Output (glasses of lemonade per hour) 9 10 16 Copyright © 2004 South-Western
Big Bagel’s Cost Curves 17
Figure 6 Big Bagel’s Cost Curves (a) Total-Cost Curve Total Cost TC $18. 00 16. 00 14. 00 12. 00 10. 00 8. 00 6. 00 4. 00 2. 00 0 2 4 6 8 10 12 14 Quantity of Output (bagels per hour) 18 Copyright © 2004 South-Western
Figure 6 Big Bagel’s Cost Curves (b) Marginal- and Average-Cost Curves Costs $3. 00 2. 50 MC 2. 00 1. 50 ATC AVC 1. 00 0. 50 AFC 0 2 4 6 8 10 12 14 Quantity of Output (bagels per hour) 19 Copyright © 2004 South-Western
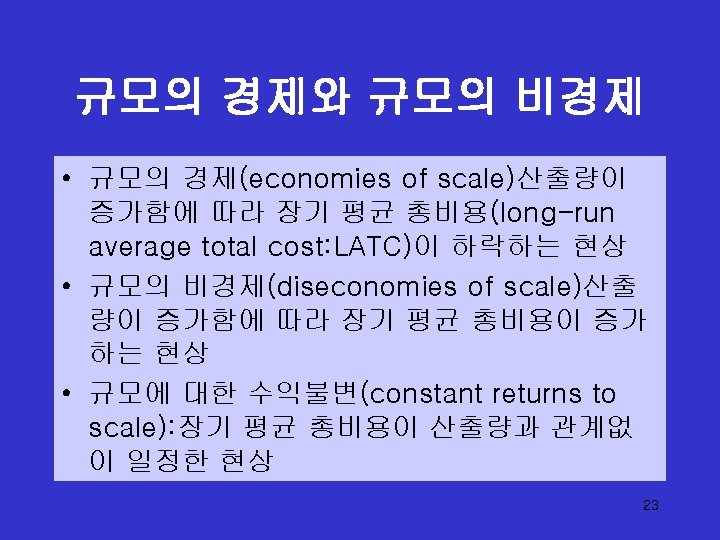
Figure 7 Average Total Cost in the Short and Long Run Average Total Cost ATC in short run with small factory ATC in short run with medium factory large factory ATC in long run $12, 000 10, 000 Economies of scale 0 Constant returns to scale 1, 000 1, 200 Diseconomies of scale Quantity of 22 Cars per Day Copyright © 2004 South-Western