Fig 1 a AllIndia Summer JJAS Monsoon rainfall
 All-India Summer (JJAS) Monsoon rainfall anomalies (% of 1961 -90 mean)")
 Monsoon Rainfall (JJAS) difference between the future (2070 -98) and present")
 temperatures and some aspects of daily")
- Slides: 7
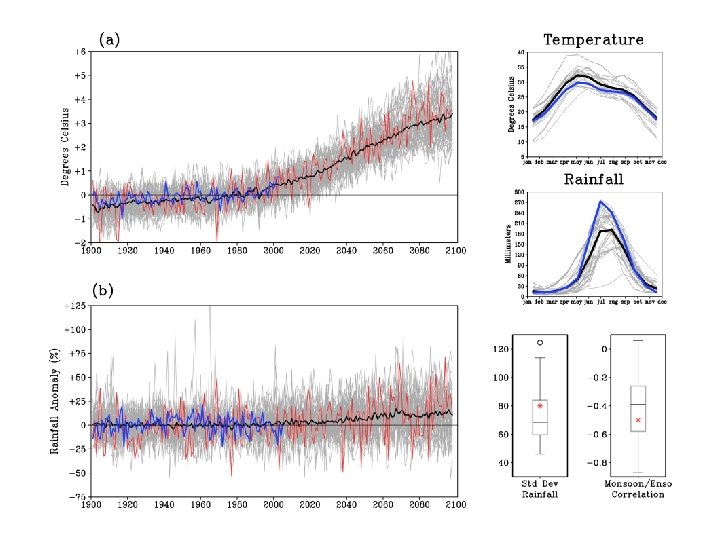
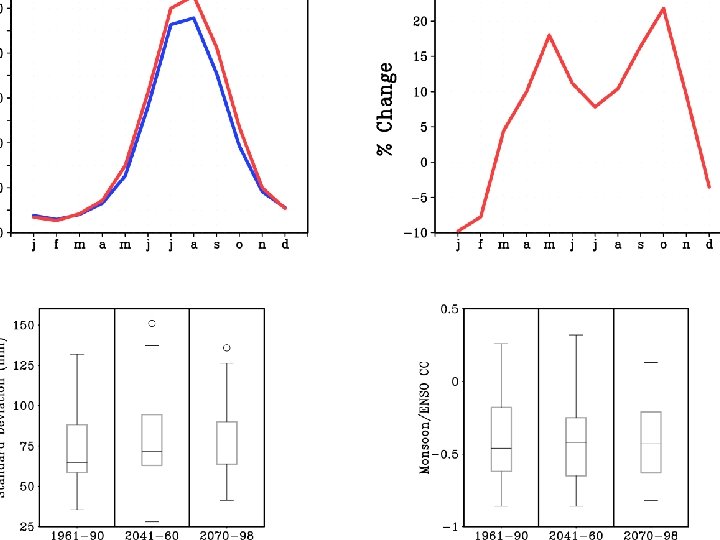
Fig. 1 a) All-India Summer (JJAS) Monsoon rainfall anomalies (% of 1961 -90 mean) during 1871 -2005. The 31 -yr sliding mean of the anomalies is shown in green shaded curve. The red/blue bars indicate years of El Nino/La Nina. b) All India annual surface temperature anomalies (respect to 1961 -90 mean) during 1875 -2005. 31 -year sliding mean is shown as thick black line.
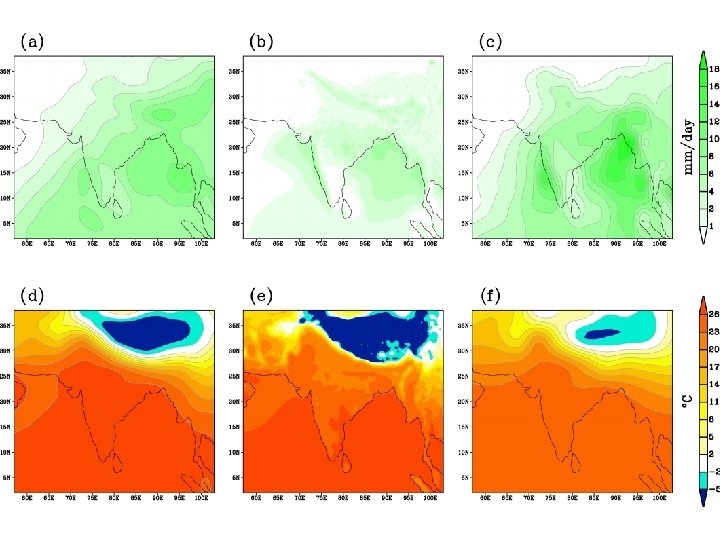
Fig. 4 a) Monsoon Rainfall (JJAS) difference between the future (2070 -98) and present (1961 -90). The values shown are % change of future with respect to the present. b) Annual temperature change in the future. c) Standardized anomalies of total column precipitable water averaged over the domain shown in a) as simulated in IPCC-AR 4 19 models (only 1 run per model) during 2001 -2098. d) Standardized anomaly of meridional wind index (v-wind difference between 850 h. Pa and 200 h. Pa averaged over the domain shown in b)) simulated in 21 models during 2001 -2098. Standardization is done based on the mean and standard diviations of each model during the period 2001 -2020.
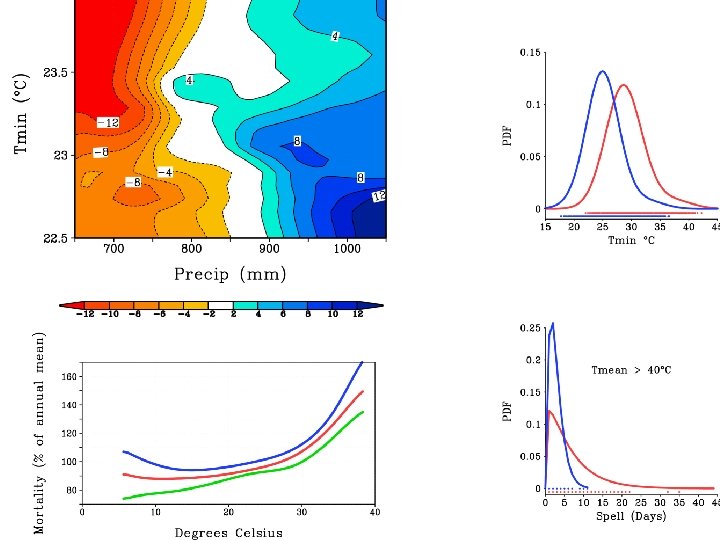
Fig. 5 Projected changes in daily maximum (Tmax) temperatures and some aspects of daily rainfall over India based on high resolution (50 km) regional climate model (PRECIS). a) Highest pre-monsoon (March-June) daily temperature maximum during the baseline period (1961 -90). b) Projected future (2071 -2100) change in Tmax in the SRES-A 2 GHG scenario simulations. The PDFs in the inset of this figure show the probabilities of daily Tmax spells (in days) exceeding the 90 th percentile (46. 3 Deg C) value at New Delhi. The location of New Delhi is marked with a black dot in b). Panel c) shows the projected future number of rainy days (>2. 5 mm of rainfall) during monsoon season and d) the projected change in the intensity (mm/day) of rainfall on a rainy day.