Fields A field is a region of space


")


 gradient changes quickly and the isolines are close together. A gentle")


 maps show changes in elevation in an area. Contour lines")


- Slides: 35
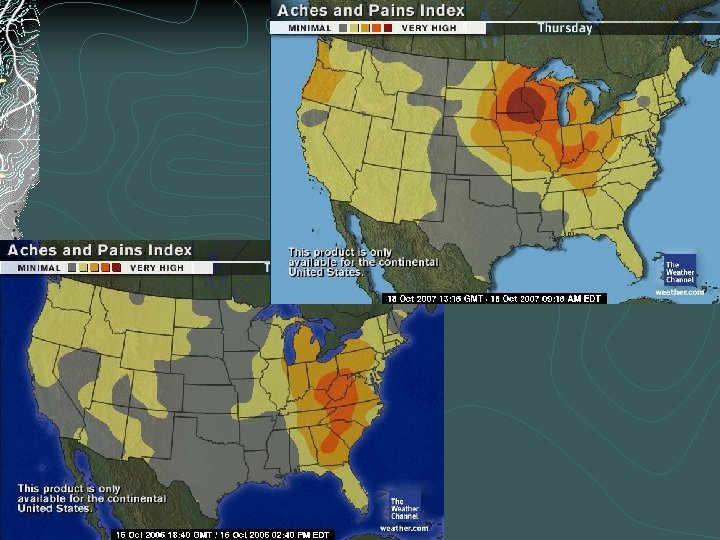
Fields A field is a region of space that has a measurable quantity at every point, such as temperature, pressure or elevation
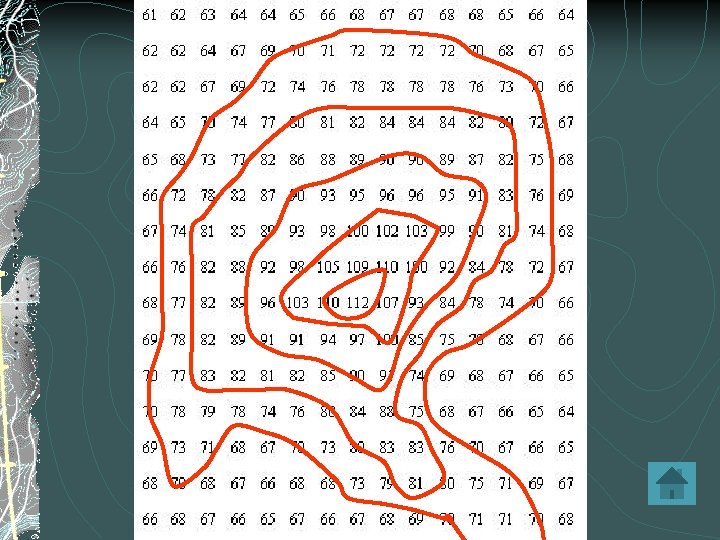
Isolines An isoline is a line connecting points of equal value.
Examples of isolines: Isotherms: points of equal temperature Isobars: points of equal barometric (air) pressure Contour Lines: points of equal elevation
gasoline in the soil around a leaking service station
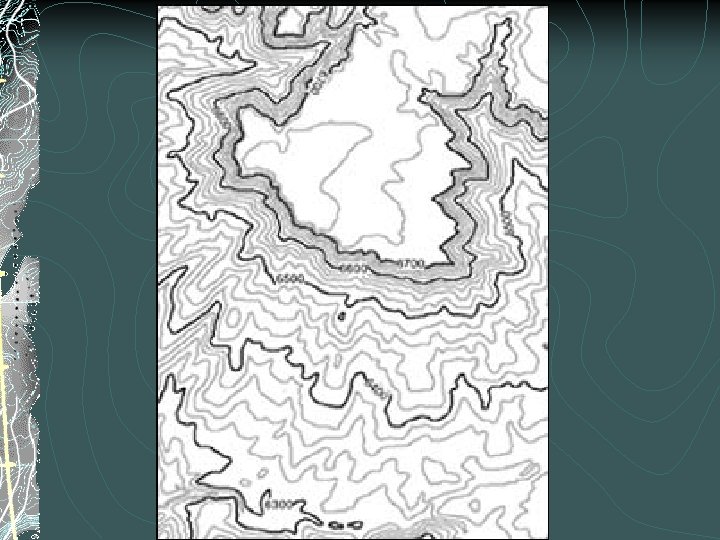
A contour map of a simple hill
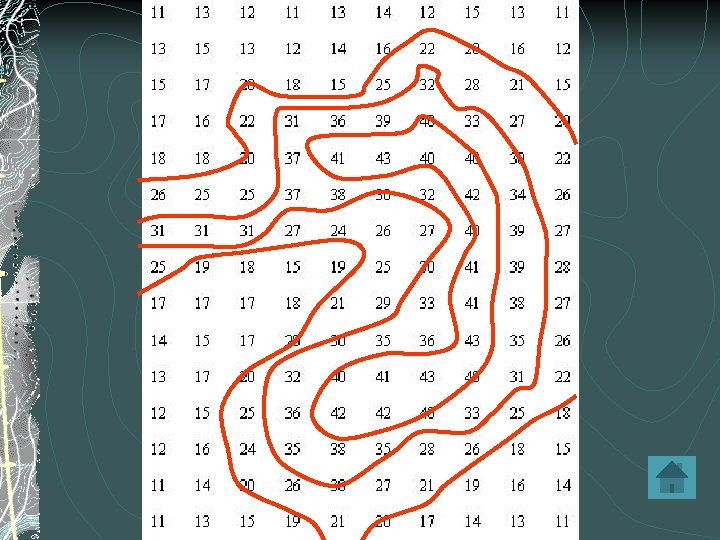
Rules for Drawing Isolines: 1. Isolines connect points of equal value. 5 5 10 10 10 15 15
2. Isolines are gentle, curving lines- no sharp corners. 5 5 10 10 10 15 15
3. Isolines are always closed curves even though the map might only show part of it.
4. Isolines NEVER cross- this would mean that one point has two different values. 40 ° 50 ° 30 ° 60 ° X 20° Y Z
5. Isolines usually are “parallel. ”
6. The interval from one isoline to the next must be constant. Interval = 10º 40 ° 50 ° 30 ° 60 ° X 20° Y Z
Gradient shows how quickly the value changes from one point to another.
A steep (high) gradient changes quickly and the isolines are close together. A gentle (low) gradient changes slowly and the lines are far apart. Steep area Gentle area
Isosurfaces are three-dimensional isolines
Highlight data points.
Fill in gaps in data.
Connect the dots.
Go on to the next value.
Making a Contour Map II
Drawing Contour Maps III
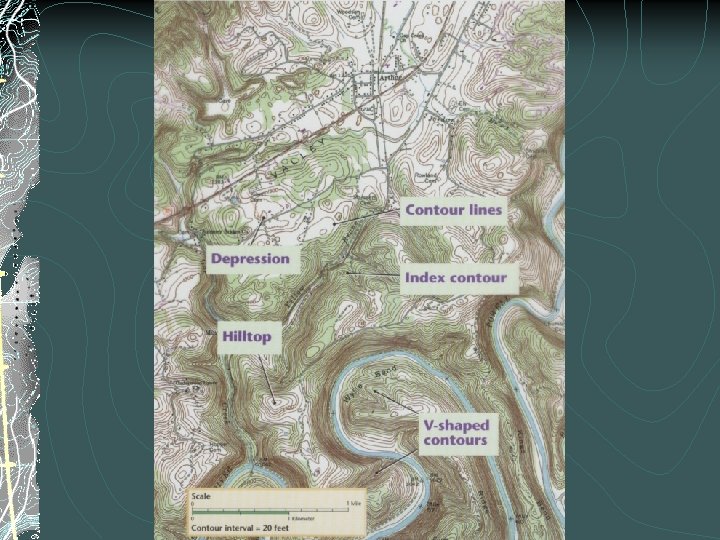
Topographic maps Topographic (Topo) maps show changes in elevation in an area. Contour lines are lines that connect points of equal elevation. Contour Interval tells you the difference in value between adjacent contour lines
Hachured contour lines show an enclosed depression. The first hachured line has the same elevation as the last contour line.
Map scale is the ratio between the distances shown on the map and the actual distances on the ground verbal scale – 1 inch = ½ mile An inch on the map is a half a mile in real life ratio scale - 1: 125, 000 (no units) An inch on the map is 125, 000 inches in real life 0 ½ 1 graphic scale – 2
Profiles – a side view that is constructed to help show the topography of an area Slope – the relative gradient can be seen by comparing how close the contour lines are. Close contours indicate a steep slope
Stream direction Streams always flow to lower elevation If a stream meets an ocean, the stream flows toward the ocean Contour lines bend upstream when they cross a stream