Field Spectroscopy Hyperspectral Imaging Applications in Vegetation and


 • In practice, the spectrometer is used to measure a white standard")


 • Absorption features are square root 2 (0. 707) narrower width")


 Spectral Library Contact: Dr. Roger Clark")
- Slides: 55
Field Spectroscopy, Hyperspectral Imaging, Applications in Vegetation and Soils Analysis Alexander F. H. Goetz University of Colorado and Analytical Spectral Devices Inc. goetz@cses. colorado. edu Beijing and Nan. Jing, China June 28 -29 and July 1 -2, 2004 Lecture 1
Spectroscopy, Hyperspectral and Applications • Day 1 • Spectroscopy fundamentals • Spectral Imaging • Hyperspectral Data Analysis • Day 2 • Hyperspectral Data Analysis cont. • Tradeoffs: Spatial, Spectral Resolution, SNR • Applications
Acknowledgements • Dr. Roger Clark, US Geological Survey http: //speclab. cr. usgs. gov • Dr. Greg Swayze, USGS gswayze@usgs. gov • Dr. Joe Boardman, AIG LLC www. aigllc. com • Dr. Fred Kruse, Horizon Geo. Imaging LLC www. hgimaging. com • Dr. Brian Curtiss, Analytical Spectral Devices Inc. www. asdi. com • Ms. Phoebe Hauff, Spectral International Inc, www. specmin. com
Spectroscopy Fundamentals
Reflectance • Instruments measure radiance L
Reflectance (2) • In practice, the spectrometer is used to measure a white standard such as Spectralon®, which is sintered PFTE (polytetrafluoroethene)(Teflon®) • It has a reflectance close to 100% over the 400 -2500 nm region • In the instrument, the radiance measured from the sample is ratioed with the Spectralon radiance to produce reflectance as a function of wavelength
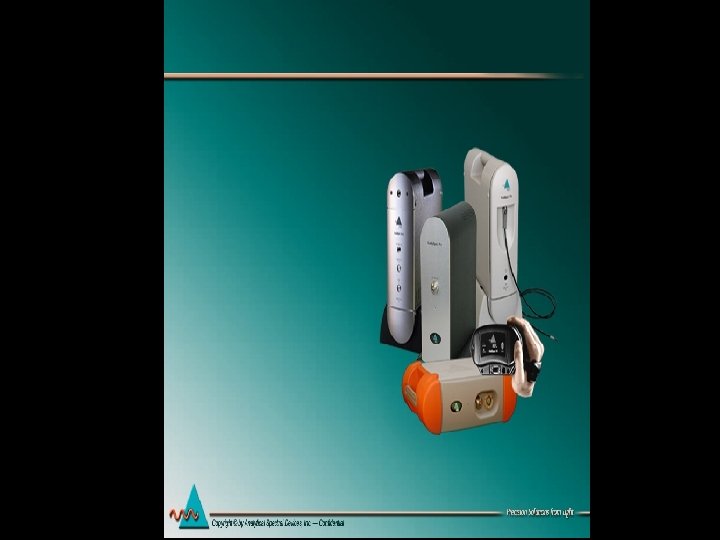
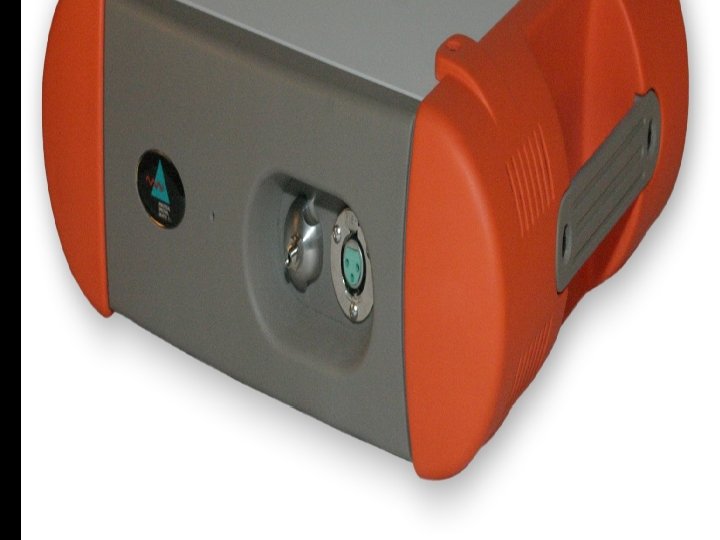
ASD Spectrometers and Spectroradiometers
Terra. Spec Field. Spec Pro
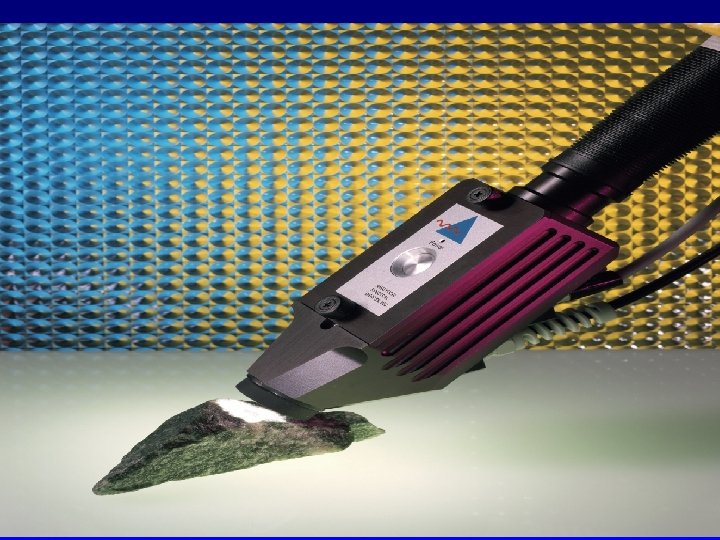
High Intensity Probe Attaches to Field. Spec or Terra. Spec
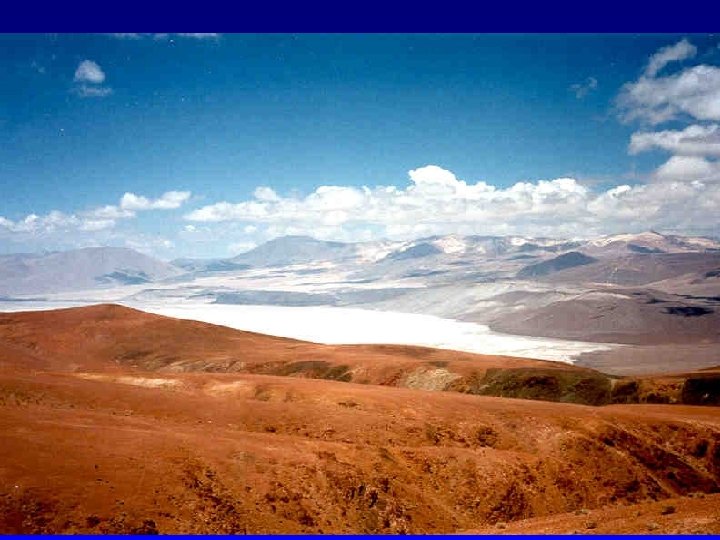
Argentina 7000 m
Peanut Field, Argentina
PROCESSES THAT CAUSE ABSORPTION FEATURES • Electronic • Interactions between electrons and crystal fields • Vibrational • Molecular vibrations • Fundamental • Overtone • Combination
ELECTRONIC PROCESSES • • Crystal field effects Charge transfer Semiconductor Color centers
CRYSTAL FIELD EFFECTS • Energy levels of an ion • Split and displaced in crystal field • Determined by • Valence state • Coordination number and symmetry • Reflectance spectrum • Determined primarily by mineralogy not cation • Depth of feature grain-size dependent
CRYSTAL FIELD EFFECTS • Iron most important • Most abundant • Fe 2+ , Fe 3+ can substitute • Mg 2+ • Al 3+
Ruby, Al 2 O 3 + Cr+++
Emerald, Be 3 Al 2 Si 6 O 18 + Cr+++
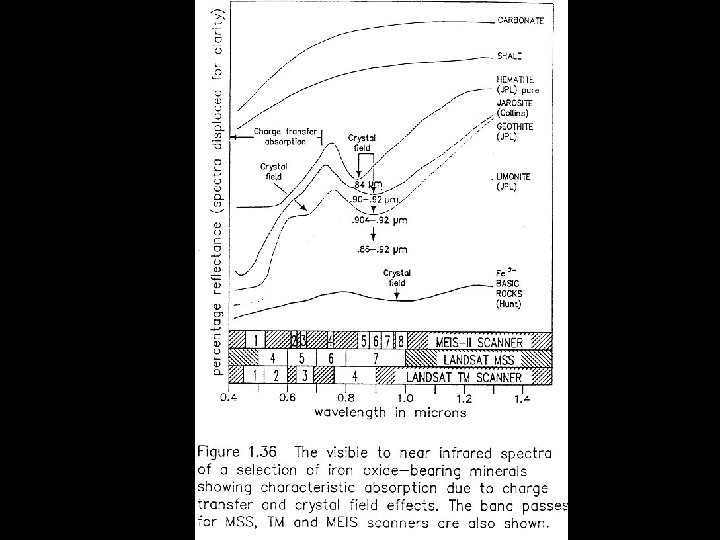
Electronic Transitions in Iron Minerals
Iron Minerals Lepidocrocite Ferrihydrite Maghemite Goethite Hematite
CHARGE TRANSFER • Electrons transfer from one atom to another • Fe-O transfer responsible for reflectance falloff towards UV
SEMICONDUCTORS • Absorption edge in reflectance spectrum • Created by width of forbidden energy band gap • Incoming photons must have enough energy to promote valence band electrons into conduction band • Reflectance increases dramatically at wavelength corresponding to band gap energy
COLOR CENTERS • Electron trapped in a structural defect such as a missing ion • In fluorite (Ca. F 2) a color center is formed when an F ion is missing and replaced by an electron • Transition states created cause red-green absorption, hence purple color
VIBRATIONAL PROCESSES • Fundamental vibrations • For solids, generally occur beyond 2. 5 m • Si-O, Al-O occur in 10 m region, no effect in VNIR or SWIR • OH, H 2 O, CO 3 occur in 2. 6 -6 m region, overtones and combinations found in VNIR, SWIR • 3 N-6 possible degrees of freedom • H 2 O has 3 fundamental vibrations at 2. 66, 2. 74, 6. 08 m
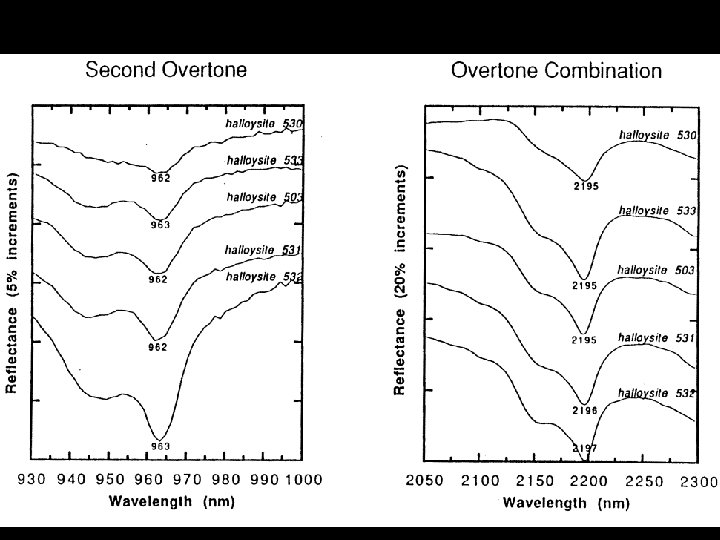
OVERTONES AND COMBINATIONS • Overtones • Multiples of the fundamental frequency • 2 1, 3 2, …. . • Combinations • Sums and differences of fundamental or overtone frequencies • 1 + 2 , 2 1 + 3, 1 + 2 + 3, …. • Frequencies not wavelengths added • • Frequency units in cm-1 • 2. 5 m = 4000 cm-1
WATER VAPOR • Absorption fundamentals • 1 = 3657. 05 cm-1 = 2. 734 m symmetric stretch • 2 = 1594. 75 cm-1 = 6. 271 m bend • 3 = 3755. 93 cm-1 = 2. 662 m asymmetric stretch • Important water vapor absorptions • 2 + 3 = 1. 865 m • 1 + 3 = 1. 379 m • 1 + 2 + 3 = 1. 135 m • 2 1 + 3 = 0. 942 m
LIQUID WATER • Absorption fundamentals • 1 = 3219. 57 = 3. 106 m • 2 = 1644. 74 = 6. 08 m • 3 = 3444. 71 = 2. 903 m
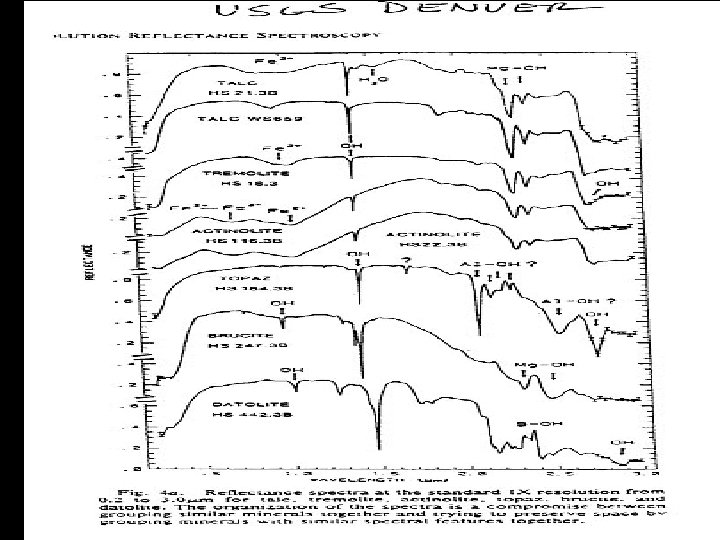
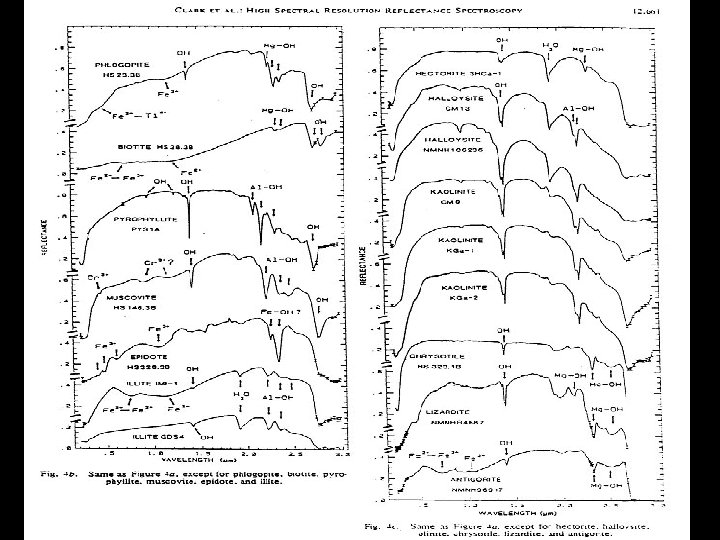
HYDROXYL • Absorption fundamental • 2. 77 m stretch • Exact location depends on site on which it is located • Overtone • 2 ~ 1. 4 m • Most common feature in terrestrial material spectra • Combinations • Al or Mg - OH bending modes • Features in 2. 2 & 2. 3 m region
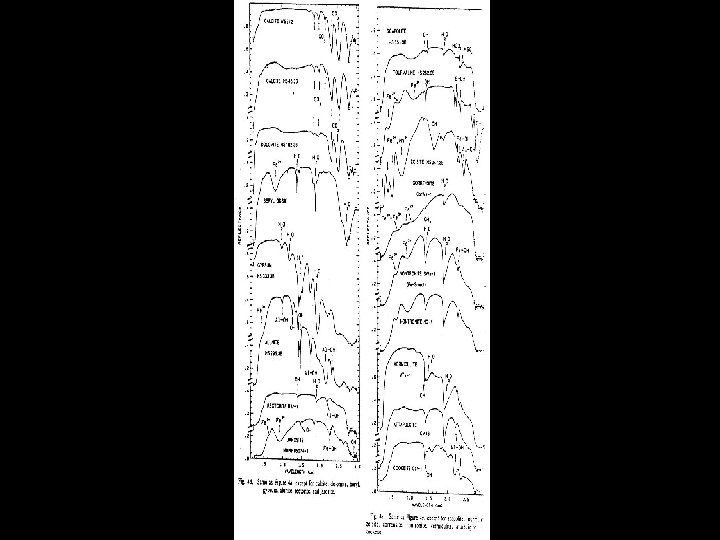
SPECTRAL PROPERTIES SOME COMMON ABSORPTION FEATURES FEATURE POSITION Fe 3+ 0. 4 - 0. 6 m, 0. 66 m, 0. 85 0. 95 m Al - OH 2. 15 - 2. 22 m Mg - OH 2. 30 - 2. 39 m Fe - OH 2. 24 - 2. 27 m Si - OH 2. 25 m (broad) H 2 O 1. 9 m CO 3 2. 30 - 2. 35 m NH 4 2. 0 - 2. 13 m
Laboratory Spectra
Coatings (thin films) • Absorption features are square root 2 (0. 707) narrower width than thick particulate surfaces. Coatings vary from transmissive thin films to full scattering thick layers; the natural width of spectral features varies by root 2.
The variety of absorption processes and their wavelength dependence allows us to derive information about the chemistry of a mineral from its reflected or emitted light.
SELECTED DIGITAL SPECTRAL DATA BASES • JPL Laboratory reflectance spectra of 2000 natural and man-made materials, 0. 4 to 14 micrometers • Contact: Dr. Simon Hook JPL, MS 183 -501 4800 Oak Grove Drive Pasadena, CA 91109 Phone: 818 -354 -0974 Fax: 818 -354 -0966 E-mail: Simon. J. Hook@jpl. nasa. gov Web: http: //speclib. jpl. nasa. gov/
SELECTED DIGITAL SPECTRAL DATA BASES • CSIRO Spectral Library Contact: Dr. Jon Huntington CSIRO Division of Exploration & Mining P. O. Box 136 North Ryde, N. S. W. , 1670 Australia Phone: +61 -2 -94908839 E-mail: Jon. Huntington@csiro. au Web: http: //www. syd. dem. csiro. au/research/MMTG/
SELECTED DIGITAL SPECTRAL DATA BASES • USGS (Denver) Spectral Library Contact: Dr. Roger Clark U. S. G. S. P. O. Box 25046, MS 964 Denver, CO 80225 -0046 Phone: 303 -236 -1332 Fax: 303 -236 -1425 E-mail: rclark@usgs. gov Web: http: //speclab. cr. usgs. gov/