Field Maps What are fields A field is


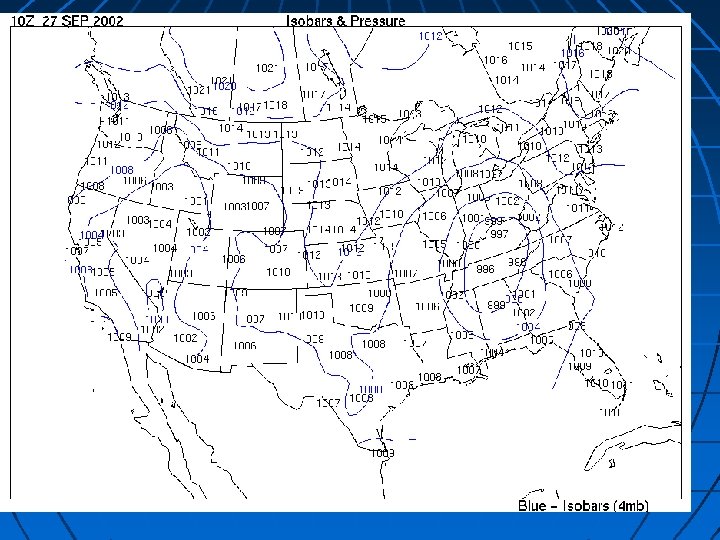
 • points of equal temperature Isobar: (barometers")


 There are no lines since there isn’t")


- Slides: 58
Field Maps
What are fields? A field is any place where you can make a measurement. Today our classroom was the field when we created our odor field map. You can measure anything in a field like we can measure temperature of the class or even how much dust is in the room.
What is the field and what is the field value? The field is the classroom and the field value is temperature.
Isolines An isoline is a line connecting points of equal value.
Examples of isolines: Isotherms: (thermometers measure temperature) • points of equal temperature Isobar: (barometers measure pressure) • points of equal barometric (air) pressure Contour: (show contours or shape of the land) • points of equal altitude Anything else you can get a value for.
Rules for Drawing Isolines: 1. Isolines connect points of equal value. 5 5 10 10 10 15 15
2. Isolines NEVER cross- this would mean that one point has two different values. Ex: one spot has two temperatures? 40 ° 30 degrees and 40 60 ° degrees 50 ° are both here? X 20° Y Z
3. Isolines are always closed curves even though the map might only show part of it.
Let’s practice drawing! 18 * 17 * 18 * 19 * 19 * 20 * 21 * 2 O * 20 * 21. 5 * 22 * 23 * 22 * 23. 5 * 23 * 24 * 25 * Draw isotherms of 18, 20, 22, 24. Isotherm interval = 2
Contour Maps Contour lines connect all measurements that are equal elevations (height above sea level). Sea level = 0 elevation Contour maps can show you the shape of the land.
How contour maps work For every change in elevation a new contour line is created. Contour Maps in Action
Assume the base of the mountain is at sea level. The box is slowly being filled with water. Since water automatically levels itself off, it will touch the “mountain” at the same height all the way around. If we were to peer down into the box from above, we could draw a line on the lid that marks where the water touches the “mountain”. This would be a contour line for that elevation.
Contour lines follow the same rules for isolines. Contour Lines – connect points of equal elevation Contour Interval (C. I. ) – difference between adjacent contour lines Contour Lines NEVER touch! Elevation at sea level = ZERO
Sea Level = 0 0
What is the contour interval? 50 40 30 20 C. I. = 10
What is the contour interval? 150 200 100 50 C. I. = 50
How are land features shown on a contour map? Contour maps can show different land features such as hills, rivers, mountains, cliffs and even flat lands. Contour maps are flat representations of 3 -D objects.
Hill
Contour Lines showing a Hill
How are hills shown? On a contour map hills are shown by a series of circles. The smaller inside circles have a higher elevation than the larger outside circles. 40 20 60
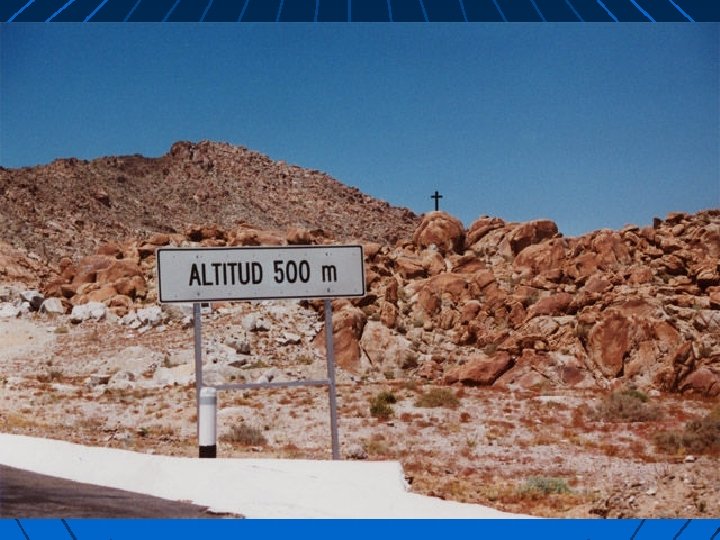
Gentle Slope/Flat Landscape
Flat Landscape
Widely-spaced contours = flat landscape (gentle slope) There are no lines since there isn’t any change in elevation.
Steep Slope
Rocky Mountains
Closely-spaced contours indicate a steep slope
Closely Spaced Contours
Landscape with both steep and gentle slopes
How can you tell where the steep part is and where the gentle or flat part is on the map? Think back… How are steep slopes indicated on a contour map? Closely spaced lines. How are flat areas or gentle slopes indicated on a contour map? Lines are far apart.
Which side of the hill is steepest? N E W WEST S
Determining the Maximum Elevation of a hill: The maximum elevation of a hill is one C. I. lower than what the next line would have been. What is the maximum elevation at A? 50 - 1= 49 A C. I. = 10 30 40
What is the maximum elevation at X? 80 -1 = 79 X 60 0 20 40 C. I. = 20
What is the Max. Elevation? The next contour line would be 240 so the highest point is 240 -1 = 239
Contour lines bend whenever they cross a river. The contour lines make a v shape that helps to determine which way the river is flowing.
Comes out here Water comes out the open side of the V. Starts here.
Which way is this river flowing? NW
Which direction are the rivers flowing? NE NW SW SE
Which direction is the stream flowing? South
Dune Hole
Contour Depressions A region where elevation decreases Represented by hachure marks
Contour Depression Hachure marks are small lines on the inside of the contour circles. They tell you that area is going down instead of up. The circles are decreasing with the same interval as the rest of the map.
Rule for Contour Depressions: If the next line has a different slope (hachured line next to a normal line), keep the elevation once. If the following line also has hachures, then the number decreases 50 50 40 C. I. = 10
Rule for Contour Depressions: If the next line has a different slope (hachured line next to a normal line), keep the elevation once. 50 50 50 C. I. = 10
What are the contour values of this depression? 0 20 40 60 C. I. = 20
100 200 300 What is the value of the hachured line? 300 m – it has the same value of the contour line next to it (without the hachures. )
Contour interval? 10 Value of A? 0 Value of B? 10 Highest possible height of letter D? 29 (30 would be the next contour so 301) Side of the island with the highest elevation? East
Contour interval? 20
Label contour lines Direction of stream flow? South Highest possible height of western hill? 649 600 550 400 500
Direction of stream flow? North, northwest Value of B? 880