
Field Experience Controlling a Dedicated Outdoor Air System

- Slides: 33
Field Experience Controlling a Dedicated Outdoor Air System (DOAS) ASHRAE Denver Symp #2 June 26, 2005 Stanley A. Mumma, Ph. D. , P. E. , Prof. Jae-Weon Jeong, Ph. D. , Instructor Department of Architectural Engineering Penn State University, @ Univ. Park, PA http: //doas-radiant. psu. edu
Presentation outline § DOAS and Test Site Defined § Controlled Devices, Instrumentation, and Control § The Why & How of Continual Performance Monitoring § Measured Air Diffusion Performance Index (ADPI) of System: f (Effective Draft Temperature) § Measured Thermal Comfort, PPD § Conclusions 2
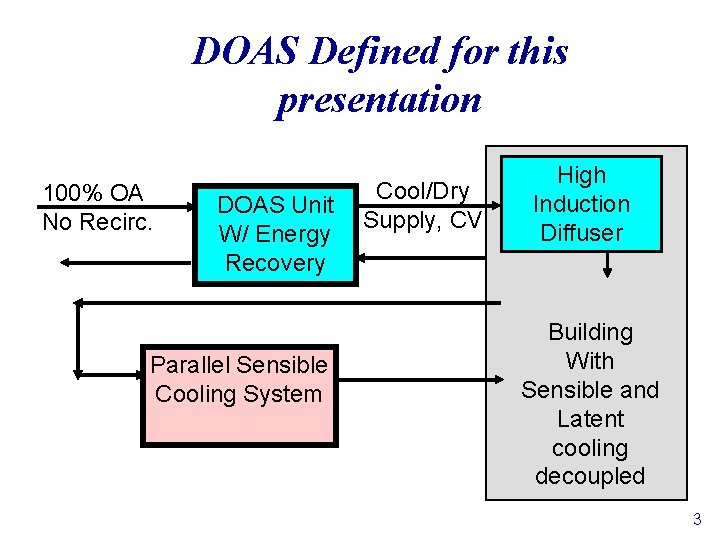
DOAS Defined for this presentation 100% OA No Recirc. DOAS Unit W/ Energy Recovery Parallel Sensible Cooling System Cool/Dry Supply, CV High Induction Diffuser Building With Sensible and Latent cooling decoupled 3
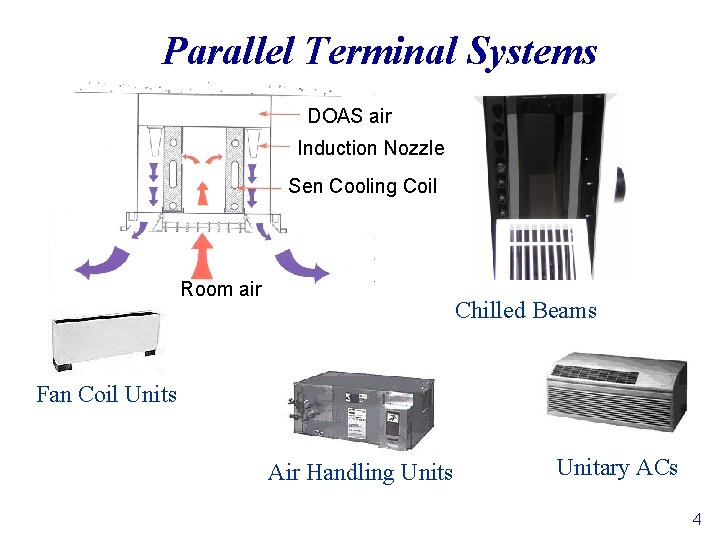
Parallel Terminal Systems DOAS air Induction Nozzle Sen Cooling Coil Radiant Cooling Panels Room air Chilled Beams Fan Coil Units Air Handling Units Unitary ACs 4
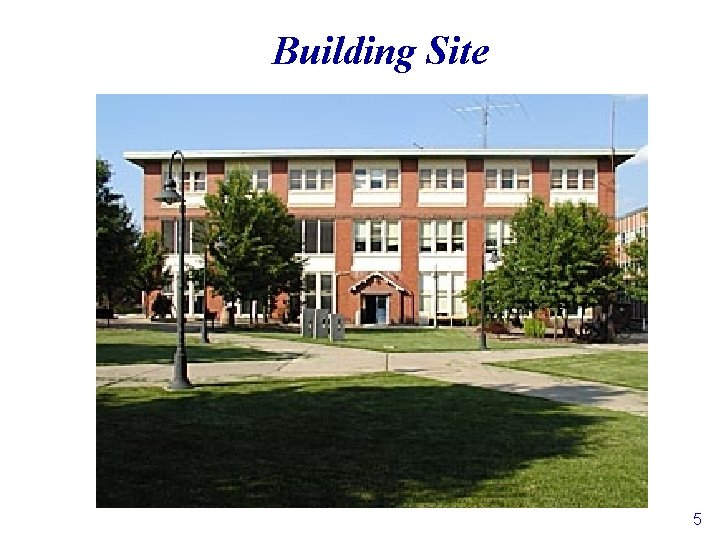
Building Site 5
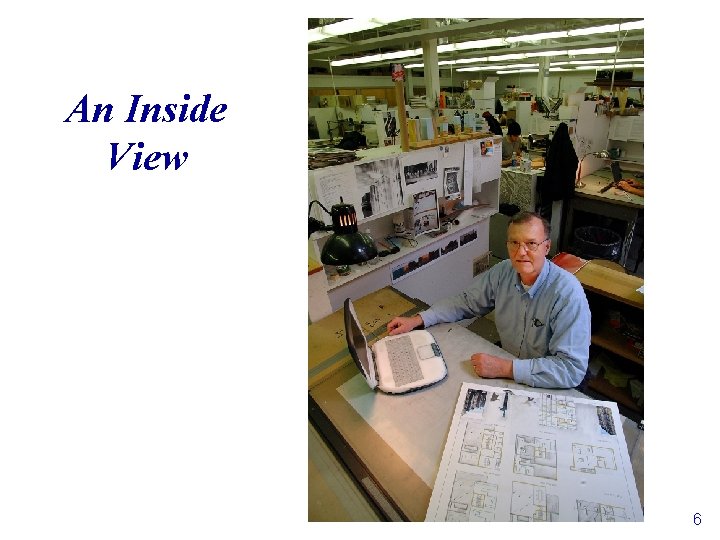
An Inside View 6
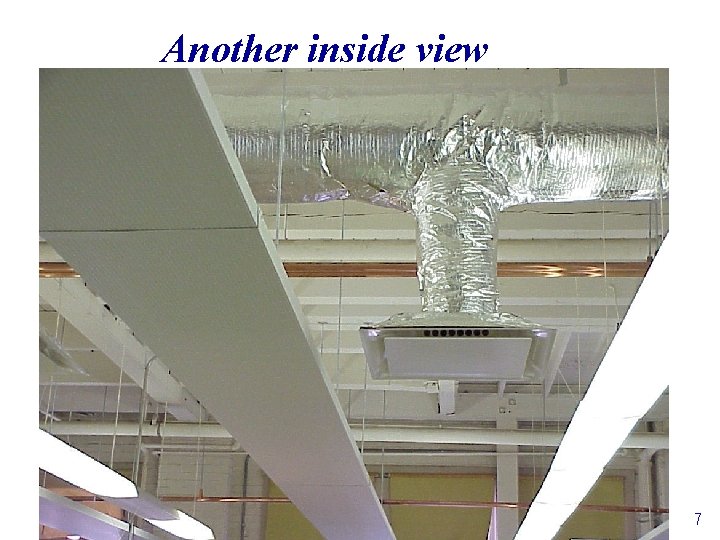
Another inside view 7
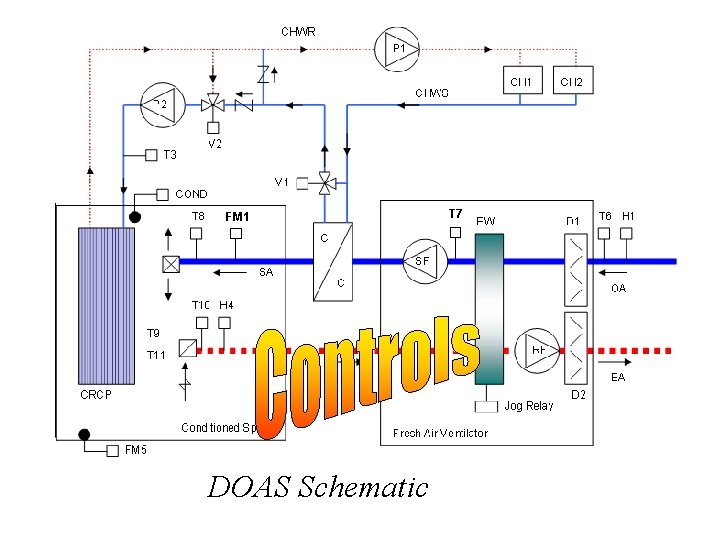
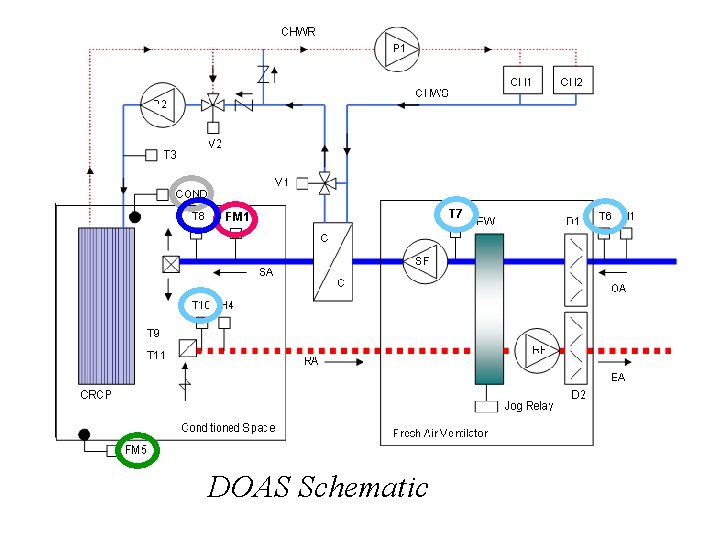
FM 1 DOAS Schematic T 7
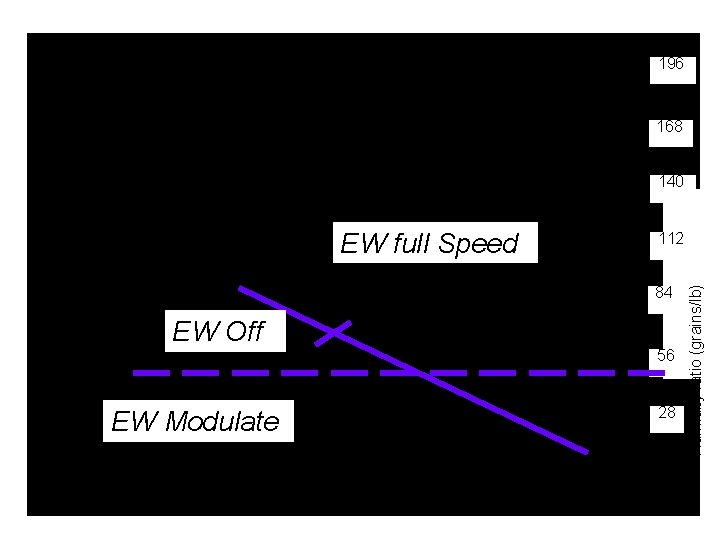
196 168 140 wet dry 112 84 EW Off EW Modulate 56 28 Humidity ratio (grains/lb) EW full Speed
Continual Performance Monitoring—the Need § Dr. J Woods reports that 5 -10% of entire non industrial building stock has building related illnesses. § And 10 -25% of the Stock has sick building syndrome. § These are facilities that began their life with no known problems, then degraded. § Also, DOE reports that monitoring could save 0. 45 Quads/yr of energy. 10
Categories of performance degradation § Insufficient diagnostic and alarm tools for early warning of degradation. § Management’s lack of awareness of the economic consequences. § Management’s Indifference. 11
Avoiding Potential Degradation in a DOAS-Radiant System § Compromised SA quantity: equipment problems, dirt, etc: FM 1 used to detect. § Compromised building pressurization, (infiltration): FM 5 used to detect. § Compromised supply air temperature: detect EW using T 6 -7 -10, or CC T 8. § Condensation: Cond sensor to detect. Note: sensors color coded with next slide 12
FM 1 DOAS Schematic T 7
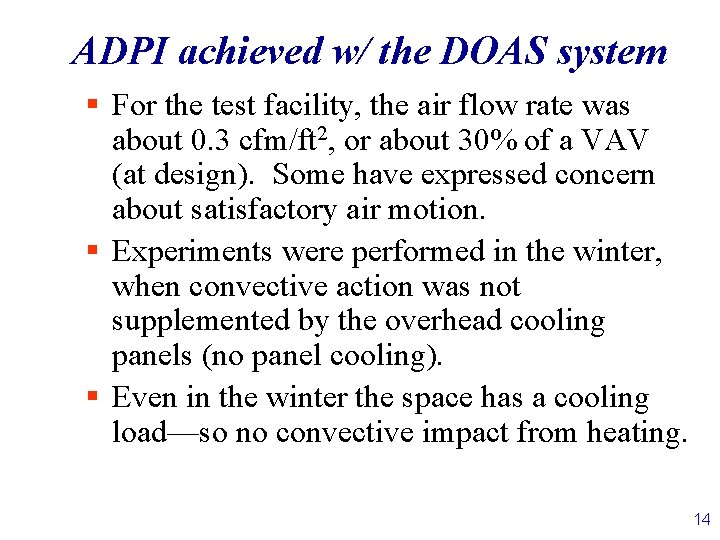
ADPI achieved w/ the DOAS system § For the test facility, the air flow rate was about 0. 3 cfm/ft 2, or about 30% of a VAV (at design). Some have expressed concern about satisfactory air motion. § Experiments were performed in the winter, when convective action was not supplemented by the overhead cooling panels (no panel cooling). § Even in the winter the space has a cooling load—so no convective impact from heating. 14
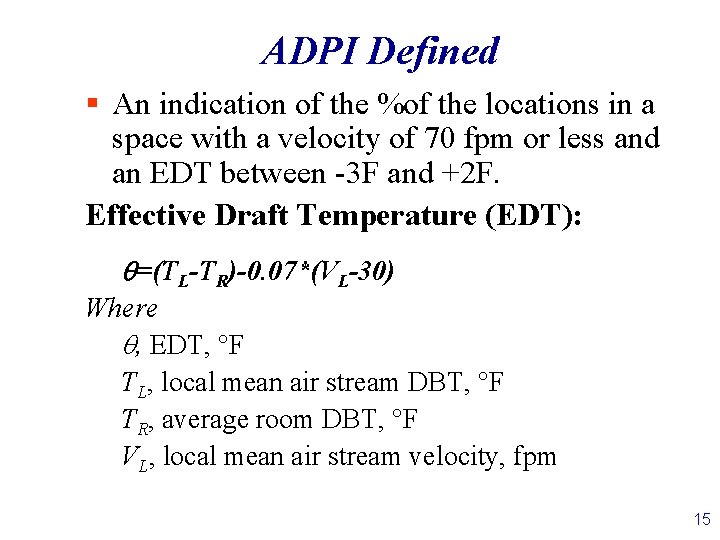
ADPI Defined § An indication of the %of the locations in a space with a velocity of 70 fpm or less and an EDT between -3 F and +2 F. Effective Draft Temperature (EDT): q=(TL-TR)-0. 07*(VL-30) Where q, EDT, °F TL, local mean air stream DBT, °F TR, average room DBT, °F VL, local mean air stream velocity, fpm 15
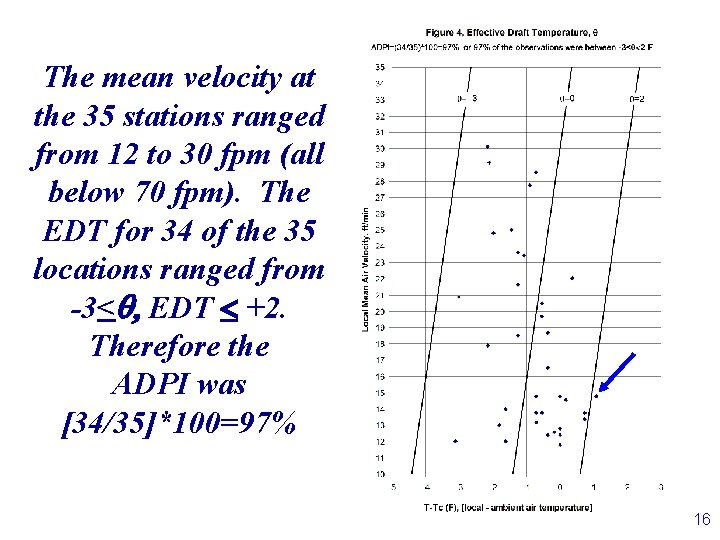
The mean velocity at the 35 stations ranged from 12 to 30 fpm (all below 70 fpm). The EDT for 34 of the 35 locations ranged from -3<q, EDT < +2. Therefore the ADPI was [34/35]*100=97% 16
ADPI conclusion § DOAS can deliver exceptionally high ADPI’s; a very favorable finding! 17
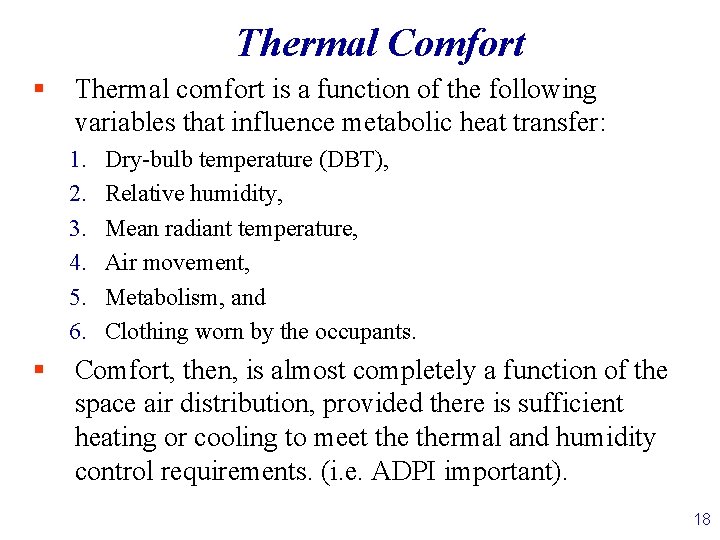
Thermal Comfort § Thermal comfort is a function of the following variables that influence metabolic heat transfer: 1. 2. 3. 4. 5. 6. § Dry-bulb temperature (DBT), Relative humidity, Mean radiant temperature, Air movement, Metabolism, and Clothing worn by the occupants. Comfort, then, is almost completely a function of the space air distribution, provided there is sufficient heating or cooling to meet thermal and humidity control requirements. (i. e. ADPI important). 18
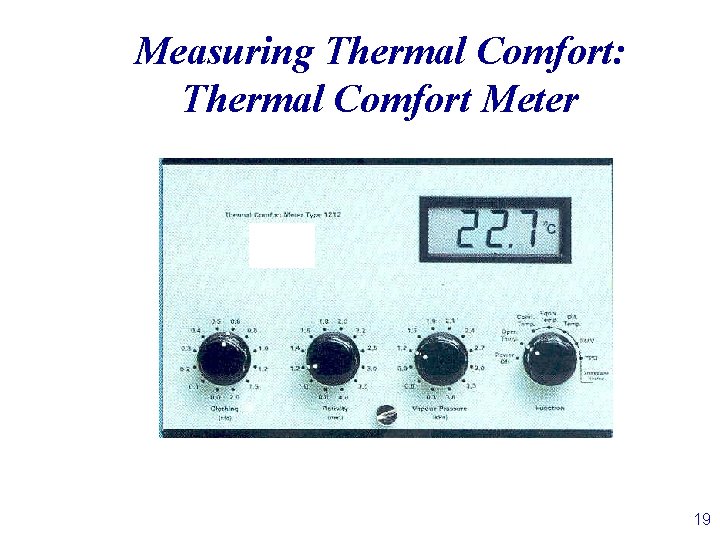
Measuring Thermal Comfort: Thermal Comfort Meter 19
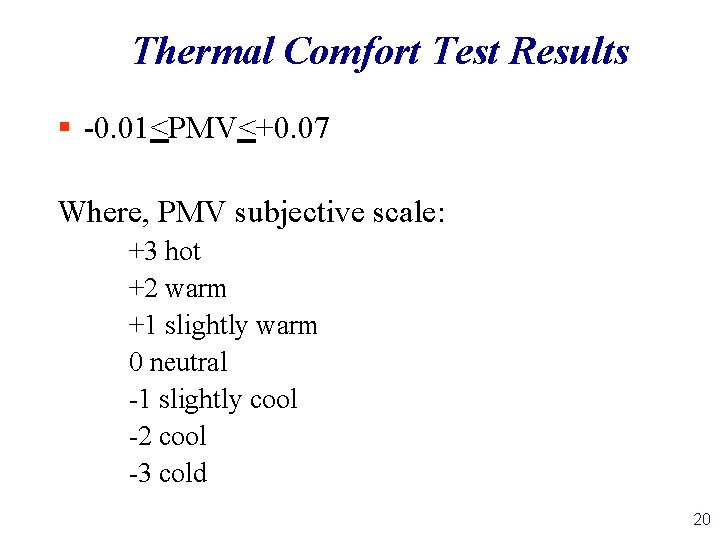
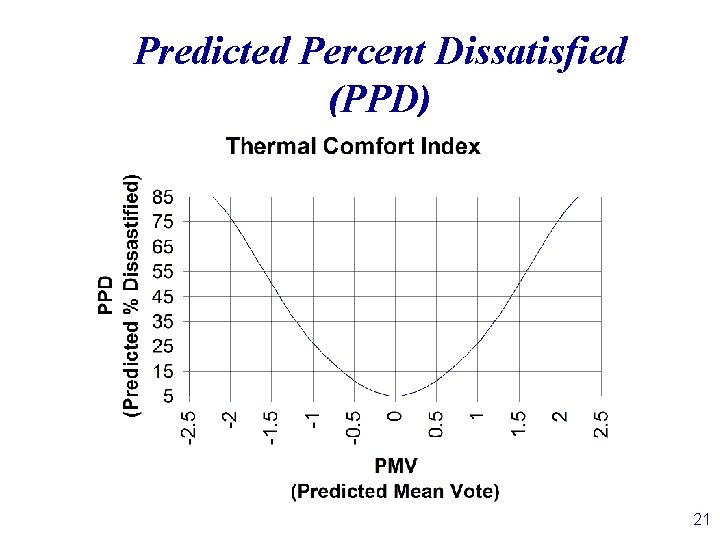
Thermal Comfort Test Results § -0. 01<PMV<+0. 07 Where, PMV subjective scale: +3 hot +2 warm +1 slightly warm 0 neutral -1 slightly cool -2 cool -3 cold 20
Predicted Percent Dissatisfied (PPD) 21
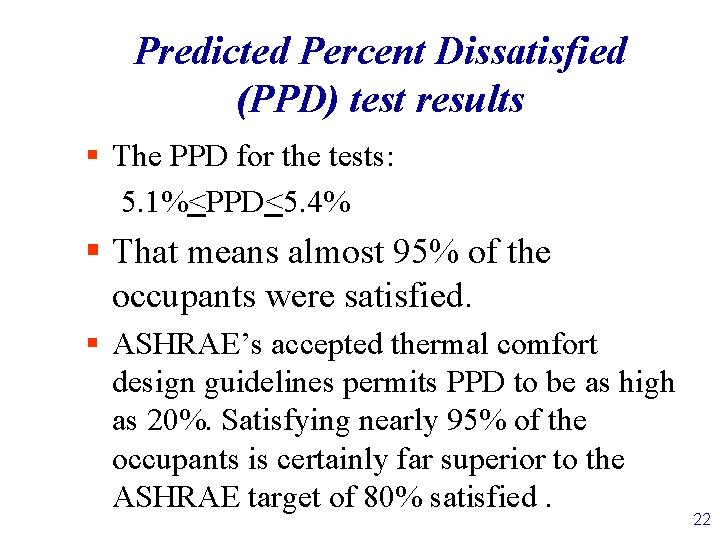
Predicted Percent Dissatisfied (PPD) test results § The PPD for the tests: 5. 1%<PPD<5. 4% § That means almost 95% of the occupants were satisfied. § ASHRAE’s accepted thermal comfort design guidelines permits PPD to be as high as 20%. Satisfying nearly 95% of the occupants is certainly far superior to the ASHRAE target of 80% satisfied. 22
Conclusions § Dedicated outdoor air systems (DOAS), when properly designed and controlled, are capable of delivering very stable and comfortable environments (PPD = 5%). § The authors have experienced no difficulties making the system and controls perform as designed/desired. § Perhaps the keys to success are: – the proper control of the enthalpy wheel, and – the control of the cooling equipment to assure that the space latent loads are completely handled by the ventilation air. 23
Conclusions § It has been demonstrated that good air motion is achieved (ADPI of 97%) with ventilation air flow alone (typically around 20 -30% of that required for thermal control), § It is not necessary to deliver large quantities of primary air to provide thermal comfort. § As a result, there can be significant air movement energy savings when a CRCP hydronic parallel system is used to meet the balance of the space sensible load not met with the ventilation air. 24
Conclusions § Finally, because of the ability of the DOAS to decouple the space latent control from the sensible control, space relative humidity levels are maintained at the desired design level. 25
Inherent problems with VAV Systems § § § Poor air distribution. Poor humidity control. Poor acoustical properties. Poor use of plenum and mechanical shaft space. Serious control problems, particularly with tracking return fan systems. § Poor energy transport medium, air. § Poor resistance to the threat of biological and chemical terrorism, and § Poor and unpredictable ventilation performance. 27
VAV problems solved with DOAS/Radiant § § § § Poor air distribution. Poor humidity control. Poor acoustical properties. Poor use of plenum and mechanical shaft space. Serious control problems, particularly with tracking return fan systems. Poor energy transport medium, air. Poor resistance to the threat of biological and chemical terrorism, and Poor and unpredictable ventilation performance. 28
Consequences of system degradation— Ref: Dr. Jim Woods § 20% of US workers experiencing health related symptoms § Another 20% of US workers are experiencing hampered performance § 50% of US workers have lost confidence in management’s ability to deal with the situation. § A major economic investment is needed to mitigate each problem and recover workers “goodwill”. 29
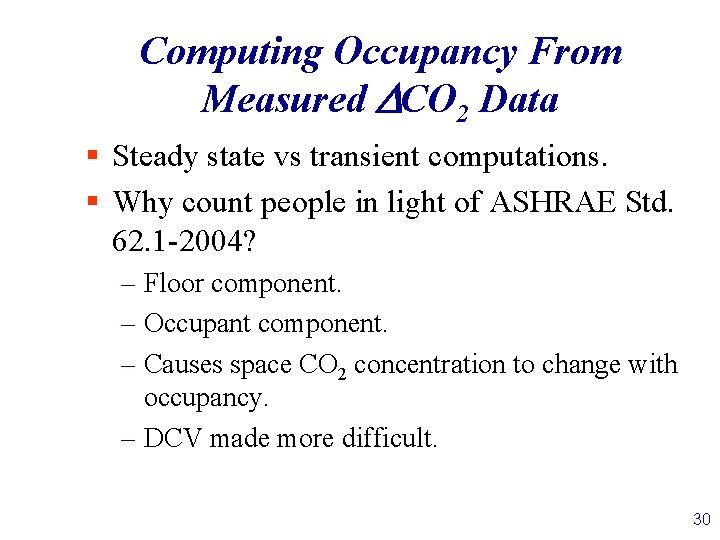
Computing Occupancy From Measured DCO 2 Data § Steady state vs transient computations. § Why count people in light of ASHRAE Std. 62. 1 -2004? – Floor component. – Occupant component. – Causes space CO 2 concentration to change with occupancy. – DCV made more difficult. 30
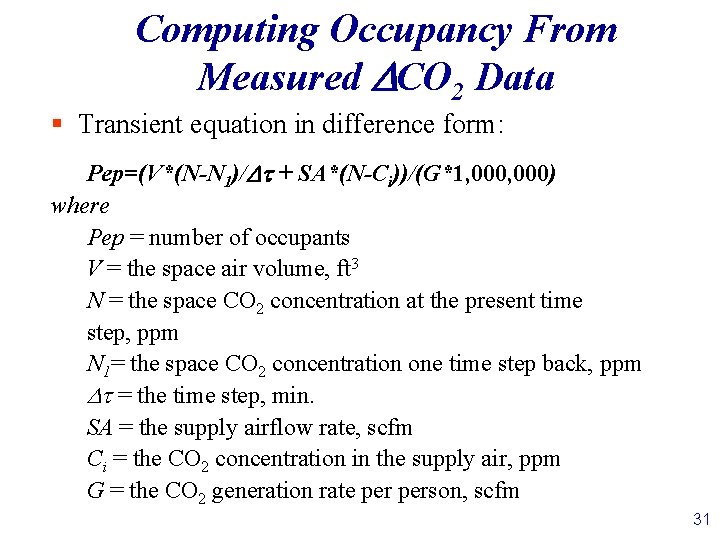
Computing Occupancy From Measured DCO 2 Data § Transient equation in difference form: Pep=(V*(N-N 1)/Dt + SA*(N-Ci))/(G*1, 000) where Pep = number of occupants V = the space air volume, ft 3 N = the space CO 2 concentration at the present time step, ppm N 1= the space CO 2 concentration one time step back, ppm Dt = the time step, min. SA = the supply airflow rate, scfm Ci = the CO 2 concentration in the supply air, ppm G = the CO 2 generation rate person, scfm 31
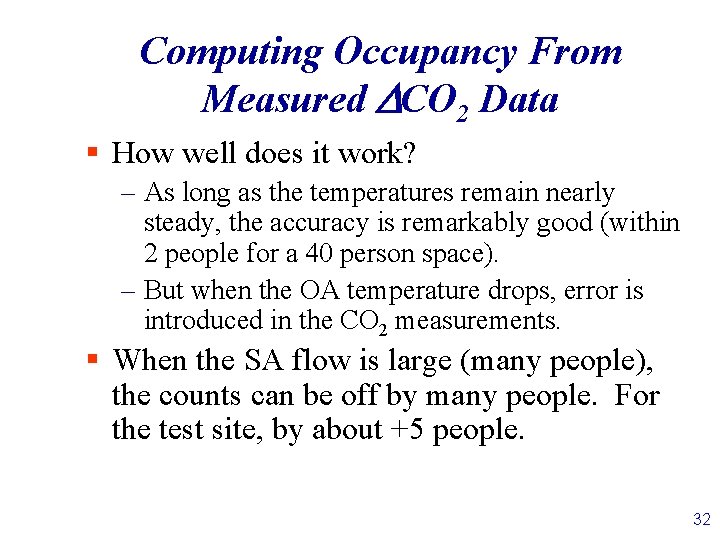
Computing Occupancy From Measured DCO 2 Data § How well does it work? – As long as the temperatures remain nearly steady, the accuracy is remarkably good (within 2 people for a 40 person space). – But when the OA temperature drops, error is introduced in the CO 2 measurements. § When the SA flow is large (many people), the counts can be off by many people. For the test site, by about +5 people. 32
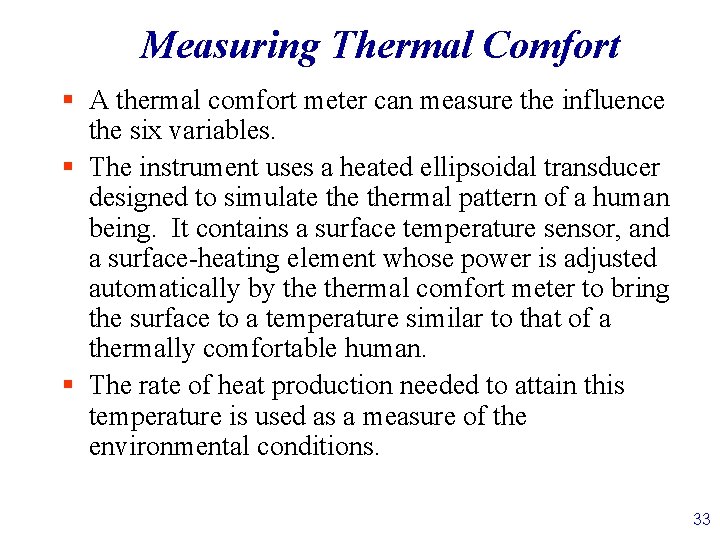
Measuring Thermal Comfort § A thermal comfort meter can measure the influence the six variables. § The instrument uses a heated ellipsoidal transducer designed to simulate thermal pattern of a human being. It contains a surface temperature sensor, and a surface-heating element whose power is adjusted automatically by thermal comfort meter to bring the surface to a temperature similar to that of a thermally comfortable human. § The rate of heat production needed to attain this temperature is used as a measure of the environmental conditions. 33