
FEL opt Laser crosscorrelation Reinhard Kienberger 1 2

FEL – opt. Laser cross-correlation Reinhard Kienberger 1, 2, (3) 1 2 3 Institut für Photonik, Technische Universität Wien, Austria (Ferenc Krausz) SPPS (April – end 2004, fellowship Austrian Academy of Sciences) Max-Planck Institut für Quantenoptik, Garching / München, Germany SLAC-workshop XFEL 2004 July 28, 2004
Outline 1. ) Cross-correlation technique: • Photo- / Auger Electrons • Attosecond streak camera 2. ) Sidebands at ‚long‘ pulses 3. ) Chirped Pulse Laser Assisted Auger Decay
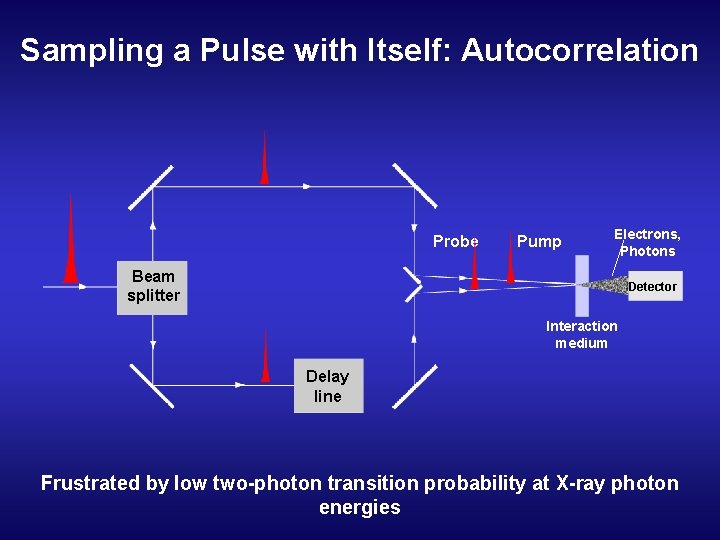
Sampling a Pulse with Itself: Autocorrelation Probe Pump Electrons, Photons Beam splitter Detector Interaction medium Delay line Frustrated by low two-photon transition probability at X-ray photon energies
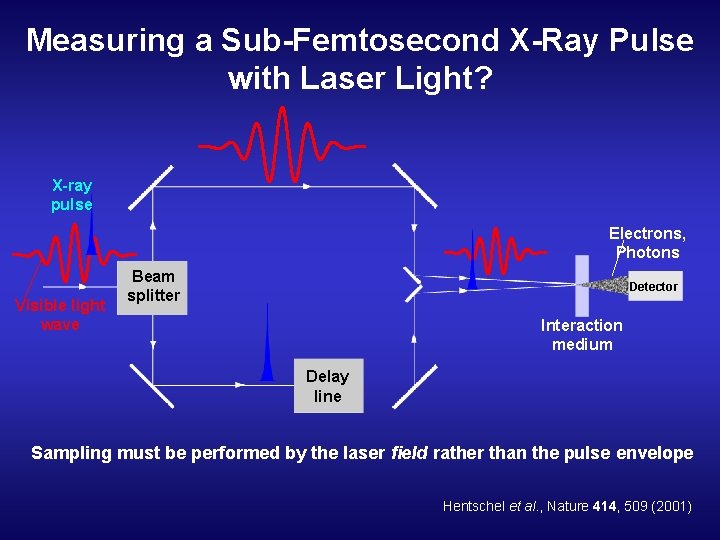
Measuring a Sub-Femtosecond X-Ray Pulse with Laser Light? X-ray pulse Electrons, Photons Visible light wave Beam splitter Detector Interaction medium Delay line Sampling must be performed by the laser field rather than the pulse envelope Hentschel et al. , Nature 414, 509 (2001)
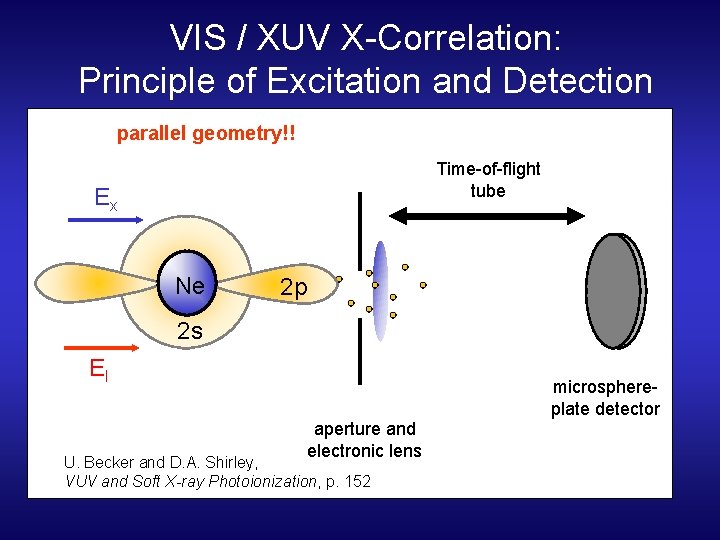
VIS / XUV X-Correlation: Principle of Excitation and Detection parallel geometry!! Time-of-flight tube Ex Ne 2 p 2 s El microsphereplate detector aperture and electronic lens U. Becker and D. A. Shirley, VUV and Soft X-ray Photoionization, p. 152
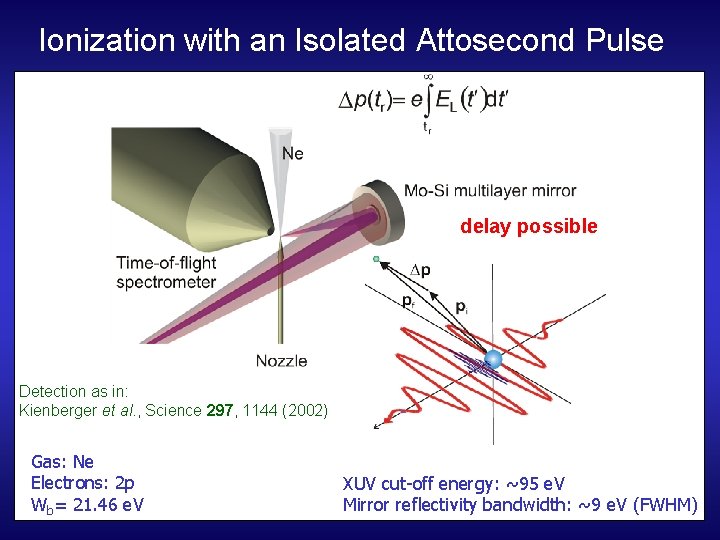
Ionization with an Isolated Attosecond Pulse delay possible Detection as in: Kienberger et al. , Science 297, 1144 (2002) Gas: Ne Electrons: 2 p Wb= 21. 46 e. V XUV cut-off energy: ~95 e. V Mirror reflectivity bandwidth: ~9 e. V (FWHM)
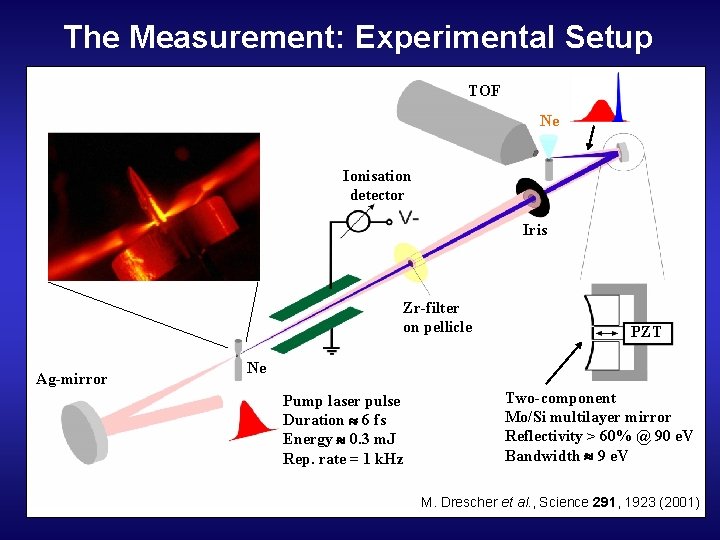
The Measurement: Experimental Setup TOF Ne Ionisation detector Iris Zr-filter on pellicle Ag-mirror PZT Ne Pump laser pulse Duration 6 fs Energy 0. 3 m. J Rep. rate = 1 k. Hz Two-component Mo/Si multilayer mirror Reflectivity > 60% @ 90 e. V Bandwidth 9 e. V M. Drescher et al. , Science 291, 1923 (2001)
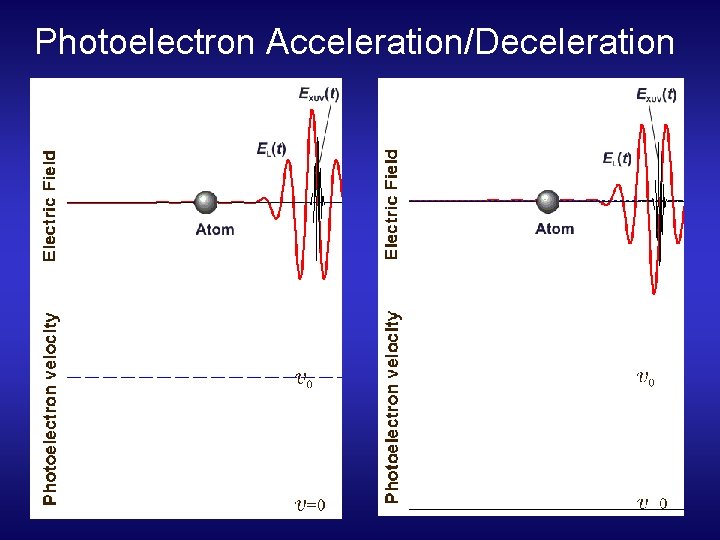
Photoelectron Acceleration/Deceleration
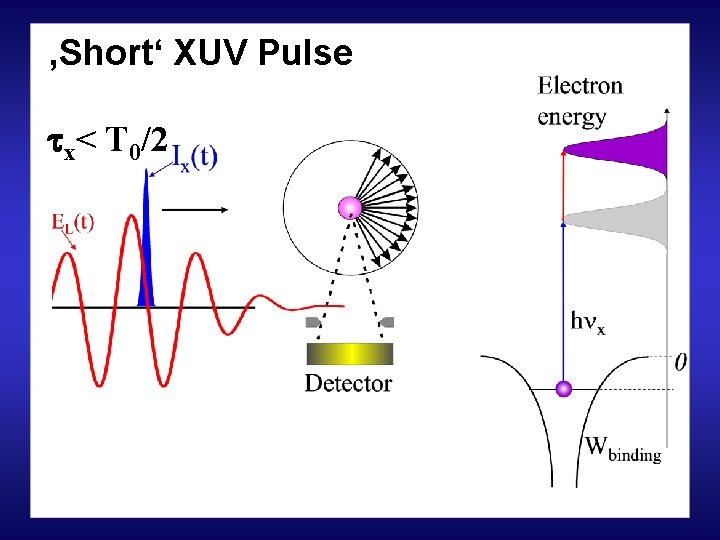
‚Short‘ XUV Pulse x< T 0/2
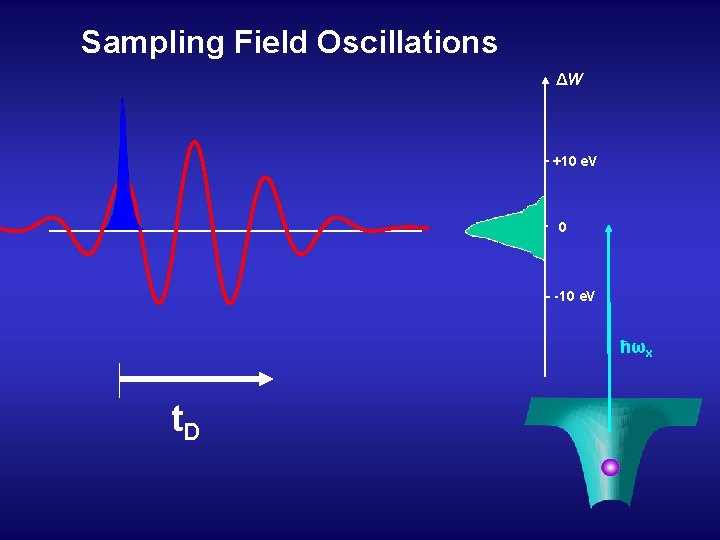
Sampling Field Oscillations ΔW +10 e. V 0 -10 e. V ħωx t. D
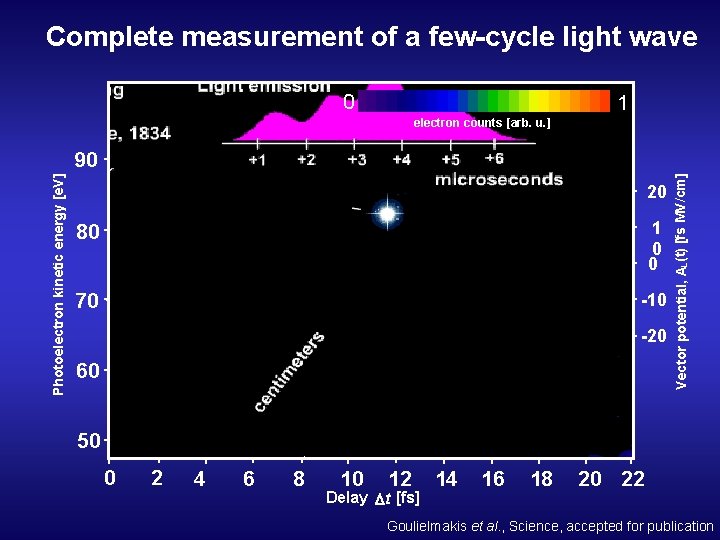
Complete measurement of a few-cycle light wave 0 1 electron counts [arb. u. ] 20 80 1 0 0 70 -10 -20 60 Vector potential, AL (t) [fs MV/cm] Photoelectron kinetic energy [e. V] 90 50 0 2 4 6 8 10 12 Delay t [fs] 14 16 18 20 22 Goulielmakis et al. , Science, accepted for publication
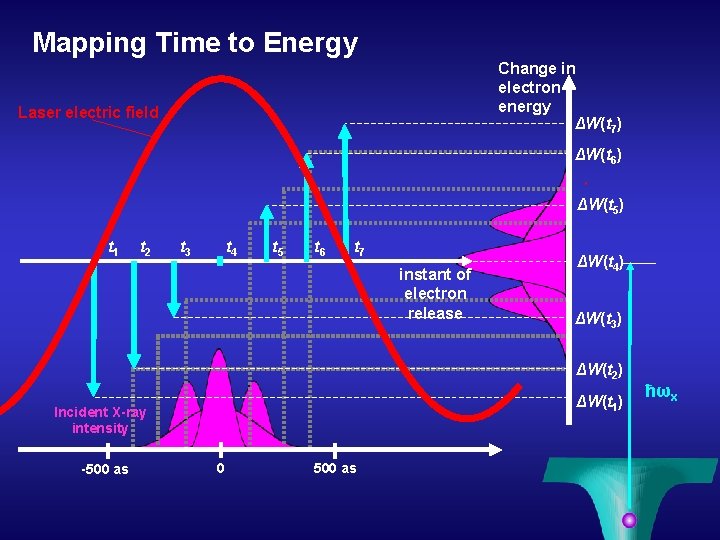
Mapping Time to Energy Change in electron energy ΔW(t 7) Laser electric field ΔW(t 6) ΔW(t 5) t 1 t 2 t 3 t 4 t 5 t 6 t 7 instant of electron release ΔW(t 4) ΔW(t 3) ΔW(t 2) ΔW(t 1) Incident X-ray intensity -500 as 0 500 as ħωx
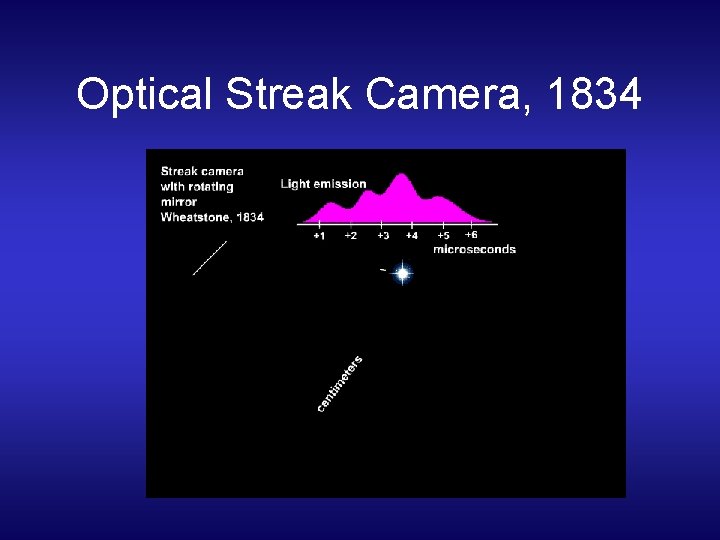
Optical Streak Camera, 1834
Electron Streak Camera
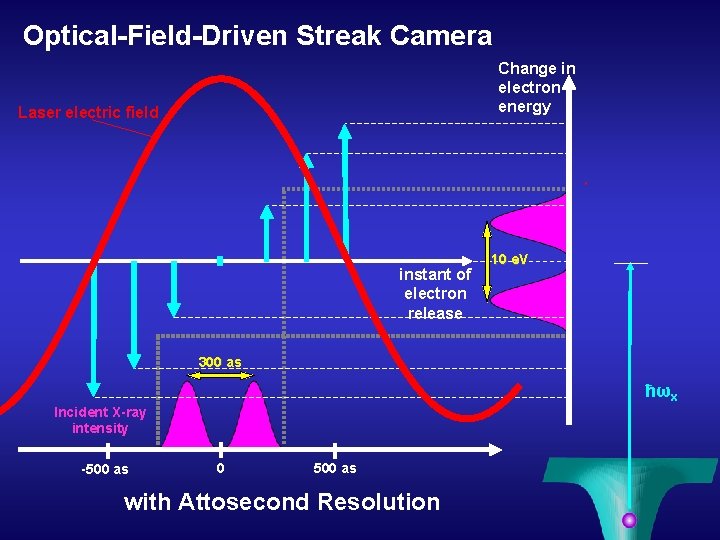
Optical-Field-Driven Streak Camera Change in electron energy Laser electric field instant of electron release 10 e. V 300 as ħωx Incident X-ray intensity -500 as 0 500 as with Attosecond Resolution
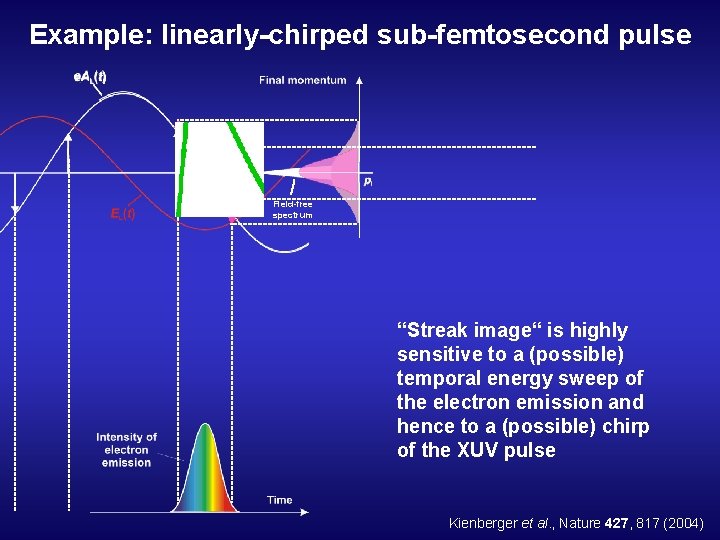
Example: linearly-chirped sub-femtosecond pulse Field-free spectrum “Streak image“ is highly sensitive to a (possible) temporal energy sweep of the electron emission and hence to a (possible) chirp of the XUV pulse Kienberger et al. , Nature 427, 817 (2004)
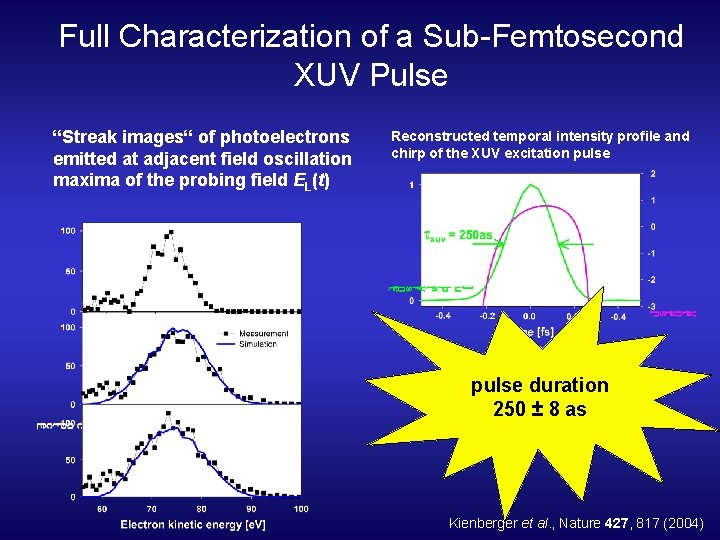
Full Characterization of a Sub-Femtosecond XUV Pulse “Streak images“ of photoelectrons emitted at adjacent field oscillation maxima of the probing field EL(t) Reconstructed temporal intensity profile and chirp of the XUV excitation pulse duration 250 ± 8 as Kienberger et al. , Nature 427, 817 (2004)
Outline 1. ) Cross-correlation technique: • Photo- / Auger Electrons • Attosecond streak camera 2. ) Sidebands at ‚long‘ pulses 3. ) Chirped Pulse Laser Assisted Auger Decay
‚Short‘ XUV Pulse x< T 0/2
‚Long‘ XUV Pulse x> T 0/2
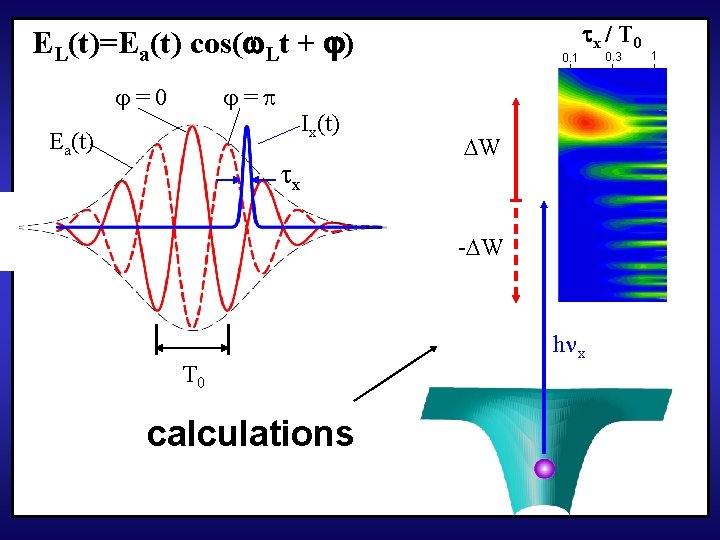
EL(t)=Ea(t) cos( Lt + ) =0 = Ea(t) Ix(t) x 0. 1 x / T 0 W - W T 0 calculations h x 0. 3 1
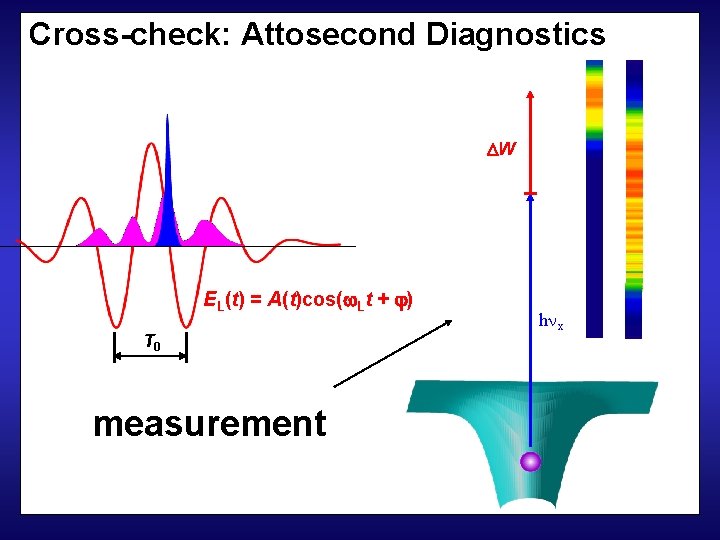
Cross-check: Attosecond Diagnostics W EL(t) = A(t)cos( Lt + ) T 0 measurement h x
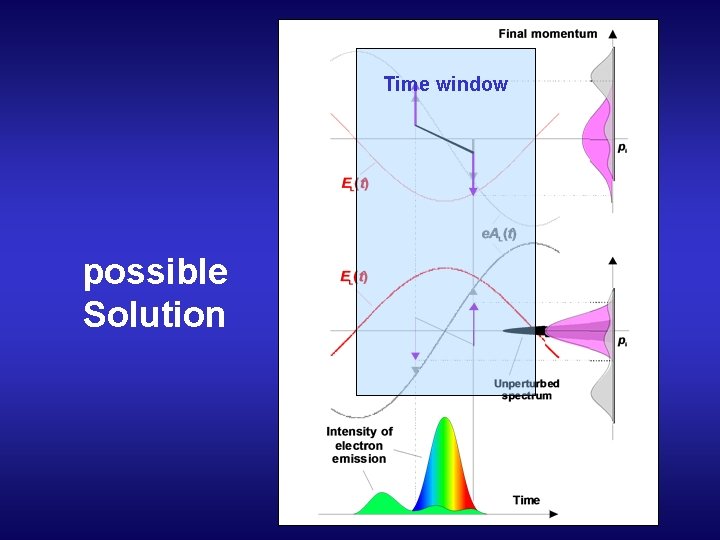
Time window possible Solution
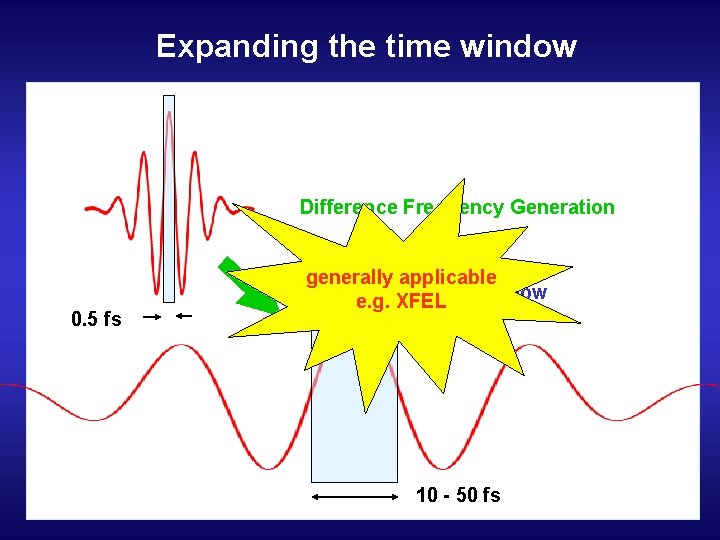
Expanding the time window Difference Frequency Generation 0. 5 fs generally applicable Time window e. g. XFEL 10 - 50 fs
Outline 1. ) Cross-correlation technique: • Photo- / Auger Electrons • Attosecond streak camera 2. ) Sidebands at ‚long‘ pulses 3. ) Chirped Pulse Laser Assisted Auger Decay
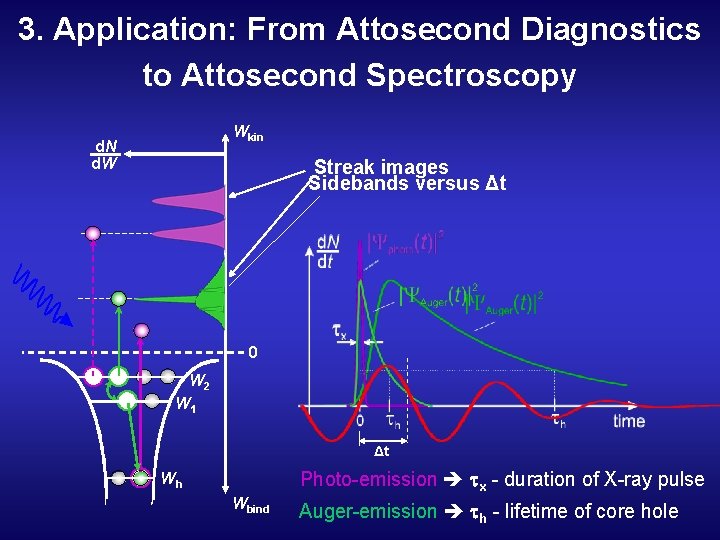
3. Application: From Attosecond Diagnostics to Attosecond Spectroscopy Wkin d. N d. W Streak images Sidebands versus Δt 0 W 2 W 1 Δt Photo-emission x - duration of X-ray pulse Wh Wbind Auger-emission h - lifetime of core hole
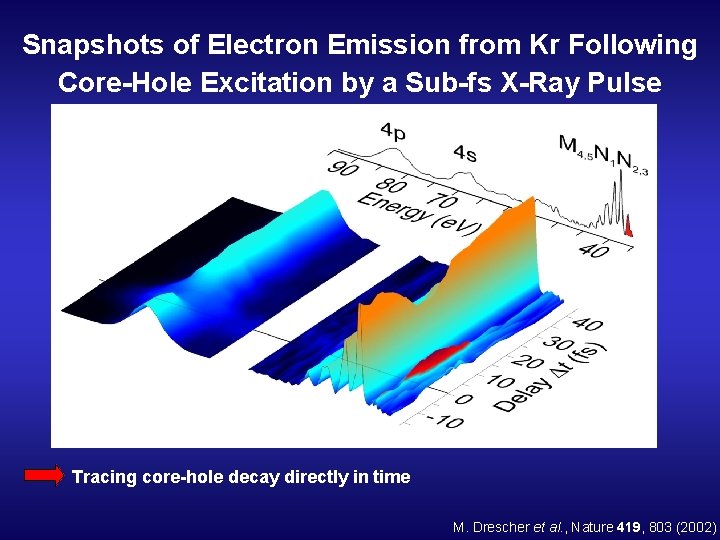
Snapshots of Electron Emission from Kr Following Core-Hole Excitation by a Sub-fs X-Ray Pulse Tracing core-hole decay directly in time M. Drescher et al. , Nature 419, 803 (2002)
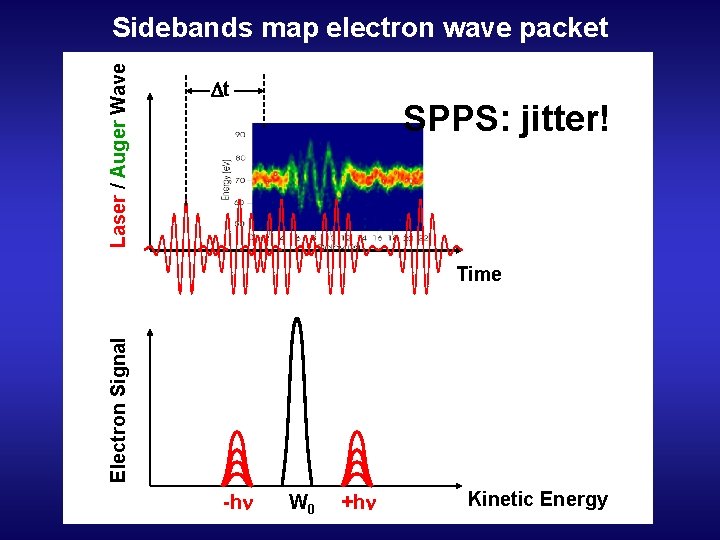
Laser / Auger Wave Sidebands map electron wave packet t SPPS: jitter! Electron Signal Time -hn W 0 +hn Kinetic Energy
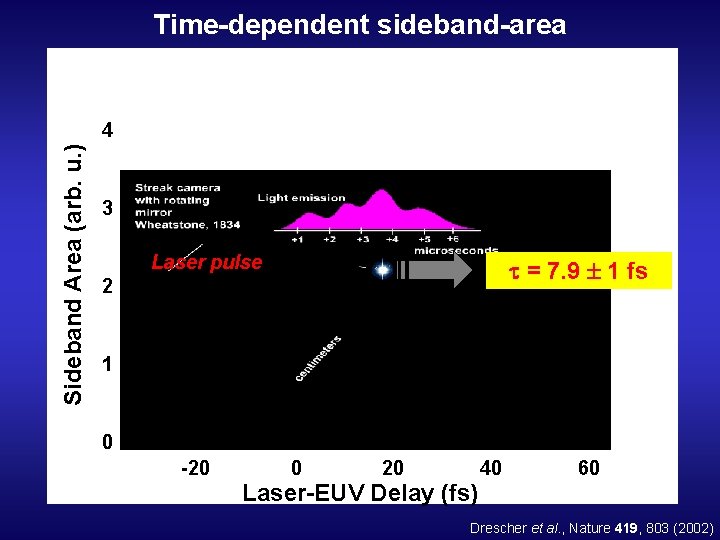
Time-dependent sideband-area Sideband Area (arb. u. ) 4 3 Laser pulse = 7. 9 1 fs 2 1 0 -20 0 20 Laser-EUV Delay (fs) 40 60 Drescher et al. , Nature 419, 803 (2002)
Problem with time delay: At SPPS / LCLS: No intrinsic time lock laser – x-rays i. e. ‘jitter’ → single shot measurement
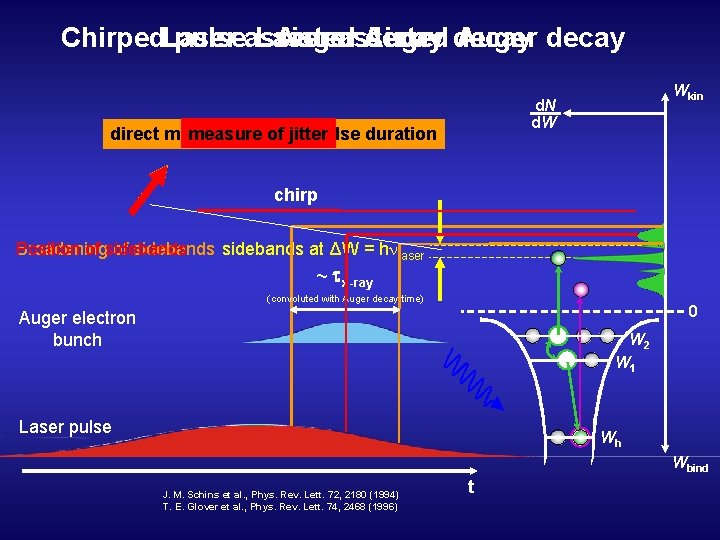
Chirped. Laser pulseassisted Laser Auger assisted Auger decay Wkin d. N d. W measure of jitter direct measure of x-ray pulse duration chirp Broadening of sidebands at ΔW = h laser Position of sidebands ~ x-ray (convoluted with Auger decay time) 0 Auger electron bunch W 2 W 1 Laser pulse Wh Wbind J. M. Schins et al. , Phys. Rev. Lett. 72, 2180 (1994) T. E. Glover et al. , Phys. Rev. Lett. 74, 2468 (1996) t
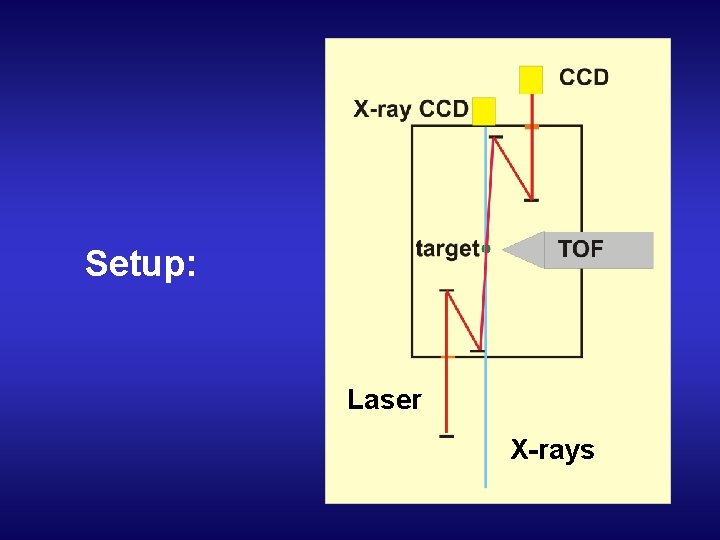
Setup: Laser X-rays
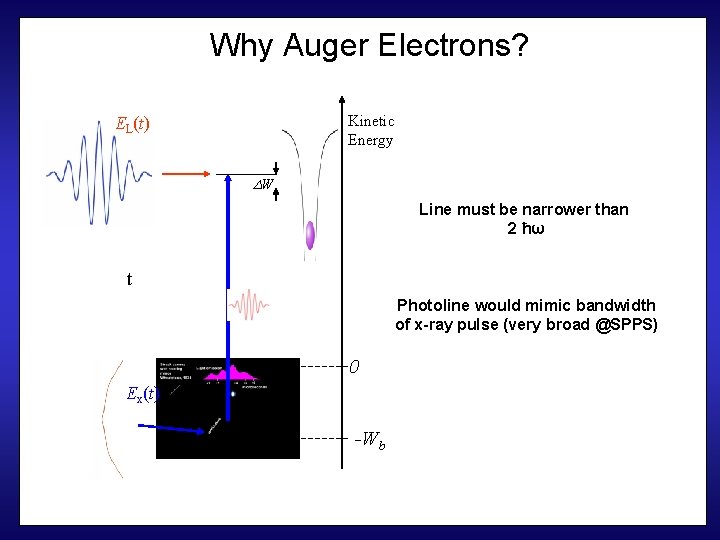
Why Auger Electrons? Kinetic Energy EL(t) W Line must be narrower than 2 ħω t Photoline would mimic bandwidth of x-ray pulse (very broad @SPPS) 0 Ex(t) -Wb
Problems to be solved • Small cross-section of inner electrons (@10 ke. V) • ‘Low’ flux at SPPS → LCLS • Detection of KLL Augers - high Energy TOF… The End
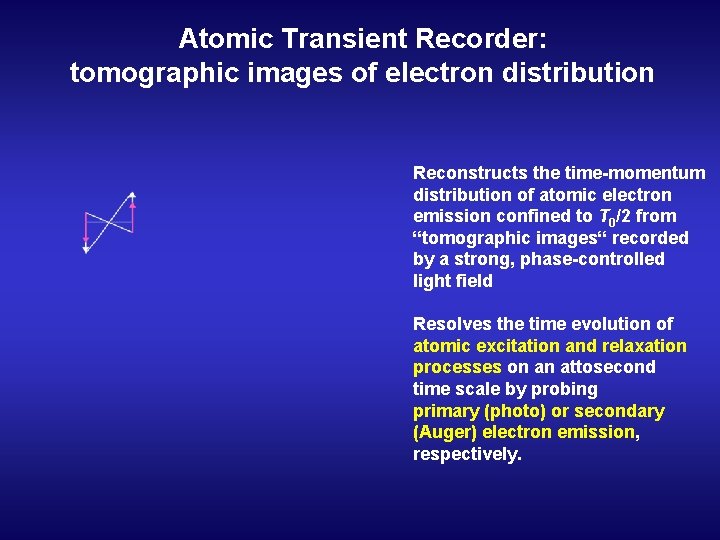
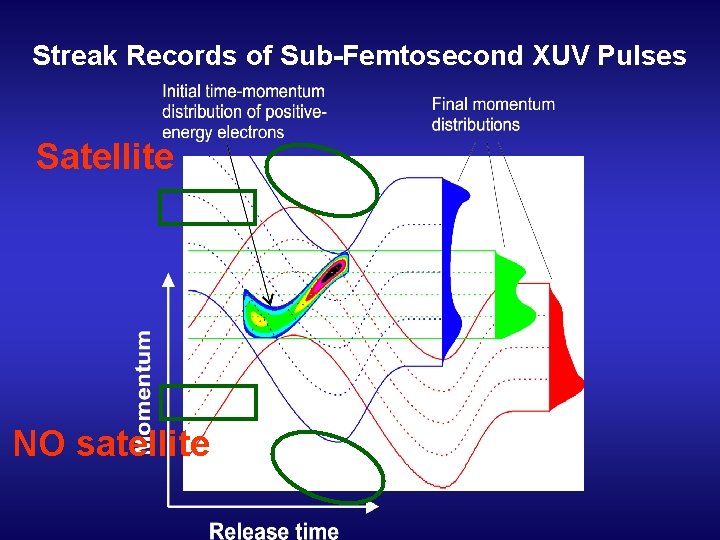
Atomic Transient Recorder: tomographic images of electron distribution Reconstructs the time-momentum distribution of atomic electron emission confined to T 0/2 from “tomographic images“ recorded by a strong, phase-controlled light field Resolves the time evolution of atomic excitation and relaxation processes on an attosecond time scale by probing primary (photo) or secondary (Auger) electron emission, respectively.
Electric Field Scan Kienberger et al. , Science 297, 1444 (2002)
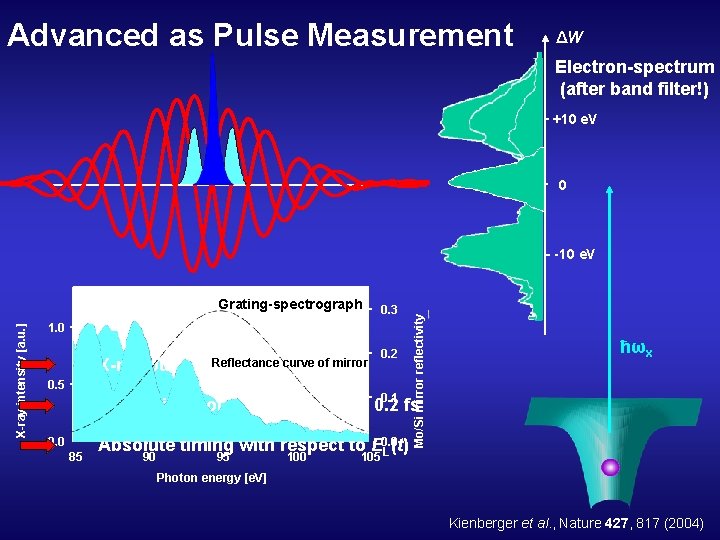
Advanced as Pulse Measurement ΔW Electron-spectrum (after band filter!) +10 e. V 0 X-ray intensity [a. u. ] Grating-spectrograph 0. 3 1. 0 X-ray pulse x Reflectance curve of mirror duration, < 0. 5 fs 0. 5 0. 2 0. 1 Mo/Si mirror reflectivity -10 e. V ħωx Timing jitter of X-ray pulse: t < 0. 2 fs 0. 0 85 Absolute timing with respect to E 0. 0 L(t) 90 95 100 105 Photon energy [e. V] Kienberger et al. , Nature 427, 817 (2004)
Streak Records of Sub-Femtosecond XUV Pulses Satellite NO satellite
- Slides: 38