Feedback Control Systems FCS Lecture24 Nichols Chart Dr
 Lecture-24 Nichol’s Chart Dr. Imtiaz Hussain email: imtiaz. hussain@faculty. muet.")
Feedback Control Systems (FCS) Lecture-24 Nichol’s Chart Dr. Imtiaz Hussain email: imtiaz. hussain@faculty. muet. edu. pk URL : http: //imtiazhussainkalwar. weebly. com/
 • Another approach to graphically portraying the frequency-response")
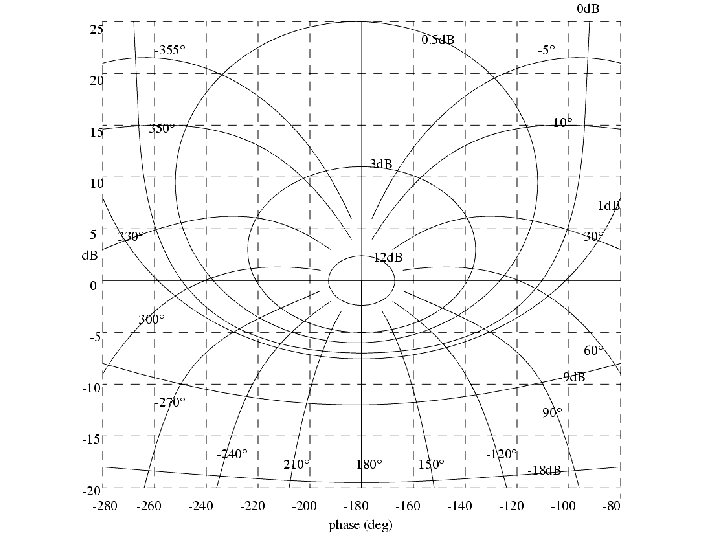
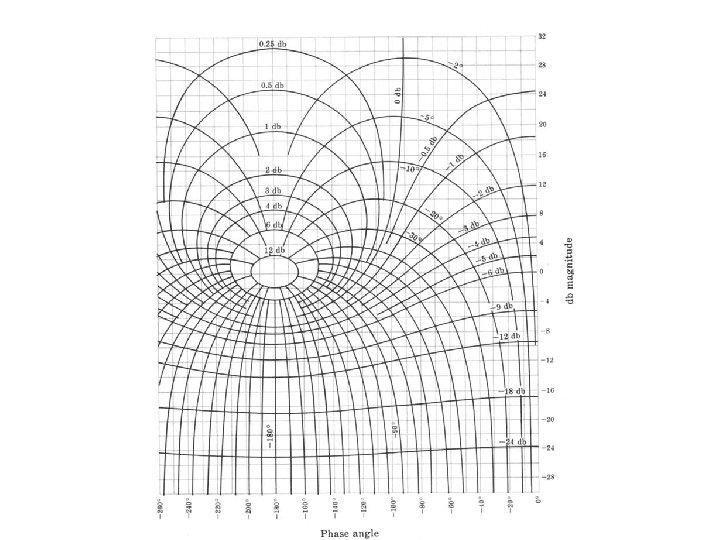
Nichol’s Chart (Log-magnitude vs Phase Plot) • Another approach to graphically portraying the frequency-response characteristics is to use the log-magnitude-versus-phase plot. • Which is a plot of the logarithmic magnitude in decibels versus the phase angle for a frequency range of interest. • In the manual approach the log-magnitude-versus-phase plot can easily be constructed by reading values of the log magnitude and phase angle from the Bode diagram. • Advantages of the log-magnitude-versus-phase plot are that the relative stability of the closed-loop system can be determined quickly and that compensation can be worked out easily.

Nichol’s Chart of simple transfer functions ω db φ 0 ∞ -90 o 0. 5 6 -90 o 1 0 -90 o 2 -6 -90 o ∞ -∞ -90 o

Nichol’s Chart of simple transfer functions

Nichol’s Chart of simple transfer functions

Relative Stability

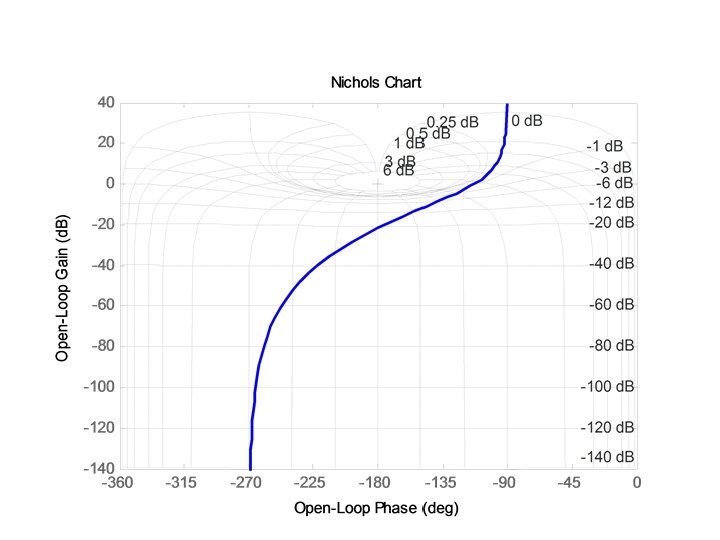
Example#1 • Draw the Nichol’s Chart of following open loop transfer function and obtain the Gain Margin and Phase Margin. Solution

Example#1 ω 0. 01 30 -90 o 0. 1 10. 3 -97. 5 o 0. 5 -4. 4 -125 o 1 -14 -153 o 2 -22 -180 o 10 -26 -189 o

Example#1

ω 0. 01 30 -90 o 0. 1 10. 3 -97. 5 o 0. 5 -4. 4 -125 o 1 -14 -153 o 2 -22 -180 o 10 -26 -189 o

Phase Margin=700 Gain Margin=22 db Phase Cross over point Gain Cross over point

To download this lecture visit http: //imtiazhussainkalwar. weebly. com/ END OF LECTURE-24
- Slides: 15