Features of ANOVA n ANOVA enables us to


Features of ANOVA n ANOVA enables us to test for the significance of differences among more than two sample means. n To use ANOVA we must assume that each of the samples is drawn from a normal population and that each of these populations has the same variance, 2. n ANOVA is based on a comparison of two different estimates of the variance, 2, of our overall population.

Formula 1 n

Formula 2 n

Formula 3 n

Illustration The training director of a company is trying to evaluate three different methods of training new employees. The training director chooses 16 new employees assigned at random to three training methods and records their daily production after they complete the programs: Method 1 15 18 19 22 11 Method 2 22 27 18 21 17 Method 3 18 24 19 16 22 15 The director wonders if there are differences in effectiveness among the methods. Can you help him decide at a 5% significance level?

Step 1: Set up the Hypothesis H 0: µ 1 = µ 2 = µ 3 (The three samples are drawn from populations having the same mean, µ) H 1: µ 1 µ 2 µ 3 (The three samples are not drawn from populations having the same mean, µ)

Step 2: Calculate the means Method 1 Method 2 Method 3 15 22 18 18 27 24 19 18 19 22 21 16 11 17 22 15 Total 85 105 114 n 5 5 6 17 21 19 304/16 = 19

Step 3: Estimate the Between-column Variance n 5 17 19 -2 4 20 5 21 19 2 4 20 6 19 19 0 0 0 Total 40

Step 4 a: Estimate Sample Variances For Method 1 x 15 -2 4 18 1 1 19 2 4 22 5 25 11 -6 36 Total 70

Step 4 a Continued… For Method 2 x 22 1 1 27 6 36 18 -3 9 21 0 0 17 -4 16 Total 62

Step 4 a Continued… For Method 3 x 18 -1 1 24 5 25 19 0 0 16 -3 9 22 3 9 15 -4 16 Total 60

Step 4 b: Find the Combined Variance sj Sj 2 C 1 nj – 1 n. T – k C 2 C 3 s 1 17. 5 4 13 5. 385 s 2 15. 5 4 13 4. 769 s 3 12 5 13 4. 615 Within Column Variance, w 2 (C 2 / C 3) x C 1 14. 769

Step 5: Compute the F Statistic n
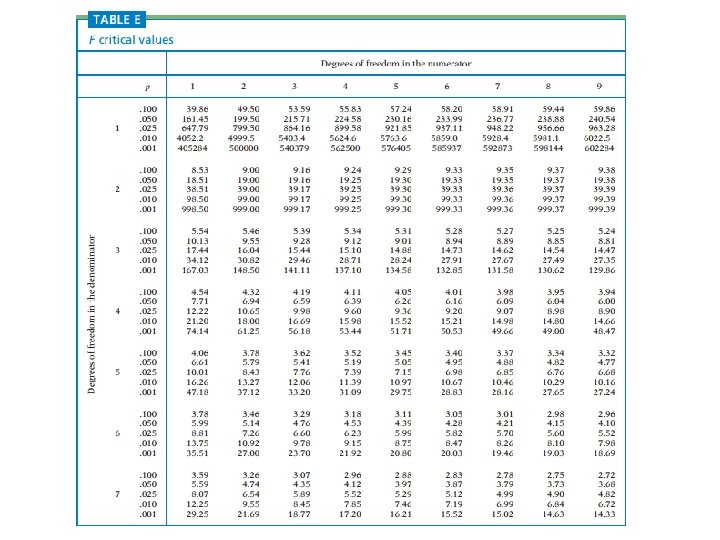

Step 6: Find the F Value Numerator degrees of freedom = k – 1 =3– 1=2 Denominator degrees of freedom = n. T – k = 16 – 3 = 13 n n n Significance level = 5% In the F distribution table, find the value for 13 denominator degrees of freedom, corresponding to 2 numerator degrees of freedom at 0. 05 significance level (Separate tables exist for each level of significance) We get 3. 81

Step 7: Test the Hypothesis Critical Region: F > 3. 81 Observed value of F = 1. 354 Rejection Region Sample F Value of 1. 354 +3. 81 1. 354 < 3. 81 The observed value falls inside the Acceptance region. Hence we accept H 0 and conclude that The three samples are drawn from populations having the same mean

Practice Problem 1 The following data show the number of claims processed per day for a group of four insurance company employees observed for a number of days. Test the hypothesis that the employees’ mean claims per day are all the same. Use the 0. 05 level of significance Employee 1 15 17 14 12 Employee 2 12 10 13 17 Employee 3 11 14 13 15 12 Employee 4 13 12 12 14 10 9

Practice Problem 2 A research company has designed three different systems to cleanup oil spills. The following table contains the results, measured by how much surface area (in sq. meters) is cleared in 1 hour. The data were found by testing each method in several trials. Are three systems equally effective? Use the 0. 05 level of significance. System A 55 60 63 56 59 System B 57 53 64 49 62 System C 66 52 61 57 55

Time to roll your Head!!! Ha ha ha!!! Get psyched!!! All the best!!!

www. leninonline. wordpress. co m
- Slides: 21