FEASIBILITY STUDY FOR PRECAST CONCRETE FACTORY Group Members

FEASIBILITY STUDY FOR PRECAST CONCRETE FACTORY Group Members : Ashraf Al Amleh Dalal Nabulsi Jehad Hasiba Lama Emad Wala' Bostami Supervised by: Eng. Suleiman Daifi

Outline �Introduction �Problem Statement �Market Study �Technical Study �Financial Analysis �Conclusion & Recommendations �Questions

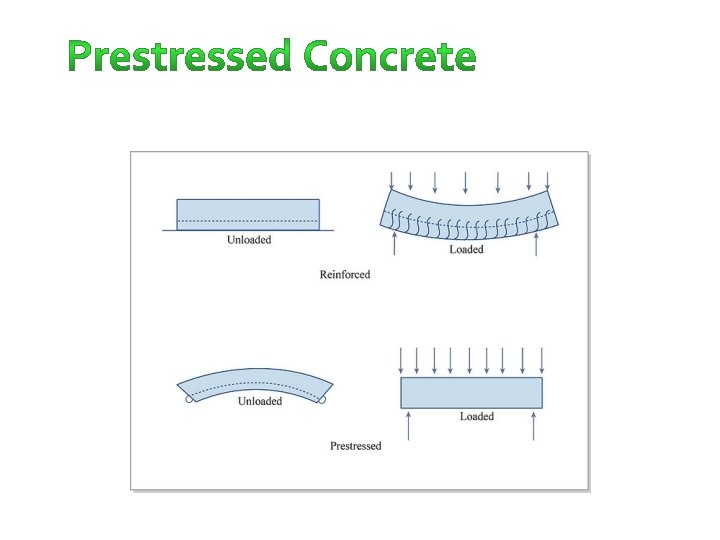
Introduction Concrete is one of the main materials used in the construction of most buildings in the world. There are two methods for producing concrete: � In site concrete. � Precast concrete.

� � � � Quality Durability Speed of construction Design flexibility Can be cut to suit High margins of design safety Reduces noise from building sites

Features : 1 - Light Weight 2 -Large spans 3 -Material savings 4 -Hold heavy loads 5 -Sound insulation

Features: 1 -High level of insulation 2 -Complex shapes 3 -less finishing process 4 - Speed in construction

�The idea of the project comes from the attributes that is characterized by precast concrete compared with in place concrete. �Widespread use of precast concrete around the world and not used in Palestine. �This project deals with undertake a feasibility study, with all of its components.

Market Study Technical Study Financial Analysis Feasibility Study

Market Study estimates the demand of precast concrete products, and the market share of new products. Market Study methodology to estimate the demand on precast concrete products: q q Interviews Questionnaires

Interviews � We made Conservation contractors in order to : To observe the opinion about precast concrete To take a general view about the engineers ability to accept this type of factory 3. To know the advantages of precast concrete 1. 2.

Interviews Results q Many contractors confirm the necessity of establishing a Precast Concrete q There is an appetite for this type of products, and that enhances us to continue the feasibility q Precast concert have many benefits to the society and also for customers q Most preferred area were in Ramallah as the percentage of construction is increasing there quickly

Questionnaire Form

Percentage of expected areas on precast concrete with respect to the total consumption size Demand percentage from 2 nd to 4 th from 5 th to 8 th year Demand percentage from 9 th to 10 th year Type Demand percentage according to the 1 st year Floors %13. 27 %21. 10 %30. 85 %41. 16 Walls %14. 86 %23. 34 %32. 87 %43. 66 Bases %3. 12 %4. 58 %7. 37 %10. 48 Columns %4. 14 %7. 05 %10. 45 %12. 98 Fences %16. 34 %24. 97 %34. 68 %43. 97

Questionnaire Results • Noticeable acceptance of this product is shown if it is established here in Palestine. • Preferable products to be produced were walls and floors • Expected demand on precast concrete products with respect to the total consumption size

Total Expected Demand

Market Share 30% market share of the demand Year 2015 2016 2017 2018 2019 2020 2021 2022 2023 2024 Floors 76272. 96 162243. 8 111254. 9 96839. 25 140141. 7 167501. 2 211410. 6 292672. 6 439458. 6 453496. 3 Fences 35964. 42 69389. 11 46299. 03 50279. 17 50422. 1 55520. 73 73912. 55 108255. 6 161193. 2 168546. 9 Walls 1115785 1752518 2468092 3278275

Technical Study should include the following: 1. 2. 3. 4. 5. 6. Floors Production Walls Production Plant Layout Gantt Chart Establishment Cost Operational Cost

Floors Production Steps Prestressing Casting Concrete transporting Bed Preparation Cutting Storing

Gantt Chart

Walls Production

Administrative Building

Organizational Structure Administration Production &Manufacturing Sales & Marketing Quality Department CRM Maintenance Production management Inventory management Sales Finance & Accounting Procurement Accounting HR Transportation & Movement unit HR Company car driver Forklift driver marketing IT CAT driver

Plant Layout Storage area Parking Production lines Administrative building Batching and mixing
 Item Land space")
Establishment Cost $ 5, 185, 953. 42 Item Cost( $ ) Item Land space required 260, 526. 316 Equipment Precast concrete plant 1, 712, 231. 76 145, 322. 45 Forklift Batching and Mixing Plant factory licenses Water network for the administrative buildings Electricity tel. & internet admin. Building construction admin. Furniture Fences Hangers control lab. Guard room 5, 000 868. 42 1, 200 276. 315 217, 105. 63 20, 000 15, 000 1, 252, 800 10, 000 5, 862 CAT Company car Cameras Fire fighting system Gates Inside factory water network Inside Factory Electricity network Working capital Reserve for emergencies and unforeseen costs Cost ( $ ) 2, 895 80, 000 100, 000 48, 000 3, 263. 15 10, 000 7, 000 3, 000 10, 000 775, 602. 38 518595. 3

Operational Cost • • • � The annual operating cost of the factory is estimated by $ 8, 002, 013

Total Salaries Production & Manufacturing # of employees = 55 Sales & marketing Finance and accounting The total yearly salaries $ 332, 968. 38/yr Human Recourses Transportation & movement

Production Capacity of The Precast Concrete Products Walls Production Capacity = 900 m 2 80% for Interior Walls (720 m 2) 20% for exterior walls (180 m 2) production capacity of HC-slab 570 m 2/day.

Cost of Materials Used to Produce Walls Direct Material for Exterior Walls ( 180 m 2) Direct material Quantity (kg/m 3) Quantity (kg/m 2) Material cost ($/kg) Material cost ($/m 2) Cement 360 1145 72 229 0. 13157 0. 6842 9. 473684211 1. 566842105 160 630 32 126 0. 00289 0. 017 0. 092631579 2. 155263158 . 7631 13. 26575699 Coarse aggregate Water Fine aggregate (Sand) Steels 86. 9135802 17. 382716 5 05 D. M. C for 1 m 2 26. 55417804 Monthly D. M. C 114, 714. 0491 Yearly D. M. C 1, 376, 568. 6

Cost of Materials Used to Produce Walls Direct Material for Interior walls ( 720 m 2 ) Direct material Cement Coarse aggregate Water Fine aggregate (Sand) Steels Quantity (kg/ m 3) m 2) Material cost ($/kg) Material cost ($/m 2) 360 1145 72 229 0. 13157 0. 6842 9. 473684211 1. 566842105 160 630 32 126 0. 00289 0. 017 0. 092631579 2. 155263158 . 7631 2. 411955815 15. 8024691 3. 16049382 4 7 D. M. C for 1 m 2 15. 70037687 Monthly D. M. C 271, 302. 5123 Yearly D. M. C 3, 255, 630. 142

Steel Usage for Walls for 1 m length the weight of steel = (D 2/162) Cost of 1 m 2 = weight * # of bars * Price 8 mm diameter interior $ 2. 41 exterior $ 13. 26 12 mm diameter

Cost of Materials Used to Produce HC-slab D =14. 52 cm 20 cm 1. 2 m Direct material Quantity (kg/m 2) Material cost (NIS/kg) Material cost ($/1. 2 m 2) Cement 9. 36 247. 6 2573. 16 4. 25 3. 16 0. 131 0. 68 0. 00289 0. 017. 7631 1. 23 1. 69 7. 44 0. 072 2. 41 12. 85 15. 43 211, 108. 3 2, 533, 300. 7 Coarse aggregate Water Fine aggregate (Sand) Cables Total D. M. C for (1 m 2) Total D. M. C for(1. 2 m 2) Monthly cost for 1. 2 m 2 Yearly cost for 1. 2 m 2

Electricity of the factory include �Administrative building electricity = $3, 092/yr �Batching & mixing electricity �HC-slab electricity �Walls electricity

Machines Electricity =84. 2 kw 1 kw =. 68 NIS $15. 067/hr Batching & Mixing 1/3 Floors 2/3 Walls

Total electricity cost for hollow core slab/hr = 22. 913 + 0. 33 * 15. 067 = $ 27. 93 �Yearly cost = $ 64, 364. 3136/yr # Machine Electricity (kw) Electricity ($)/hr 1 Electric skip for HC-slab production Stressing abutment p 7 -300 Maturity control e 9 -8 mc Casting module extruder s 5 -1200 e Saw preparer s 5 -400 p Lifting clamps p 7 -4 1. 1 0. 197 0. 196 5. 5 5 0. 38 116 0. 066 0. 984 0. 895 0. 068 20. 758 0. 0118 0. 984 0. 894 0. 068 20. 757 0. 0118 22. 9 2 3 4 5 6 Total cost

Total electricity cost walls = $101, 113/year Total electricity cost = 4. 56 + 0. 66 * 15. 067= $ 14. 6/hr # 1 2 3 Machine Electricity(kw) Pulling device for 5. 5 transfer wagon Multifunction 15 wagon s 5 -26 Maturity control e 95 8 mc Total 25. 5 Electricity ($)/day 0. 98 2. 68 0. 894 4. 56

Depreciation for Production Lines �HC-slab Depreciation = $44, 361/yr �Walls Depreciation = $ 48, 515/yr
 Depreciation/year Dep. /month 40")
Depreciation of other items Admin. Building construction Expected life Cost($) Depreciation/year Dep. /month 40 yr 217105. 6 5427. 6 452. 3 Expected life 40 yr Cost($) 217105. 6 Depreciation/year 5427. 64075 Dep. /month 452. 3 Admin. Building construction Admin. Furniture Fences Hangers control lab. Guard room Equipment Forklift CAT 10 yr 20000 2000 10 yr 20 20 20 40 5 20 20 yr with S. V $20000 15000 1252800 10000 5862 2895 80000 100000 2000 750 62640 500 146. 55 579 4000 166. 66 62. 5 5220 41. 66 12. 2125 48. 25 333. 33 Company car 10 yr 48000 3010. 3488 250. 368 10 20 3263. 15 7000 326. 315 350 88, 729. 85 27. 19 29. 16 7393. 66 Cameras Gates Total cost 166. 66
 Expected car life(km) salvage value ($)")
Company Car Depreciation Calculations Item Value Car price($) Expected car life(km) salvage value ($) Expected car life(yr) Distance(km)/yr Rate 3, 482 500, 000 13, 158 10 43, 200 0. 0864 Year 0 Market Value 34842 Usage Percent 0 Dep. Value /yr 0 Dep. /month 0 1 31831 0. 0864 3010. 3 250. 8 2 29081 0. 0864 2750. 2 229 3 4 5 6 7 8 9 10 26568 24273 22176 20260 18509 16910 15449 13158 0. 0864 0. 0864 2512. 6 2295. 5 2097. 2 1916 1750. 4 1599. 2 1461 1334. 8/yr 209 191. 2 174. 7 159. 6 145. 8 133. 2 121. 7 111. 2
 332968 2 Material for walls")
Operational Cost Summery # 1 Item Total salaries Cost($) 332968 2 Material for walls 4632198 3 Materials for HC-slab 2533300 4 Electricity for administrative building 3092 5 Electricity for HC-slab 64364 6 Electricity for walls 101113 7 Deprecation (walls) Depreciation (HC-slab) 48515 44361 8 Depreciation of other items 85970 9 Water consumption (administrative building) Other operational costs 3157 152, 968 Total costs 8, 002, 013 10

Reveals the project's ability to generate income to cover its financial obligations. Financial Study includes the following : � Pay Back Period � Net Present Value-NPV � Break-Even Point � National profitability of the project � Sensitivity Analysis � Risk Analysis
 Over Head($) variable cost per unit ($)")
HCS Interior walls Exterior walls Fixed Cost($) Over Head($) variable cost per unit ($) 13. 7 16. 3 27 34910 8216. 8 Cost for each unit in $ =Total variable cost+(( Fixed + Overhead) /31920) Product Type Cost/Unit ($) HCS 15 Interior walls 17 Exterior walls 28

Price of the Factory Products HCS = $ 17. 9 Interior walls =$ 21 Exterior Walls = $ 34

i = 5% Net Present Value = $ 15, 743, 225 The Rate Of Return = 34. 44% Pay Back Period = 3. 1 year

Where : Overhead + Fixed Cost = P 1 X 1+ P 2 X 2 + P 3 X 3 � X 1 : # of hollow core slab items � X 2 : # of interior walls items � X 3 : # of exterior walls items By solving the equations we get :

X 1 = 4110 X 2 = 6231 X 3 = 1577 With 0. 05 scrap rate Break Even Point For HC-S = 4110*(1+. 05) = 4316 Exterior walls = 6231*(1+. 05) = 6542 Interior walls = 1577*(1+. 05) = 1656

� Steel price is increasing 25% of its value � Cement price is increasing by 10% of its original value � 70% of plant full capacity is used i = 5% • Net Present Value = $ 6408966 • Rate Of Return = 18. 18 % • Pay Back Period = 6. 22 years Break Even Point = Hollow core slabs = 4316 Interior walls = 6542 Exterior walls =1656

By using excel we used Random Between function and doing 1000 iteration to compute NPV for the expected life of the project then we estimated the average NPV=15, 049, 866 , and standard deviation = 339, 101

95% confidence that the NPV is more than 114502825
 + Bleaching cost($8) For")
Cost Fresh concrete Precast concrete For solid slabs ($65 -$70) + Bleaching cost($8) For HC-slabs $21 +installation cost($3)+ transportation cost ($10) T. C = $75 T. C=$34 For exterior walls $60 + bleaching cost ($8) For exterior walls $40+$3+$10 T. C= $68 T. C=$53 For interior walls(concrete) $35+bleaching cost ($15) For interior walls T. C = $18+$3+$10 T. C=$50 T. C =$31 If bricks T. C=$17+$15 T. C=$32 Time needed to build floor of 500 m 2 Exterior walls= 2 weeks Interior walls =2 weeks Bleaching = 3 weeks Total = 7 weeks 7 -10 days

�From the results of Market study, Technical Study and Financial analysis results we can see that the project is Feasible

• Refusal of the Israeli national electricity company to provide the needed electricity • Finding suitable land with 12 donum area, with a suitable location • Using suitable Crain for precast products • The stability of the political and economic situation, in order to increase the demand on precast products.

Production Line Recommendations : � Use material economically � Contract with best vendors (quality, logistics and price) � Avoid excess amount of concrete to reduce waste cost � Avoid excess inventory � On time delivery � Reduce defective products (training) � Establish preventive maintenance � Using mobile crane to facilitate the assembly in construction site � Contract with best transportation companies

General Recommendations 1. Starting the implementation of the project after obtaining the necessary licenses from the relevant authorities. 2. Choose suitable land which needs less settling to reduce the cost of preparation 3. Engineering association should spread awareness between people about precast and its advantages comparable to fresh concrete 4. Buying trucks in future to transport precast products since the cost of precast products doesn't include transportation cost and the one who purchase precast products incurred the cost of transportation

- Slides: 55