FAO Training in Crop Yield Forecasting ARMENIA Crop


")


 data to assign weights There are, of course, no general")


 Choose the folder “RESULTS”")


")
")


 TIMESAT")
 TIMESAT")

- Slides: 68
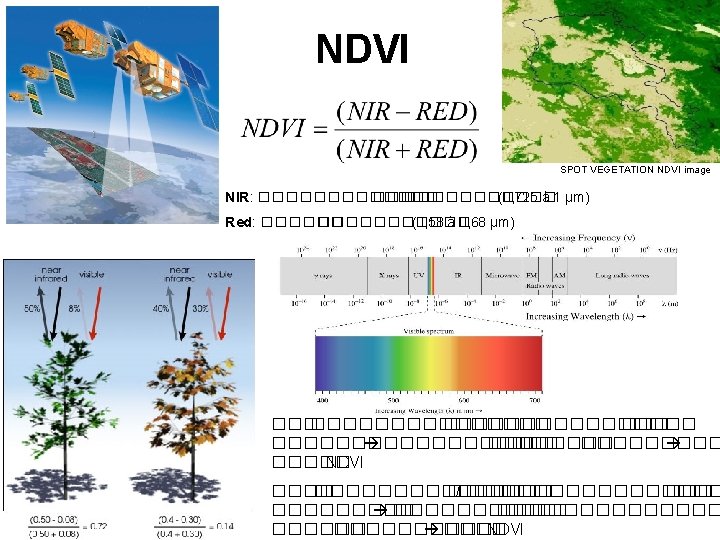
FAO Training in Crop Yield Forecasting ARMENIA Crop Yield Forecasting Methodology Enhancement – Remote sensing Erevan 21 - 25 January 2013 Antoine DENIS Antoine. Denis@ulg. ac. be
Crop Yield Forecasting Methodology – Remote sensing Introduction to the training 1. General reminder of the project and CYFS 2. Objectives of the training 3. Planning of the training
General reminder of the project and CYFS • Agro-meteorological component of the “EC/FAO Programme on Information Systems to Improve Food Security Decisionmaking… ” in Armenia. • Contribute to reduce food insecurity and poverty by improving the quality and sharing of information across institutions, and promoting evidence-based analyses and assessments. • Improve long term agro-meteorological forecasting and the dissemination of information to Marz Support Centres. • Enhance RS sensing approach of the CYFS
Objectives of the training I. TIMESAT software II. METOP NDVI images III. Complementary information for Agromet bulletin
Crop Yield Forecasting Methodology – Remote sensing Planning of the training DAY 1 • Introduction • New (METOP & TIMESAT) • TIMESAT - introduction DAY 2 • TIMESAT – automation and database production • WINDISP (cf. doc Word)
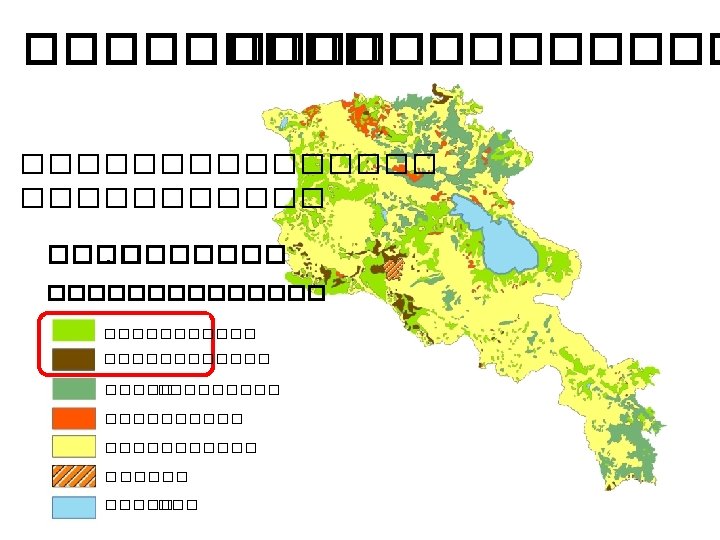
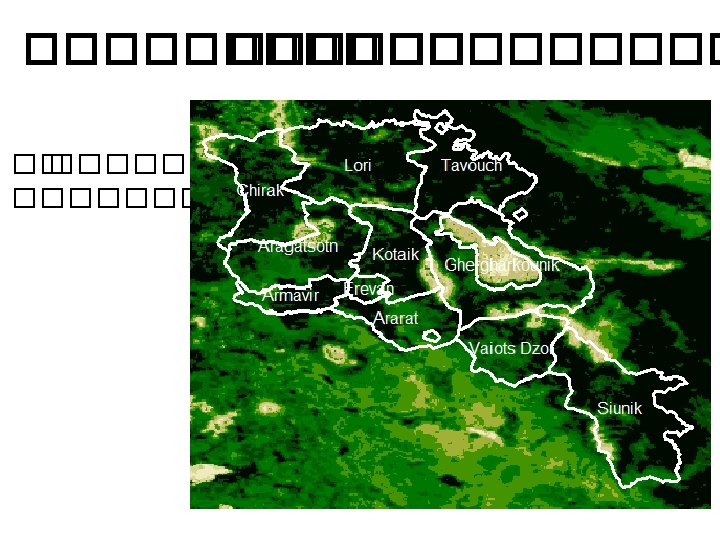
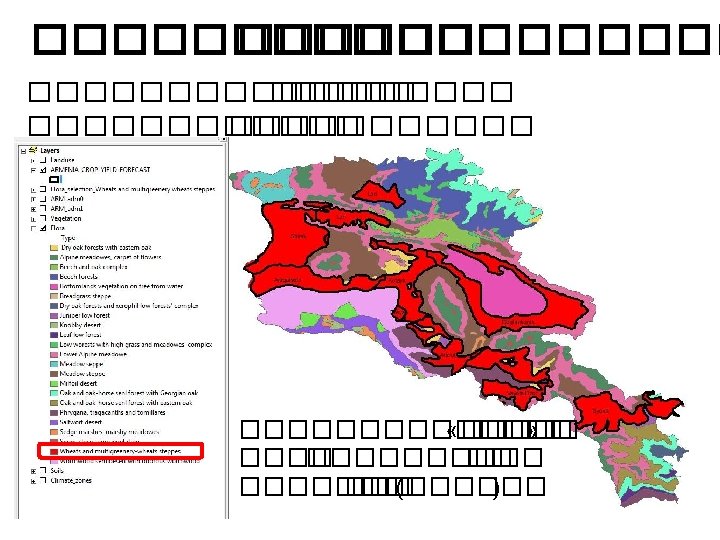
Crop Yield Forecasting Methodology – Remote sensing Planning of the training DAY 3 • CALIBRATION METOP – SPOT VGT • Accumulated NDVI computation • Real time CYFS • Boundaries • Maps and legend DAY 4 • Complementary information for Agromet bulletin • General repetition for database production (cf. doc Word)
Crop Yield Forecasting Methodology – Remote sensing Planning of the training DAY 5 • Questions and answers (cf. doc Word)
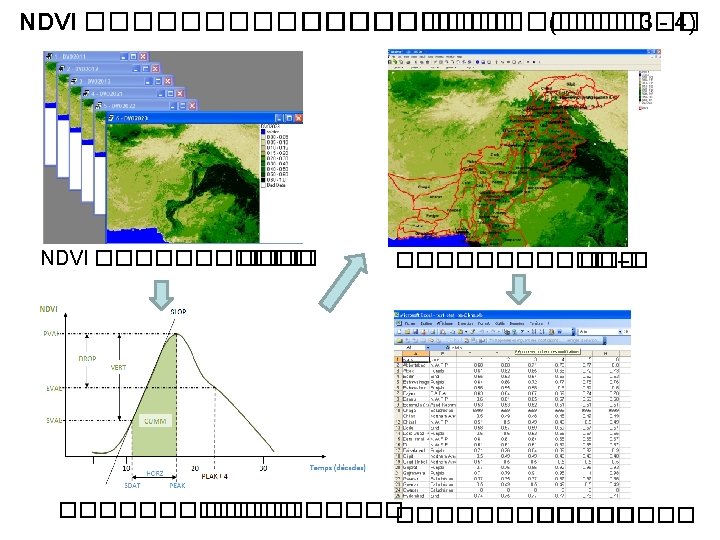
Crop Yield Forecasting Methodology – Remote sensing Content Monday 21 January 2013 1. Introduction to the training 2. General process for NDVI images in CYFS (5 min) 3. Introduction to METOP satellite images (15 min) 4. Preparation of a continuous NDVI images times series with SPOT VEGETATION and METOP images (30 min) 5. TIMESAT – an Introduction (2 h) 6. TIMESAT for extracting NDVI derived explanatory variable for CYFS – (a step by step tutorial) (3 h)
Crop Yield Forecasting Methodology – Remote sensing Content Monday 21 January 2013 1. Introduction to the training 2. General process for NDVI images in CYFS (5 min) 3. Introduction to METOP satellite images (15 min) 4. Preparation of a continuous NDVI images times series with SPOT VEGETATION and METOP images (30 min) 5. TIMESAT – an Introduction (2 h) 6. TIMESAT for extracting NDVI derived explanatory variable for CYFS – (a step by step tutorial) (3 h)
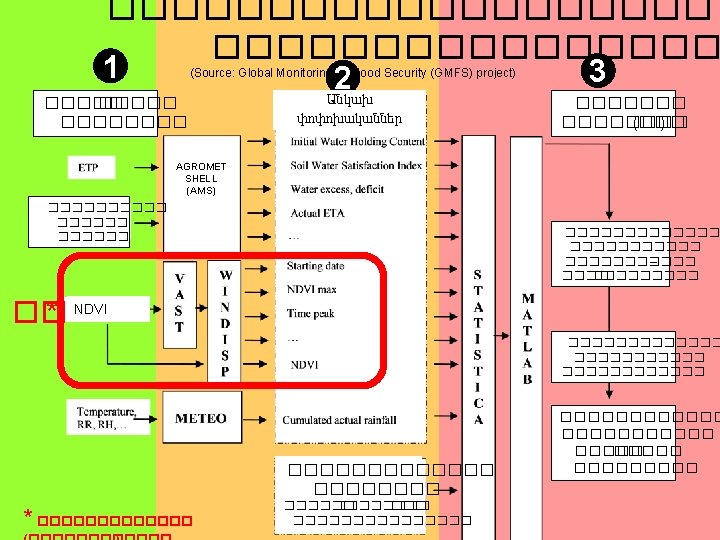
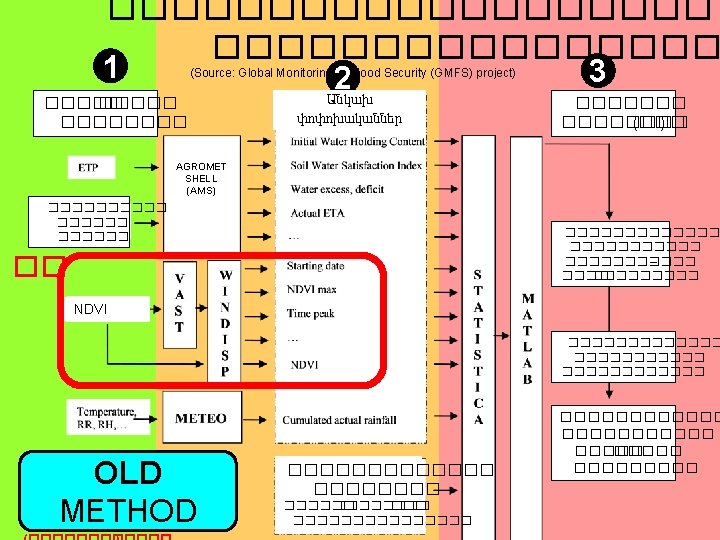
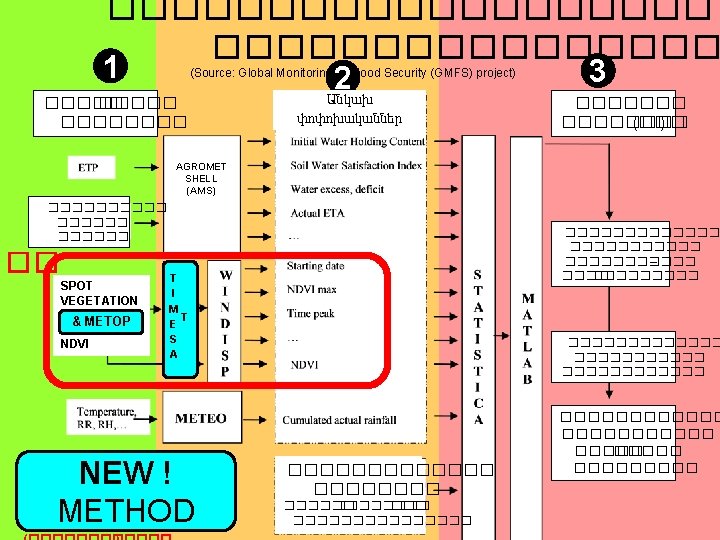
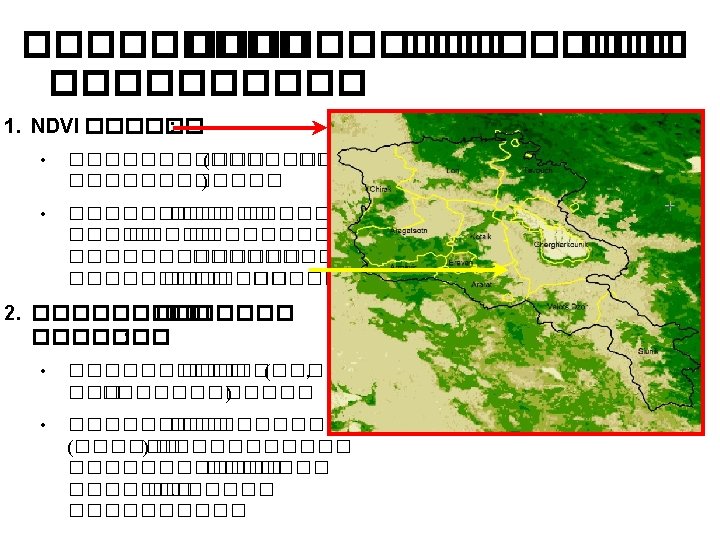
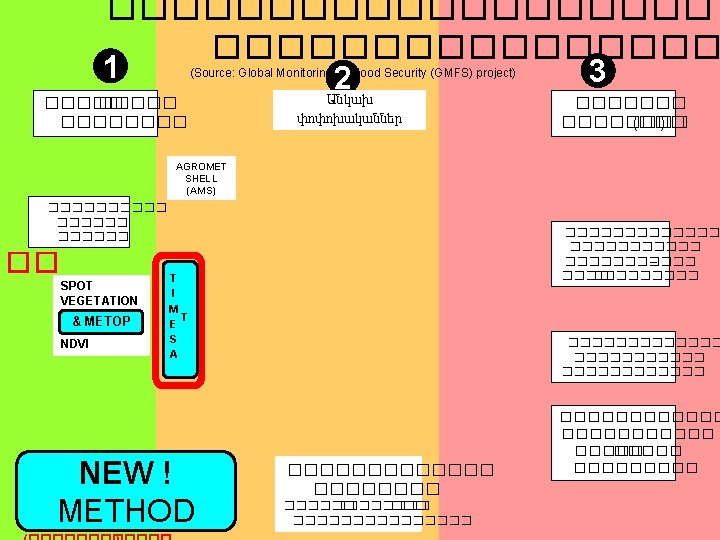
2. General process for NDVI images in CYFS
Crop Yield Forecasting Methodology – Remote sensing Content Monday 21 January 2013 1. Introduction to the training 2. General process for NDVI images in CYFS (5 min) 3. Introduction to METOP satellite images (15 min) 4. Preparation of a continuous NDVI images times series with SPOT VEGETATION and METOP images (30 min) 5. TIMESAT – an Introduction (2 h) 6. TIMESAT for extracting NDVI derived explanatory variable for CYFS – (a step by step tutorial) (3 h)
METOP Why using METOP? Spatial resolution N° images per year Years available Number of complete year available in 2012 SPOT_VGT METOP 1 km 36 36 1999 – 2013 or 2014 2008 - 2022 14 5 Very similar to SPOT VGT
METOP What are METOP images ? & METOP website http: //www. metops 10. vito. be/index. html
METOP How to get METOP images? Ordered at VITO and received by email and FTP delivery
Crop Yield Forecasting Methodology – Remote sensing Content Monday 21 January 2013 1. Introduction to the training 2. General process for NDVI images in CYFS (5 min) 3. Introduction to METOP satellite images (15 min) 4. Preparation of a continuous NDVI images times series with SPOT VEGETATION and METOP images (30 min) 5. TIMESAT – an Introduction (2 h) 6. TIMESAT for extracting NDVI derived explanatory variable for CYFS – (a step by step tutorial) (3 h)
SPOT VEGETATION How to get SPOT VGT images? FREE VGT website (3 months old) & Ordered at ESA for real time and delivered by email and FTP
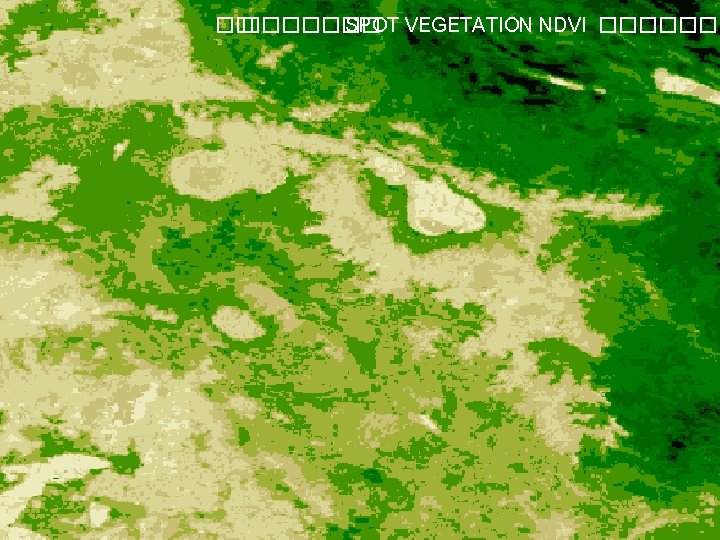
������ SPOT VEGETATION NDVI-������ : http: //free. vgt. vito. be/
������ SPOT VEGETATION NDVI-������ : http: //free. vgt. vito. be/
SPOT VEGETATION NDVI - ������
Preparation of a continuous NDVI images times series with SPOT VEGETATION and METOP images Years available Number of complete year available in 2012 SPOT_VGT METOP 1999 – 2013 or 2014 2008 - 2022 14 5 TIMESAT input format: • BINARY : 2 dimensional spatial arrays • (≠ IDA format of WINDISP & VAST)
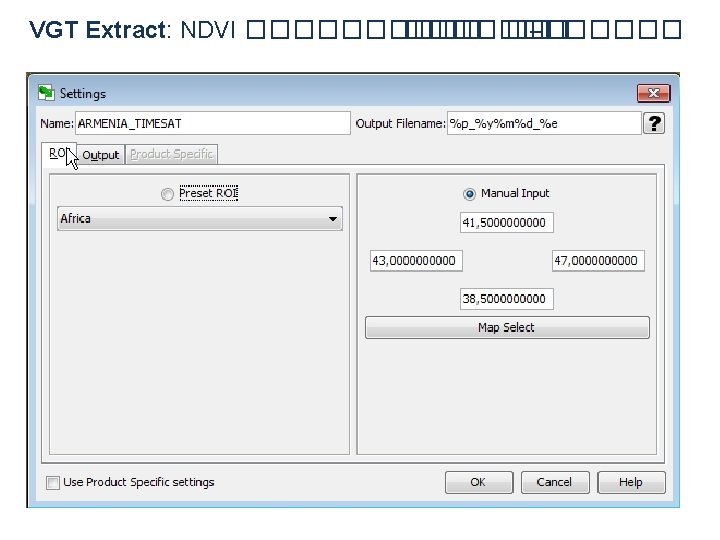
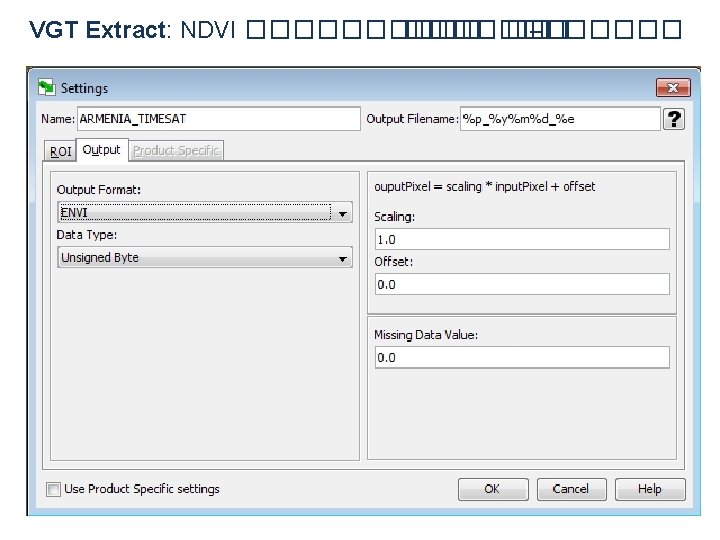
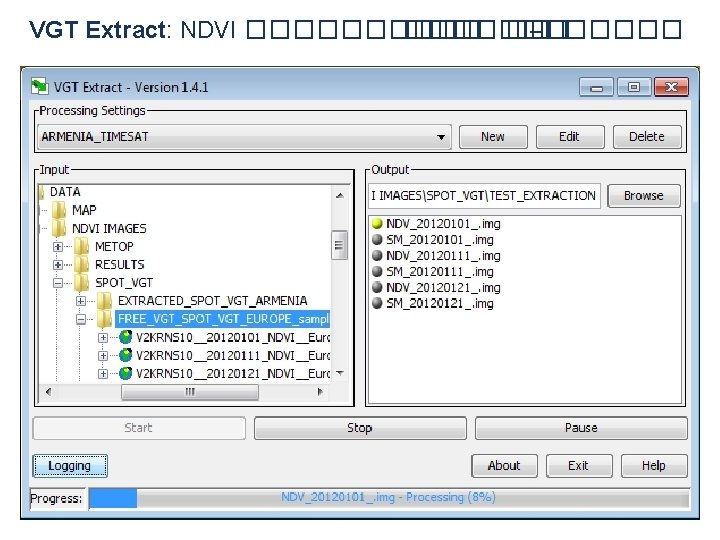
Preparation of a continuous NDVI images times series with SPOT VEGETATION and METOP images SPOT VEGETATION : VGT EXTRACT : ��������� : • ����� NDVI ����� ZIP ���� (extract) • ��������� ��� –� (spatial subset) • ���������� TIMESAT–�� ������� (format convert) �������� : VGT Extract–������� http: //free. vgt. vito. be/ ������
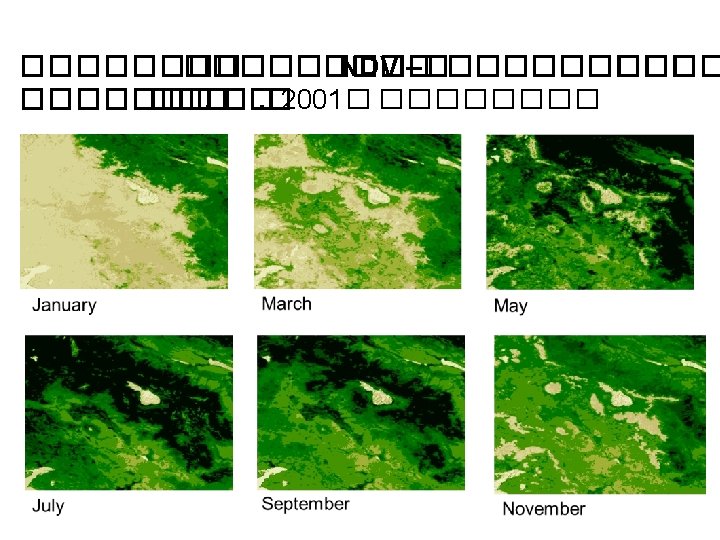
SPOT VEGETATION NDVI - ����
Preparation of a continuous NDVI images times series with SPOT VEGETATION and METOP images METOP extraction: • Unzip the « zip » folder • Delete non desired files (files other than « NDV… » files) • Images are in ENVI standard format (binary file + header), format compatible with TIMESAT
Preparation of a continuous NDVI images times series with SPOT VEGETATION and METOP images METOP header file ENVI description = {METOP-AVHRR, 10 -daily synthesis, 20080401 -20080410, NDVI, processing by VITO-Belgium } samples = 8176 lines = 5600 bands = 1 file type = ENVI Standard data type = 1 sensor type = METOP-AVHRR map info = { Geographic Lat/Lon, 1. 5, -11, 75, 0. 0089285714, WGS-84, units=Degrees }
Crop Yield Forecasting Methodology – Remote sensing Content Monday 21 January 2013 1. Introduction to the training 2. General process for NDVI images in CYFS (5 min) 3. Introduction to METOP satellite images (15 min) 4. Preparation of a continuous NDVI images times series with SPOT VEGETATION and METOP images (30 min) 5. TIMESAT – an Introduction (2 h) 6. TIMESAT for extracting NDVI derived explanatory variable for CYFS – (a step by step tutorial) (3 h)
Smoothing of NDVI evolution curve Phenological parameters derivation http: //www. nateko. lu. se/personal/Lars. Eklundh/TIMESAT/timesat. html.
TIMESAT Website & User’s manual http: //www. nateko. lu. se/personal/Lars. Eklundh/TIMESAT/timesat. html
TIMESAT A program for Analysing Time-Series of Satellite Sensor Data By Jönsson Lars Eklundh
TIMESAT Using time series of binary images files to produce NDVI temporal evolution curve
TIMESAT Using auxiliary (quality) data to assign weights There are, of course, no general rules for converting ancillary data to weights associated with the values in the time series and the user of the TIMESAT program is encouraged to take an experimental approach and test different settings. • Large circles indicate clear conditions (w = 1), • Small circle indicate mixed conditions (w = 0. 5), • No circle indicate clouds (w = 0). From the figure it is seen that several of the negatively biased outliers are associated with cloudy conditions. By assigning zero weight to these values they will not influence the subsequent fitting.
TIMESAT Preprocessing to suppress outliers
TIMESAT Upper envelope adaptation Fitted functions from a multi-step procedure. The thin solid line represent the original NDVI data. (a) The thick line shows the fitted function from the first step. (b) The thick solid line displays the fit from the last step where the weights of the low data values have been decreased.
3 algorithm to smooth the signal TIMESAT 1. Adaptive Savitzky-Golay filtering The filter replaces each data value yi, i = 1, . . . , N by a linear combination of nearby values in a window These values have to minimize a least-squares fit to a polynomial function width, n, of the moving window determines the degree of smoothing, but it also affects the ability to follow a rapid change. In TIMESAT the width n can be set by the user.
TIMESAT Main features of the SPOT VEGETATION and METOP NDVI images database SPOT_VGT METOP 1 km 36 36 1999 – 2013 or 2014 2008 – 2022 14 5 Format 8 -bit Extent Armenia Europe N° of rows 337 5600 N° of columns 449 8176 148 Ko 44. 713 Mo Spatial resolution N° images per year Years available Number of complete year available in 2012 Size
TIMESAT Defining the installation folder
TIMESAT Defining the right working directory (! very important !) Choose the folder “RESULTS”
TIMESAT menu system 1. Data preparation 2. Data processing 3. Post processing
TIMESAT Image file type SPOT VEGETATION METOP 8 -bit unsigned integer Byte order Little endian No of rows in image 337 5600 No of columns 449 8176
Image view TIMESAT
TIMESAT Relative LIST FILE !! Relative compare to the working directory !! !! 3 * the same year !!
TIMESAT FILE NAME convention Type of file Example for the 1999 SPOT_VGT images Example for the 2008 METOP images List file LIST_FILE_1999_SPOT_VGT. txt LIST_FILE_2008_METOP. txt Settings file SETTINGS_1999_SPOT_VGT. set SETTINGS_2008_METOP. set Job name in a settings file 1999_SPOT_VGT 2008_METOP . tts file 1999_SPOT_VGT_fit. tts 2008_METOP_fit. tts . tpa file 1999_SPOT_VGT_TS. tpa 2008_METOP_TS. tpa Fitted (smoothed) NDVI images FITTED_1999_SPOT_VGT FITTED_2008_METOP Season parameter images (e. g. : start) start_1999_SPOT_VGT start_2008_METOP
TSM GUI (e. g. SPOT VGT time series 1999 – 2012)
TSM GUI (e. g. SPOT VGT 3 * 1999 time series)
Settings file TIMESAT
Fileinfo TIMESAT
Fileinfo TIMESAT
TSM_printseasons TIMESAT
TSM_viewfits TIMESAT
TSM_imageview (e. g. : start of the season) TIMESAT
TSM_imageview (e. g. : large integral) TIMESAT
Contact information Antoine DENIS Bernard TYCHON TEL 0032 63 230 997 0032 63 230 829 Email Antoine. Denis@ulg. ac. be Bernard. Tychon@ulg. ac. be Website http: //www. dsge. ulg. ac. be/arlon/ Arlon Campus Environnement (ACE) University of Liège (ULg) 185, Avenue de Longwy, 6700 Arlon Belgium