Fallbeispiel erhhtes CO 2 1 Der CTransfer zwischen

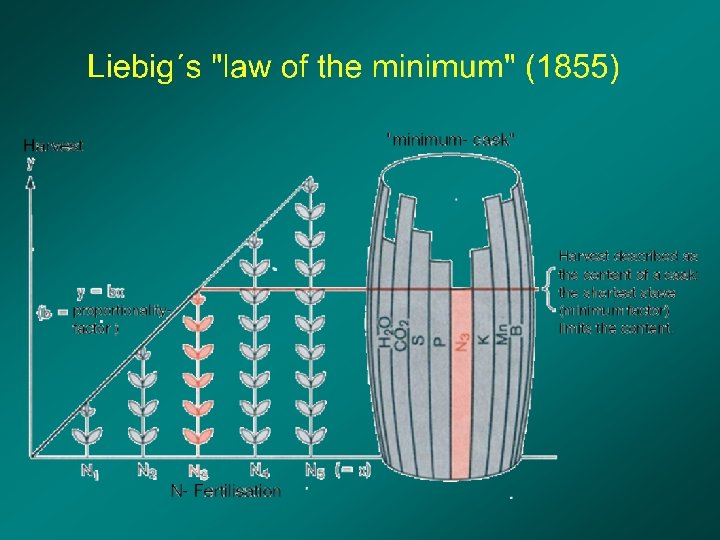
Fallbeispiel erhöhtes CO 2 1. Der C-Transfer zwischen Pflanze und Boden 2. Kurfristige und längerfristige Reaktionen von Pflanzen und Rhizosphäre 3. Unterschiedliche Wirkungstärke von erhöhtem CO 2 auf unterschiedlichen Böden 4. Die Langzeitwirkungen: ein Nährstoffungleichgewicht entsteht Biodiversitäten ändern sich

CO 2 Sink: Free Sugars in Plant and Soil standing crop of grasses on 1 kg soil: an average of 10 -20 g DM Soil Partikels (Carbonates) Soil Respiration glucose and other free sugars in plants: an average of 2 -10 mg g DM -1 free sugars in the standing crop on 1 kg soil: an average of 20 -200 mg Rhizosphere Bulk soil export leaching migration Root Biomass glucose and other free sugars in 1 kg soil: an average 20 to 200 mg transfer rates ?

13 C steady state labelling: Begasungskammer Cross Section Soilcompartment 1 cm Longitudinal Section 9, 25 cm 1, 5 cm 51 cm, 21 cm 30 cm 24, 4 cm 1, 6 cm 12 cm 14, 375 cm 19, 5 cm 7, 5 cm 2 cm 89 cm 10 cm 30 cm 55 cm © Gert Bachmann, Thomas Franz

13 C steady state labelling: the gas circuits © Gert Bachmann, Thomas Franz

Abschätzen von Transferraten durch 13 C labeling ambient: 350 mg. L-1 CO 2 elevated: 750 mg. L-1 CO 2

Von besonderem Interesse: C- Flüsse zwischen den Kompartimenten Sproßraum CO 2 1 Blatt 9, 3 12, 4 Pools ambient Stiel 9, 2 Achse 13, 8 4, 8 7, 1 Pools elevated 2 3 90, 7 87, 6 81, 5 73, 8 ? 4 5, 4 9, 8 CO 2 ? 72, 2 62, 3 5, 4 9, 8 6 22, 4 14, 8 7 ? 22, 4 14, 8 CO 2 76, 7 66, 7 4, 5 4, 4 5 Wurzel 2, 1 / 0, 8 Knöll. Rhizosphäre 8 CO 2 100 Bodenkammer Flüsse ambient 42, 6 38, 8 Boden Flüsse elevated

Hypothese: Pflanzen nehmen Kohlenstoff fakultativ auch aus dem Boden auf 0 Sproß Wurzel 0 -20 -10 Vollprobe gedüngt -30 -40 d 13 C -10 -20 -30 Leerprobe ungedüngt -40 Vollproben mit 13 C markierter Glucose im Gießwasser gedüngt

Karbonat im Boden kann bei erhöhtem CO 2 ansteigen. after 3 months of cultivation p. H n=5 EB: SE

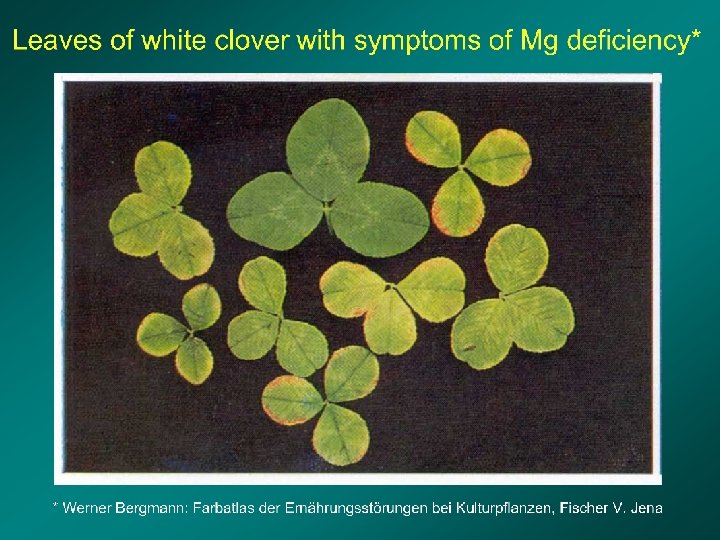
Trifolium r. morphological changes after 6 months elevated CO 2 ambient CO 2

Trifolium r. ambient symptoms of cation deficiency elevated

hypothetical model for Trifolium r. on alkaline soil hv CO 2 N 2 Shoot Root Nod. Bac. POM DOM org. A Fungi KI CO 3 - - ++ Bacteria Fauna KI CO 3 = Mass tranfer = Regulator Urease Aktivity = Producer = Storage = Consumer tot. N

Hypothetical Model for Lolium p. on alkaline Soil hv CO 2 Root POM DOM Fungi Bacteria CO 3 -- Mg++ Fauna Urease Activity Mg. CO 3 N = Mass transfer = Regulator = Producer = Storage = Consumer
 ambient CO 2 of organic acids elevated CO 2 aspartate citrate")
BIOLOG absorbance (TTF) ambient CO 2 of organic acids elevated CO 2 aspartate citrate l-malate a-ketoglutarate f=y 0+a/(1+exp(-(x-x 0)/b)) hours of incubation sugars amino acids
 \"Mofeta Strmec ditch\" 8, 00 7, 00")
SNACE (natural CO 2 wells at Maribor) "Mofeta Strmec ditch" 8, 00 7, 00 6, 00 5, 00 4, 00 3, 00 2, 00 1, 00 0, 00 Agrosol transsect 25, 00 20, 00 15, 00 10, 00 5, 00 Ca_HCl Mg_HCl p. H K_HCl 0, 00 Ditch 4 m. Ditch 1 m Ditch control Ground 15 m high WRC p. H Ditch Ground: 1. 41 % CO 3 -C mg g soil DW-1 1, 60 1, 40 1, 20 1, 00 0, 80 0, 60 0, 40 0, 20 0, 00 5, 90 5, 70 5, 50 5, 30 5, 10 4, 90 Ca_HCl Mg_HCl K_HCl p. H 4, 70 4, 50 Control 5 m 20 m 3 m 1 m 20 cm low WRC mg g soil DW-1
 ICAT-Hauptkomponenten 5, 1 d 13 C 3, 1 BK")
Component 3 (10, 6 %) ICAT-Hauptkomponenten 5, 1 d 13 C 3, 1 BK 1, 1 BE -0, 9 BR ala val glu thr leu Urease Dehydro SIR -4, 7 Glucose Cellulase BNE -2, 9 Trehalose Phosphatas Glycerin Deaminase BNK RNK ser C_ges RK RE RNE -2, 7 -0, 7 1, 3 3, 3 Component 1 (53, 1 %) 5, 3

Soil p. H determines strength of CO 2 Effects 100 80 60 % increase 40 20 0 -20 3 4 5 6 7 8 9 -40 -60 -80 p. H ICAT-Birmensdorf, FACE-Eschikon, SACE-Nenzlingen 1996 -98 %carbonate %C %SIR %DOM %BR %d 13 C %Urease

cation pools and sinks at elevated CO 2 plant biomass air CO 2 H 2 O soil CO 2 3 H 2 CO 3 2 Mg++ Ca++ carbonates Mg. CO 3 Ca. CO 3 1 ground water

energy needed for permanent changes May elevated carbon dioxyde lead to persistent modifications of ecosystems? cation deficient system (acidic) environmental influences: temperature CO 2 rhizodeposition recent ecosystem (neutral p. H) resilience carbonate- adapted ecosystem (alkaline) stability elasticity range of probable systems soil properties: (p. H, water holding capycity)

Schlussfolgerungen: Beurteilung von Kohlenstoff- transferraten erfordert längere Beobachtungszeiträume und Markierungsexperimente Pflanzen können einer CO 2 - induzierten Alkalinisierung von Böden gegensteuern, aber nur für eine beschränkte Zeit Der Effekt von erhöhtem CO 2 auf Vegetationen und Böden hängt großteils von edaphischen Faktoren ab. (WRK, SAS, p. H, KAK) Erhöhtes CO 2 führt langfristig wohl in allen Böden zu einer relativen Kationenmangelsituation.
- Slides: 21