
Fair Pay for Northern California Nonprofits The 2016
- Slides: 32
Fair Pay for Northern California Nonprofits: The 2016 Compensation & Benefits Survey HIGHLIGHTS AND TRENDS May 12, 2016 Sponsored by Compass. Point Nonprofit Services
Do you regularly use compensation surveys as a part of your job?
1. Compensation Surveys Purpose Use 2. Fair Pay for Northern California Nonprofits 2016 Survey Methodology Highlights & Trends 3
Compensation Surveys Purpose: The purpose of a compensation survey is to provide a “snapshot” of the labor market as accurately as possible, so that nonprofit managers can make wellinformed decisions about paying their employees. 4
Compensation Surveys Characteristics of employers that tend to influence pay levels: • 1. Job location • 2. Organizational size • (financial and/or number of employees) • 3. Industry 5
Compensation Surveys Characteristics of employees and jobs that tend to influence pay levels: • 1. Tenure at company and/or in job • 2. Years of related experience • 3. Level of education • 4. Specific credential relevant for job • 5. Supervisory responsibility 6
Compensation Surveys Pay Philosophy: Where does an organization generally want its pay levels to be in comparison to the market? 7
To your knowledge, has your organization developed an overall pay philosophy? If yes, how well do you think the organization practices it? Please choose a rating on a scale of 1 to 5, where 1 is high compliance with the pay philosophy and 5 is low compliance.
Compensation Surveys Use: Employers use compensation survey data to set competitive pay levels for their jobs, often by designing a salary structure that considers both external data (i. e. survey data) and internal job comparisons. 9
Compensation Surveys Considerations for using survey data: • A. Data sources • Location, size, field of source organizations • B. Job matches • How similar are our jobs with jobs from data sources? • C. Effective date of market data • Should we adjust for time elapsed since data was reported? 10
Compensation Surveys Internal job comparisons: The purpose of job assessment is to ensure that pay levels of jobs within departments and across the company are fair in relation to each other. 11
Compensation Surveys Prevent: • Underpaying • Overpaying • Pay Compression 12
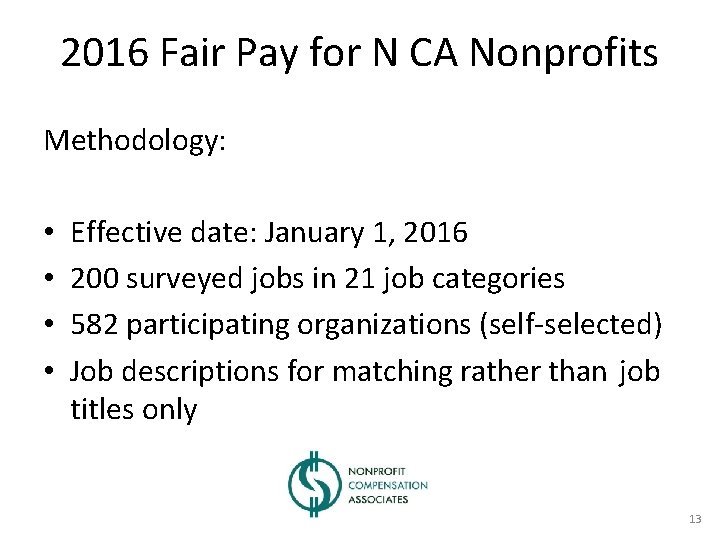
2016 Fair Pay for N CA Nonprofits Methodology: • • Effective date: January 1, 2016 200 surveyed jobs in 21 job categories 582 participating organizations (self-selected) Job descriptions for matching rather than job titles only 13
Are you familiar with Fair Pay for Northern California Nonprofits? If yes, did your organization participate in the recently published 2016 survey?
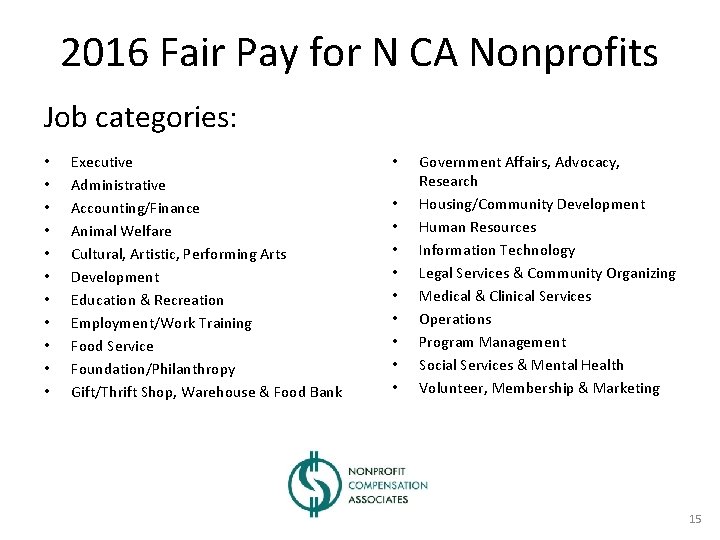
2016 Fair Pay for N CA Nonprofits Job categories: • • • Executive Administrative Accounting/Finance Animal Welfare Cultural, Artistic, Performing Arts Development Education & Recreation Employment/Work Training Food Service Foundation/Philanthropy Gift/Thrift Shop, Warehouse & Food Bank • • • Government Affairs, Advocacy, Research Housing/Community Development Human Resources Information Technology Legal Services & Community Organizing Medical & Clinical Services Operations Program Management Social Services & Mental Health Volunteer, Membership & Marketing 15
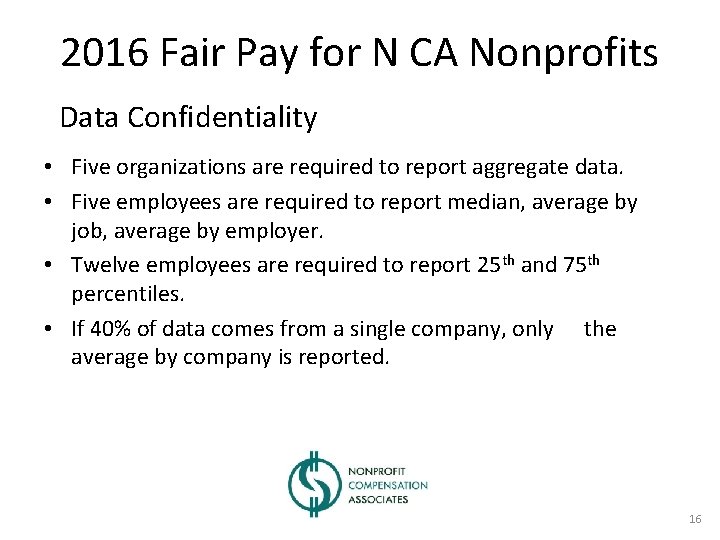
2016 Fair Pay for N CA Nonprofits Data Confidentiality • Five organizations are required to report aggregate data. • Five employees are required to report median, average by job, average by employer. • Twelve employees are required to report 25 th and 75 th percentiles. • If 40% of data comes from a single company, only the average by company is reported. 16
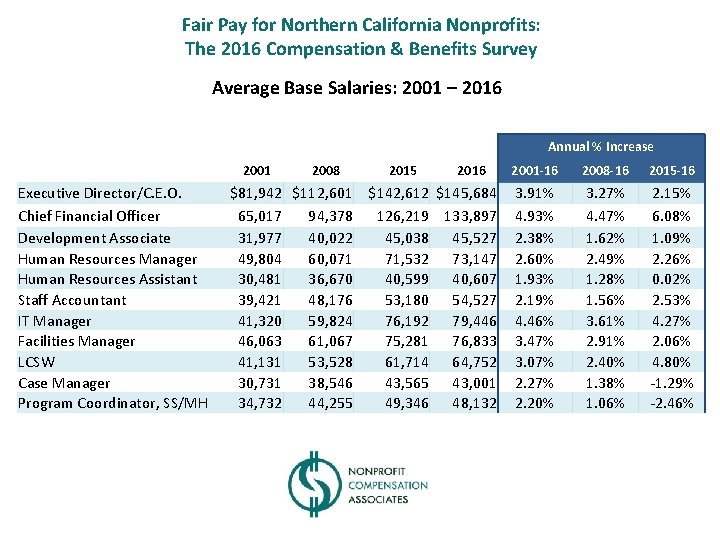
Fair Pay for Northern California Nonprofits: The 2016 Compensation & Benefits Survey Average Base Salaries: 2001 – 2016 Annual % Increase 2001 Executive Director/C. E. O. Chief Financial Officer Development Associate Human Resources Manager Human Resources Assistant Staff Accountant IT Manager Facilities Manager LCSW Case Manager Program Coordinator, SS/MH 2008 2015 2016 $81, 942 $112, 601 $142, 612 $145, 684 65, 017 94, 378 126, 219 133, 897 31, 977 40, 022 45, 038 45, 527 49, 804 60, 071 71, 532 73, 147 30, 481 36, 670 40, 599 40, 607 39, 421 48, 176 53, 180 54, 527 41, 320 59, 824 76, 192 79, 446 46, 063 61, 067 75, 281 76, 833 41, 131 53, 528 61, 714 64, 752 30, 731 38, 546 43, 565 43, 001 34, 732 44, 255 49, 346 48, 132 2001 -16 2008 -16 2015 -16 3. 91% 4. 93% 2. 38% 2. 60% 1. 93% 2. 19% 4. 46% 3. 47% 3. 07% 2. 20% 3. 27% 4. 47% 1. 62% 2. 49% 1. 28% 1. 56% 3. 61% 2. 91% 2. 40% 1. 38% 1. 06% 2. 15% 6. 08% 1. 09% 2. 26% 0. 02% 2. 53% 4. 27% 2. 06% 4. 80% -1. 29% -2. 46%
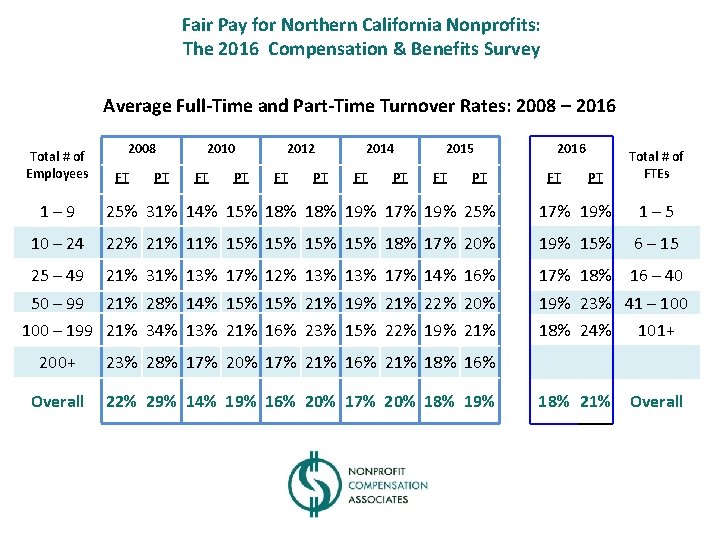
Fair Pay for Northern California Nonprofits: The 2016 Compensation & Benefits Survey Average Full-Time and Part-Time Turnover Rates: 2008 – 2016 Total # of Employees 2008 FT PT 2010 FT PT 2012 FT PT 2014 FT PT 2015 FT PT 2016 FT PT Total # of FTEs 1– 9 25% 31% 14% 15% 18% 19% 17% 19% 25% 17% 19% 1– 5 10 – 24 22% 21% 15% 15% 18% 17% 20% 19% 15% 6 – 15 25 – 49 21% 31% 13% 17% 12% 13% 17% 14% 16% 17% 18% 16 – 40 50 – 99 21% 28% 14% 15% 21% 19% 21% 22% 20% 19% 23% 41 – 100 – 199 21% 34% 13% 21% 16% 23% 15% 22% 19% 21% 200+ 23% 28% 17% 20% 17% 21% 16% 21% 18% 16% Overall 22% 29% 14% 19% 16% 20% 17% 20% 18% 19% 18% 24% 101+ 18% 21% Overall
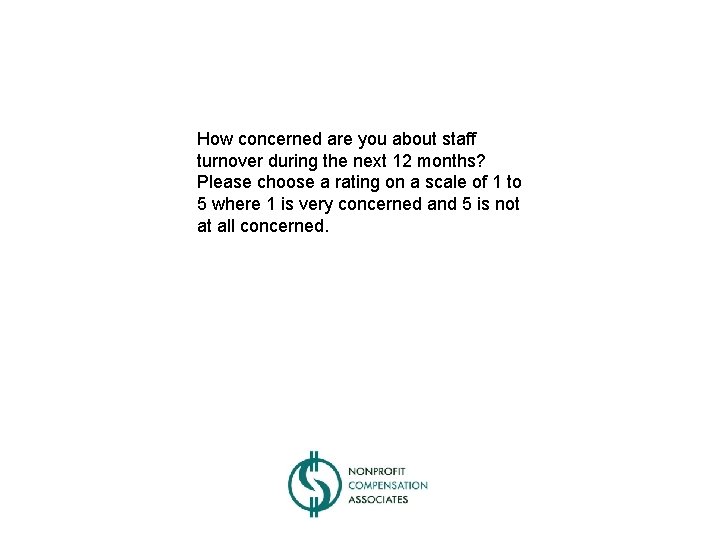
How concerned are you about staff turnover during the next 12 months? Please choose a rating on a scale of 1 to 5 where 1 is very concerned and 5 is not at all concerned.
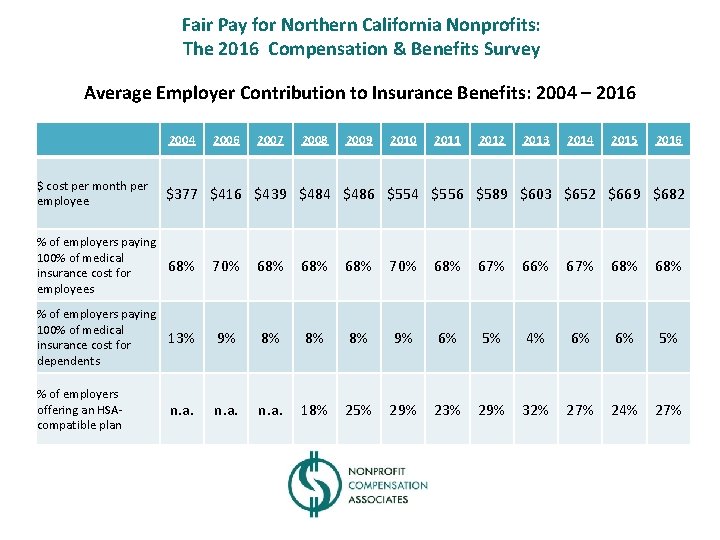
Fair Pay for Northern California Nonprofits: The 2016 Compensation & Benefits Survey Average Employer Contribution to Insurance Benefits: 2004 – 2016 2004 2006 2007 2008 2009 2010 2011 2012 2013 2014 2015 2016 $ cost per month per employee $377 $416 $439 $484 $486 $554 $556 $589 $603 $652 $669 $682 % of employers paying 100% of medical insurance cost for employees 68% 70% 68% 67% 66% 67% 68% % of employers paying 100% of medical insurance cost for dependents 13% 9% 8% 8% 8% 9% 6% 5% 4% 6% 6% 5% % of employers offering an HSAcompatible plan n. a. 18% 25% 29% 23% 29% 32% 27% 24% 27%
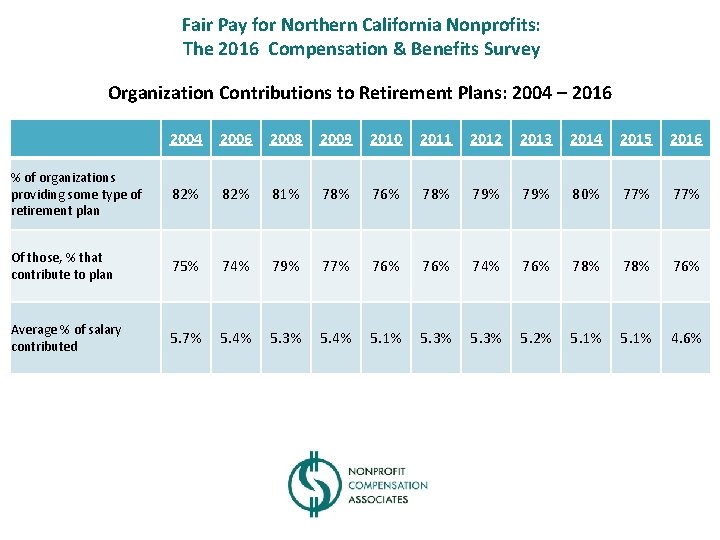
Fair Pay for Northern California Nonprofits: The 2016 Compensation & Benefits Survey Organization Contributions to Retirement Plans: 2004 – 2016 2004 2006 2008 2009 2010 2011 2012 2013 2014 2015 2016 % of organizations providing some type of retirement plan 82% 81% 78% 76% 78% 79% 80% 77% Of those, % that contribute to plan 75% 74% 79% 77% 76% 74% 76% 78% 76% Average % of salary contributed 5. 7% 5. 4% 5. 3% 5. 4% 5. 1% 5. 3% 5. 2% 5. 1% 4. 6%
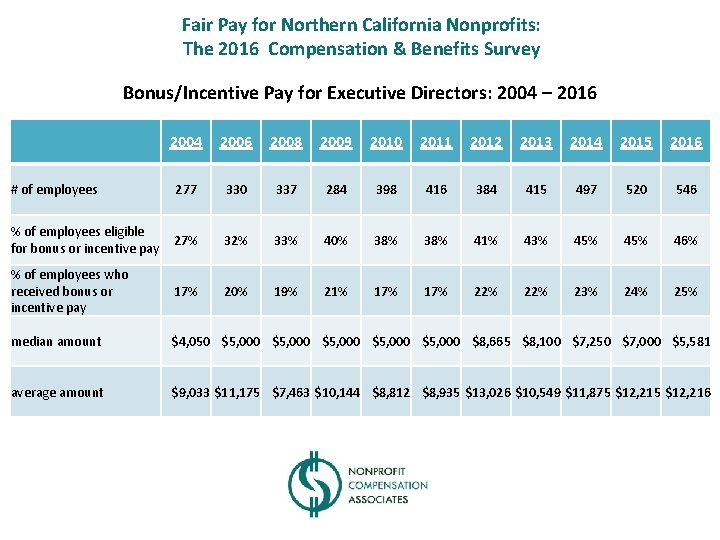
Fair Pay for Northern California Nonprofits: The 2016 Compensation & Benefits Survey Bonus/Incentive Pay for Executive Directors: 2004 – 2016 2004 2006 2008 2009 2010 2011 2012 2013 2014 2015 2016 # of employees 277 330 337 284 398 416 384 415 497 520 546 % of employees eligible for bonus or incentive pay 27% 32% 33% 40% 38% 41% 43% 45% 46% % of employees who received bonus or incentive pay 17% 20% 19% 21% 17% 22% 23% 24% 25% median amount $4, 050 $5, 000 $5, 000 $8, 665 $8, 100 $7, 250 $7, 000 $5, 581 average amount $9, 033 $11, 175 $7, 463 $10, 144 $8, 812 $8, 935 $13, 026 $10, 549 $11, 875 $12, 216
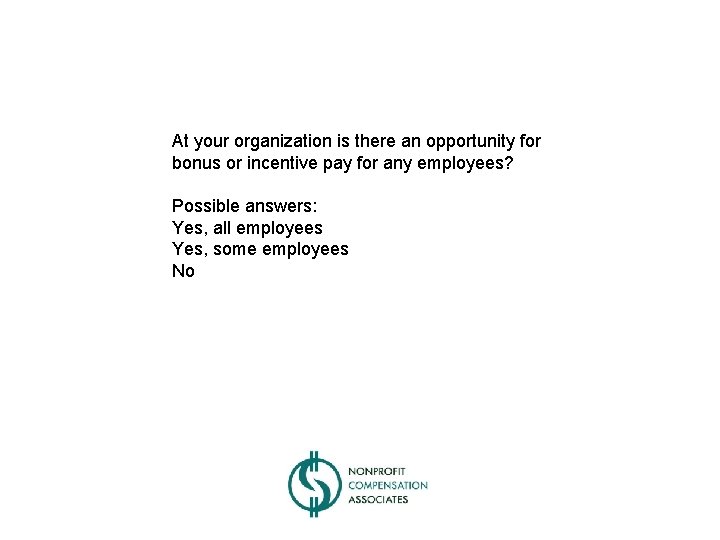
At your organization is there an opportunity for bonus or incentive pay for any employees? Possible answers: Yes, all employees Yes, some employees No
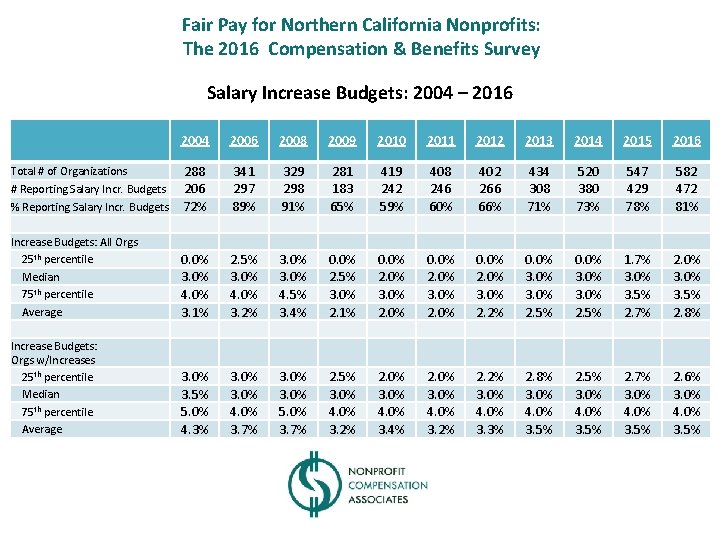
Fair Pay for Northern California Nonprofits: The 2016 Compensation & Benefits Survey Salary Increase Budgets: 2004 – 2016 2004 2006 2008 2009 2010 2011 2012 2013 2014 2015 2016 Total # of Organizations # Reporting Salary Incr. Budgets % Reporting Salary Incr. Budgets 288 206 72% 341 297 89% 329 298 91% 281 183 65% 419 242 59% 408 246 60% 402 266 66% 434 308 71% 520 380 73% 547 429 78% 582 472 81% Increase Budgets: All Orgs 25 th percentile Median 75 th percentile Average 0. 0% 3. 0% 4. 0% 3. 1% 2. 5% 3. 0% 4. 0% 3. 2% 3. 0% 4. 5% 3. 4% 0. 0% 2. 5% 3. 0% 2. 1% 0. 0% 2. 0% 3. 0% 2. 0% 0. 0% 2. 0% 3. 0% 2. 2% 0. 0% 3. 0% 2. 5% 1. 7% 3. 0% 3. 5% 2. 7% 2. 0% 3. 5% 2. 8% Increase Budgets: Orgs w/Increases 25 th percentile Median 75 th percentile Average 3. 0% 3. 5% 5. 0% 4. 3% 3. 0% 4. 0% 3. 7% 3. 0% 5. 0% 3. 7% 2. 5% 3. 0% 4. 0% 3. 2% 2. 0% 3. 0% 4. 0% 3. 4% 2. 0% 3. 0% 4. 0% 3. 2% 2. 2% 3. 0% 4. 0% 3. 3% 2. 8% 3. 0% 4. 0% 3. 5% 2. 5% 3. 0% 4. 0% 3. 5% 2. 7% 3. 0% 4. 0% 3. 5% 2. 6% 3. 0% 4. 0% 3. 5%
Is your organization giving regular pay increases during the current fiscal year? If yes, what is the approximate average increase? Possible answers: up to 2% 2% to 3% more than 3%
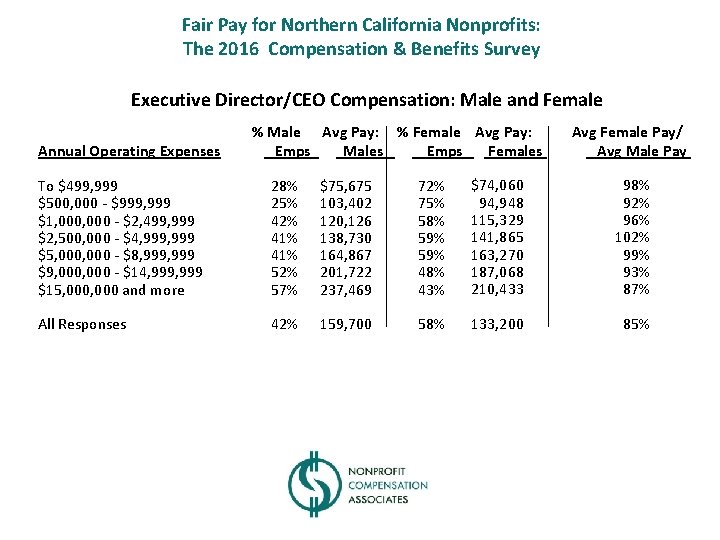
Fair Pay for Northern California Nonprofits: The 2016 Compensation & Benefits Survey Executive Director/CEO Compensation: Male and Female Annual Operating Expenses % Male Avg Pay: % Female Avg Pay: Emps Males Emps Females Avg Female Pay/ Avg Male Pay To $499, 999 $500, 000 - $999, 999 $1, 000 - $2, 499, 999 $2, 500, 000 - $4, 999 $5, 000 - $8, 999 $9, 000 - $14, 999 $15, 000 and more 28% 25% 42% 41% 52% 57% $75, 675 103, 402 120, 126 138, 730 164, 867 201, 722 237, 469 72% 75% 58% 59% 48% 43% $74, 060 94, 948 115, 329 141, 865 163, 270 187, 068 210, 433 98% 92% 96% 102% 99% 93% 87% All Responses 42% 159, 700 58% 133, 200 85%
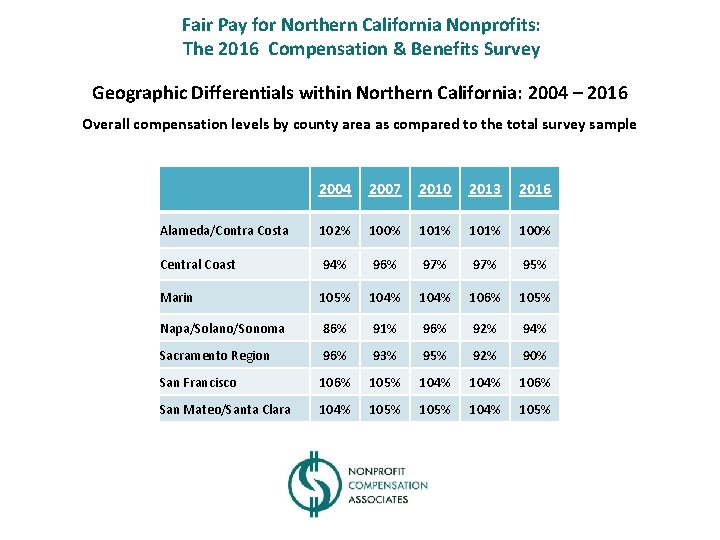
Fair Pay for Northern California Nonprofits: The 2016 Compensation & Benefits Survey Geographic Differentials within Northern California: 2004 – 2016 Overall compensation levels by county area as compared to the total survey sample 2004 2007 2010 2013 2016 Alameda/Contra Costa 102% 100% 101% 100% Central Coast 94% 96% 97% 95% Marin 105% 104% 106% 105% Napa/Solano/Sonoma 86% 91% 96% 92% 94% Sacramento Region 96% 93% 95% 92% 90% San Francisco 106% 105% 104% 106% San Mateo/Santa Clara 104% 105%
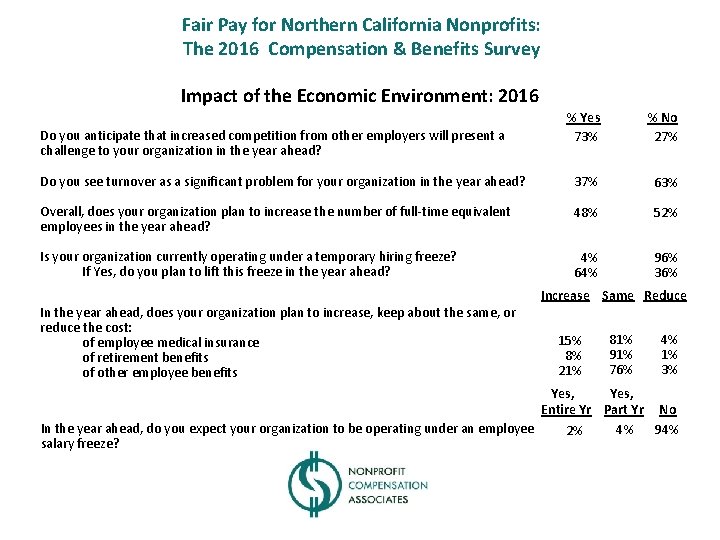
Fair Pay for Northern California Nonprofits: The 2016 Compensation & Benefits Survey Impact of the Economic Environment: 2016 % Yes 73% % No 27% Do you see turnover as a significant problem for your organization in the year ahead? 37% 63% Overall, does your organization plan to increase the number of full-time equivalent employees in the year ahead? 48% 52% Is your organization currently operating under a temporary hiring freeze? If Yes, do you plan to lift this freeze in the year ahead? 4% 64% 96% 36% Do you anticipate that increased competition from other employers will present a challenge to your organization in the year ahead? In the year ahead, does your organization plan to increase, keep about the same, or reduce the cost: of employee medical insurance of retirement benefits of other employee benefits Increase Same Reduce 15% 8% 21% 81% 91% 76% 4% 1% 3% Yes, Entire Yr Part Yr No In the year ahead, do you expect your organization to be operating under an employee 4% 94% 2% salary freeze?
From the perspective of your organization, what is your expectation of the local economic environment over the next 12 months? Possible answers: I expect conditions to improve I expect conditions to stay about the same I expect conditions to get worse
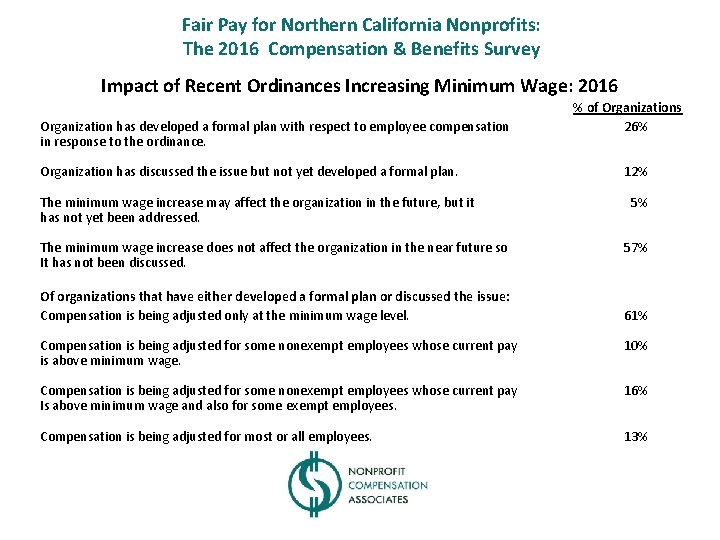
Fair Pay for Northern California Nonprofits: The 2016 Compensation & Benefits Survey Impact of Recent Ordinances Increasing Minimum Wage: 2016 Organization has developed a formal plan with respect to employee compensation in response to the ordinance. Organization has discussed the issue but not yet developed a formal plan. The minimum wage increase may affect the organization in the future, but it has not yet been addressed. The minimum wage increase does not affect the organization in the near future so It has not been discussed. Of organizations that have either developed a formal plan or discussed the issue: Compensation is being adjusted only at the minimum wage level. % of Organizations 26% 12% 5% 57% 61% Compensation is being adjusted for some nonexempt employees whose current pay is above minimum wage. 10% Compensation is being adjusted for some nonexempt employees whose current pay Is above minimum wage and also for some exempt employees. 16% Compensation is being adjusted for most or all employees. 13%
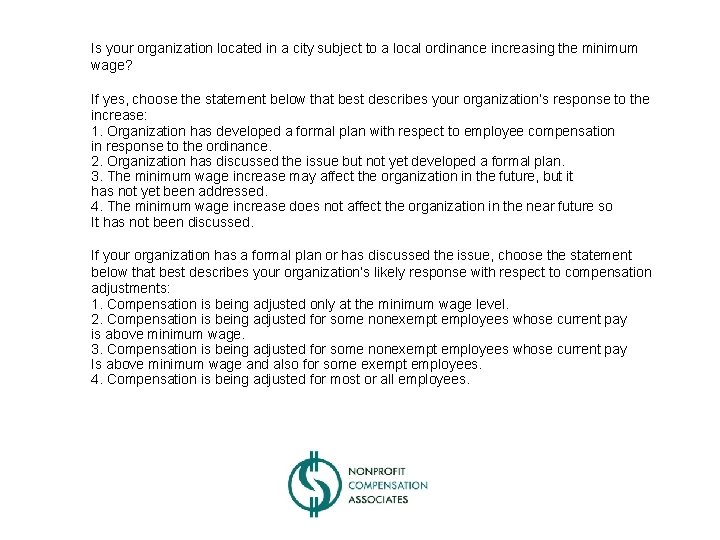
Is your organization located in a city subject to a local ordinance increasing the minimum wage? If yes, choose the statement below that best describes your organization’s response to the increase: 1. Organization has developed a formal plan with respect to employee compensation in response to the ordinance. 2. Organization has discussed the issue but not yet developed a formal plan. 3. The minimum wage increase may affect the organization in the future, but it has not yet been addressed. 4. The minimum wage increase does not affect the organization in the near future so It has not been discussed. If your organization has a formal plan or has discussed the issue, choose the statement below that best describes your organization’s likely response with respect to compensation adjustments: 1. Compensation is being adjusted only at the minimum wage level. 2. Compensation is being adjusted for some nonexempt employees whose current pay is above minimum wage. 3. Compensation is being adjusted for some nonexempt employees whose current pay Is above minimum wage and also for some exempt employees. 4. Compensation is being adjusted for most or all employees.
Nonprofit Compensation Associates www. nonprofitcomp. com rita@nonprofitcomp. com 510 -645 -1005