Faculty of Medicine Epidemiology and Biostatistics 31505204 Lecture
 ﻭﺍﻹﺣﺼﺎﺀ ﺍﻟﺤﻴﻮﻱ ﺍﻟﻮﺑﺎﺋﻴﺎﺕ Lecture 13 -14 Disease")
Faculty of Medicine Epidemiology and Biostatistics (31505204) ﻭﺍﻹﺣﺼﺎﺀ ﺍﻟﺤﻴﻮﻱ ﺍﻟﻮﺑﺎﺋﻴﺎﺕ Lecture 13 -14 Disease causation and association By Hatim Jaber MD MPH JBCM Ph. D 25 +29 -7 -2018 1

Presentation outline Time Epidemiology and causation 10: 30 to 10: 40 Cause , Risk, factor, confounder and effect Necessary and sufficient cause 10: 40 to 10: 50 Application of guidelines/criteria to associations Epidemiology and causation 10: 50 to 11: 10 to 11: 25 to 11: 35 2
 don’t occur at random •")
Epidemiological Principles • • Diseases (or other health events) don’t occur at random • • Diseases (or other health events) have causal and preventive factors which can be identified 3

• Hazard is something with the potential to cause harm, such as a substance, a piece of equipment, a form of energy, a way of working or a feature of the environment. • Harm includes death and major injury and any form of physical or mental ill health. • Risk it is a measure of the probability that the hazard (defined previously) will manifest some degree of harm. 4

Risk • Risk is the likelihood of an event occurring. In health care events, we usually consider a negative consequence arising from exposure to a hazard. • Types of risk – Absolute: incidence of disease in any population – Relative: ratio of the incidence rate in the group exposed to the hazard to the incidence rate in the non-exposed group – Attributable: Difference in incidence rates between exposed and non-exposed groups. 5

Cause and effect • Cause and effect understanding is the highest form of achievement of scientific knowledge. • Causal knowledge permits rational plans and actions to break the links between the factors causing disease, and disease itself. • Causal knowledge can help predict the outcome of an intervention and help treat disease. • Quote Hippocrates "To know the causes of a disease and to understand the use of the various methods by which the disease may be prevented amounts to the same thing as being able to cure the disease". 6

Cause - Definition • “ It t is an antecedent event, condition or characteristic that is necessary for the occurrence of the disease at the movement it occurs, given that the other conditions are fixed. ” • Alternatively the particular disease will not occur if those antecedent event, condition or characteristic are different in a specified way. 7

A cause? • The first and difficult question is, what is a cause? • A cause is something which has an effect. • In epidemiology a cause can be considered to be something that alters the frequency of disease, health status or associated factors in a population. 8

Association and Causation • Association is defined as “ Occurrence of two variables more frequently than expected”. • Association between suspected cause and effect does not always mean a causal association. 9

Types of Association may be grouped into following three types; 1. Spurious Association : When the observed association between suspected cause and effect may not be real. Example- Perinatal mortality being high in hospital deliveries than home deliveries implying hospital is unsafe. The cause of spurious association is poor control of Biases in study. 2. Indirect Association : It is a statistical association between a factor of interest and a disease due to presence of another factor known as Confounding Factor. Example-Iodine deficiency and Altitude association with Endemic Goitre. 3. Direct Causal Association : One to one and multifactorial 10
 Association 1. One to one causal Association : • • Two")
Direct (Causal ) Association 1. One to one causal Association : • • Two variables /factors are considered to be causally related if any change in one is followed by a change in the other. The initial criteria used by Henle and Koch to distinguish causal association from indirect and spurious ones were applied to infective disease and included ; 1. The causative agent must be recovered from all diseased individuals. 2. The agent recovered from diseased individuals must be grown in pure culture. 3. The organism grown in culture must replicate the disease when introduced in susceptible animals. 11

Koch's Postulates • 1. The specific organism should be shown to be present in all cases of animals suffering from a specific disease but should not be found in healthy animals. • 2. The specific microorganism should be isolated from the diseased animal and grown in pure culture on artificial laboratory media. • 3. This freshly isolated microorganism, when inoculated into a healthy laboratory animal, should cause the same disease seen in the original animal. • 4. The microorganism should be reisolated in pure culture from the experimental infection. 12
 Association …. contd. 2. Multifactorial Causation : – Single causation theory")
Direct (Causal ) Association …. contd. 2. Multifactorial Causation : – Single causation theory does not explain causation of Non-Communicable diseases where multiple factors are involved in causation of disease viz; CHD and Ca. Lung. – Two models presented below may explain multifactorial causation mechanism ; 1. Factor –A Factor- B Factor -C 2. Cellular reaction Factor –A Factor- B Factor-C Disease 13

Recent Concepts of Causation • Sufficient Cause : Sufficient cause imply a complete causal mechanism, a minimal set of conditions and events that are sufficient to cause disease or outcome to occur. • Component Cause & Necessary Cause • Necessary causes + Component causes = Sufficient cause 14

Hill’s criteria • • • Strength of association Temporal relationship Distribution of the disease Gradient Consistency Specificity Biological plausability Experimental models Preventive trials 15

Temporal Association • Exposure to causative factor must occur before the onset of disease. • This criteria is basic to the causal association. • Establishment of temporal association is easy in acute communicable diseases • It is difficult to establish temporal sequence in chronic insidious non communicable diseases as to which came first. • The consumption of cigarette smoking preceded by 30 years to the increase in the death rates due to lung cancer. Theses observations are compatible with the long latent period pathogenesis of carcinogenesis. 16

Strength of Association • The larger the Relative Risk the more likely the association is causal. • Likelihood of causal association is strengthened if there is dose and duration response relationship. • In the absence of experimental evidence in humans, the causal association between cigarette smoking and lung cancer has been based on following ; – Relative Risk – Dose response relationship – Decrease in risk on cessation of smoking 17

Dose Response Relationship • Dose Response Relationship : – More intense and longer exposure should result into more frequent and severe disease. – This has been clearly established in the relationship of smoking and lung cancer. • Dose and Duration Response Relationship – The cumulative effect of dose and duration has also been well established in relationship of smoking and lung cancer. 18

Specificity of Association • The concept of specificity implies a “ one to one” relationship between the cause and effect • The causal factor should produce one specific disease or effect. • In recent past, the controversy over cigarette smoking and lung cancer relationship has centered around specificity of the association. • Cigarette smoking is linked with lung cancer and several other conditions such as CHD, Chronic Respiratory conditions and Ca. Cervix etc. • Lack of specificity can be explained by the fact that tobacco smoke contains several harmful substances such as nicotine, carbon monoxide, benzpyrene, tar and other particulate matters with possible additive and synergistic actions. 19

Consistency of Association • The result from single study is seldom sufficient to establish causal association. • An association has to be replicated and confirmed by different investigators, in different populations using different design in order to be established as causal association. • More than fifty retrospective studies and at least nine prospective studies in different countries have shown a consistent association between cigarette smoking and subsequent development of lung cancer has lent support to a causal association. 20

Biological Plausibility • Causal association is substantiated if biological plausibility is present. • The notion that food intake and cancer is interrelated is an old concept. • The positive association of intestine, colon and rectum with food intake is biologically plausible. • The cigarette smoking and lung cancer is also biologically plausible as it is well established that tobacco contains carcinogen which cause Ca-lung 21

Confounding: A Fundamental Problem of Causal Inference § Confounding is bias due to inherent (unobservable) differences in risk between exposed and unexposed populations, i. e. , a lack of comparability. § Confounding is usually not a major source of bias in randomized trials (assuming sample size is large enough) because randomization tends to equalize inherent risks between treatment groups (treated group = exposed, untreated = unexposed) 22

Confounding § May lead to observation of association when none exists § May obscure an association that exists § Information on potential confounders should be collected in the study and used in analysis, otherwise they cannot be excluded as alternate explanations for findings § Confounding factors must be considered during study design 23

Example of judging causality: lung cancer 24

causality: lung cancer 25

Figure 5. 13 The pyramid of associations 1 Causal and mechanisms understood 2 Causal 3 Non-causal 4 Confounded 5 Spurious / artefact 6 Chance 26

Necessary Condition • Must be there for the effect, the charge, to be true • If absent, cannot occur. • No oxygen, no combustion. • No seeds, no plants to grow • Car runs only if gas in tank. 27

Sufficient Condition • Whenever A is present, B will follow-decapitation is sufficient for death. • Getting a B in the course is sufficient for passing. • Necessary cause: must always PRECEDE the effect. This effect need not be the sole result of the one cause • Sufficient cause: inevitably initiates or produces an effect 28

Necessary & Sufficient • Something can serve as both necessary and sufficient- “You will get Malaria if and only if “ you are bitten by a mosquito carrying the germ. Malaria ≈ Mosquito (germ) • If you have Malaria you must have been bitten by the mosquito with the germ. 29

Relating • Exposures: causes, risk factors, independent variables to… • Outcomes: effects, diseases, injuries, disabilities, deaths, dependent variables • Statistical association versus biological causation: cause-effect relationship

Levels / Types of causality • • Molecular / Physiological Personal / Social Deterministic / probabilistic What aspect of “environment” (broadly defined) if removed / reduced / controlled would reduce outcome / burden of disease

Summary • Cause and effect understanding is the highest form of scientific knowledge. • Epidemiological and other forms of causal thinking shows similarity. • An association between disease and the postulated causal factors lies at the core of epidemiology. • Demonstrating causality is difficult because of the complexity and long natural history of many human diseases and because of ethical restraints on human experimentation. 32

Summary. . • All judgements of cause and effect are tentative. • Be alert for error, the play of chance and bias. • Causal models broaden causal perspectives. • Apply criteria for causality as an aid to thinking. • Look for corroboration of causality from other scientific frameworks. 33

 • Deduction: reasoned argument proceeding from the general to the particular. •")
Definitions (I) • Deduction: reasoned argument proceeding from the general to the particular. • Induction: any method of logical analysis that proceeds from the particular to the general. Conceptually bright ideas, breakthroughs and ordinary statistical inference belong to the realm of induction. • Induction period: the period required for a specific cause to produce the disease (health-related outcome). Usually longer with NCDs
 • Association (relationship): statistical dependence between two or more events, characteristics or")
Definitions (II) • Association (relationship): statistical dependence between two or more events, characteristics or other variables. Positive association implies a direct relationship, while negative association implies an inverse one. The presence of a statistical association alone does not necessarily imply a causal relationship. • Causality (causation / cause-effect relationship): relating causes to the effects they produce. • Cause: an event, condition, characteristic (or a combination) which plays an important role / regular / predicable change in occurrence of the outcome (e. g. smoking and lung cancer) • Causes may be “genetic” and / or “environmental” (e. g. many NCDs including: diabetes, cancers, COPD, etc)
 • Deterministic causality: cause closely related to effect, as in “necessary” /")
Definitions (III) • Deterministic causality: cause closely related to effect, as in “necessary” / “sufficient” causes • Necessary cause: must always PRECEDE the effect. This effect need not be the sole result of the one cause • Sufficient cause: inevitably initiates or produces an effect, includes “component causes” Any given cause may be necessary, sufficient, both, neither (examples)
 • Component causes: together they constitute a sufficient cause for the outcome")
Definitions (IV) • Component causes: together they constitute a sufficient cause for the outcome in question. In CDs, this may include the biological agent as well as environmental conditions (e. g. TB, measles, ARF/RHD). In NCDs, this may include a whole range of genetic, environmental as well as personal / psychosocial / behavioral characteristics (e. g. diabetes, cancers, IHD)

Sufficient & necessary cause Necessary cause is without this disease/outcome never develops. Sufficient cause: presence of this factor disease always develops. Component cause: Supporting causes, per se they can not develop ds Necessary causes + Component causes = Sufficient cause
 • Probabilistic Causality: in epidemiology, most associations are rather “weak” (e. g.")
Definitions (V) • Probabilistic Causality: in epidemiology, most associations are rather “weak” (e. g. relationship between high serum cholesterol and IHD), which is neither necessary nor sufficient • Multiple causes result in what is known as “web of causation” or “chain of causation” which is very common for noncommunicable / chronic diseases
")
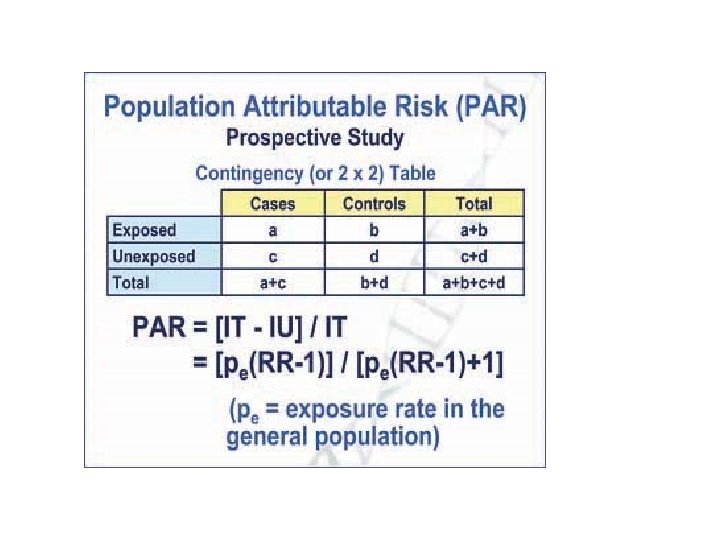
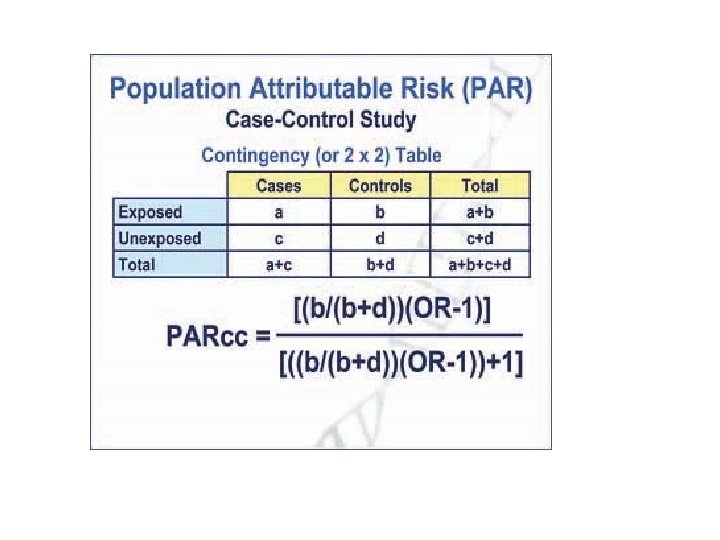
Effect Measures / Impact Fractions • Effect measures (e. g. odds ratio, risk ratio) and impact fractions (e. g. population attributable risk) are closely related to the strength of association • The higher effect measures (away from unity) and population attributable risk (closer to 100 %) the more the exposure is predictive of the outcome in question • E. g. PAR of 100 % means that a factor is “necessary”
 • Predisposing factors: factors that prepare, sensitize, condition or otherwise create a")
Definitions (IV) • Predisposing factors: factors that prepare, sensitize, condition or otherwise create a situation (such as level of immunity or state of susceptibility) so that the host tends to react in a specific fashion to a disease agent, personal interaction, environmental stimulus or specific incentive. Examples: age, sex, marital status, family size, education, etc. (necessary, rarely sufficient). • Precipitating factors: those associated with the definitive onset of a disease, illness, accident, behavioral response, or course of action. Examples: exposure to specific disease, amount or level of an infectious agent, drug, physical trauma, personal interaction, occupational stimulus, etc. (usually necessary).
: away from")
Expressions of Strength of Association • Quantitatively: – Effect measure (OR, RR): away from unity (the higher, the stronger the association) – P-value (at 95% confidence level): less than 0. 05 (the smaller, the stronger the association) • Qualitatively: – Accept alternative hypothesis: an association between the studied exposure and outcome exists – Reject null hypothesis: no association exists
 association")
From association to causation A. Spurious association B. Indirect association C. Direct (Causal) association 1. One –to- one causal association 2. Multifactorial causation Sufficient & necessary cause Web of causation (Interaction)

Direct Vs indirect cause Direct F 508 Polymorphism Indirect High cholesterol Artery thickening Hemostatic factors Cystic Fibrosis Myocardial infarction

Web of causation Change in life style Abundance of food D Obesity Hyperlidemia Stress Smoking Emotional Disturbance Lack of physical activity Hypertension Increase catacholamine thrombotic activity Coronory atherosclerosis Aging & other factor Coronary occlusion Myocardial Infarction Changes in walls of arteries

Interaction of multiple individual causes Smoking + Air pollution Reaction at cellular level + Exposure to asbestos Lung cancer Table 1: Age-standardized lung cancer death rates (per 100 000 population) in relation to tobacco use and occupational exposure to asbestos dust

Causes of tuberculosis Susceptible host Infection Tuberculosis

How to establish the cause of a disease? OBSERVED ASSOCIATION? Could it be due to selection or measurement bias? No Could it be due to confounding? No Could it be a result of chance? Probably not Could it be causal? Apply guidelines and make judgment
 and making judgment regarding causation Temporal relation Does")
Appling guidelines (Hills criteria/Guidelines for causation) and making judgment regarding causation Temporal relation Does the cause precede the effect? (essential) Plausibility Is the association consistent with other knowledge? (mechanism of action; evidence from experimental animals) Consistency Have similar results been shown in other studies? Strength What is the strength of the association between the cause and the effect? (relative risk) Dose–response Is increased exposure to the possible cause associated relationship with increased effect? Reversibility Does the removal of a possible cause lead to reduction of disease risk? Study design Is the evidence based on a strong study design? Judging the How many lines of evidence lead to the conclusion? evidence

Analytical Methods • Measures of association /strength of association • Testing hypothesis of association • Controlling confounders

Testing hypothesis of association • Null Hypothesis Rejecting Causal association Accepted Not causal association

Controlling confounders At time designing of epidemiological study or while carrying study • Randomization • Restriction • Matching At analysis stage • Stratification • Adjustment • Statistical modeling

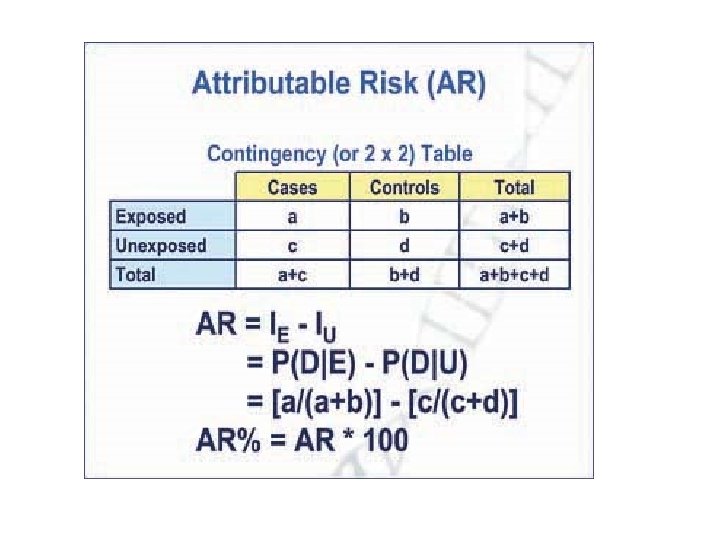
Measures of association / strength of association 1. Ratio measures - Relative risk - Odds ratio 2. Difference measures -Attributable risk -Population Attributable risk

Strength of association • Relative risks/Odds ratio greater than 2 can be considered strong Risk ratio <1 Interpretation Protective 0. 9 -1. 1 No association 1. 2 - 1. 6 Weak Causal association 1. 7 - 2. 5 >2. 6 moderate causal association Strong causal association

Exploring Linear Relationships • Researchers use crosstabs and comparison of means between two variables to see if there is a relationship • If we see some differences that suggest there is a relationship, the next steps is to determine how strong it is 56

Direction of Relationship Revisited • Plus sign: direct relationship – Both variables change in the same direction – Example: as driving speed increases, death rate goes up 57

Direction of Relationship Revisited • Minus sign: inverse relationship – Both variable change but in the opposite direction – Example: as age increases, health status decreases 58

Measures of Association • How strong is the association? • Several different measures of association – Some measures of association range from 0 to 1 – Others range from minus 1 to plus 1 59

How To Interpret Measures of Association • Measures of Association get interpreted in a similar way: • Perfect Relationship = 1 – Closer to 1: strong relationship –. 5 moderate/strong • Closer to 0: no relationship –. 2 some/slight 60

How To Interpret Measures of Association • Interpreting measures of association that have a minus sign: – Minus sign indicates an inverse relationship (meaning as one variable goes up, the other goes down) • As age increases, memory decreases – For example, -. 9 is a very strong relationship (almost perfect relationship because it is close to 1), but it is an inverse relationship because it has a minus sign 61
 & Odds ratio")
Epidemiologic Measures of Association • Compute & Interpret Relative risk (RR) & Odds ratio (OR) as a measure of association between exposure and Disease • Understand when OR approximates RR 62

Definitions Association • A statistical relationship between two or more variables Risk • Probability conditional or unconditional of the occurrence of some event in time • Probability of an individual developing a disease or change in health status over a fixed time interval, conditional on the individual not dying during the same time period 63

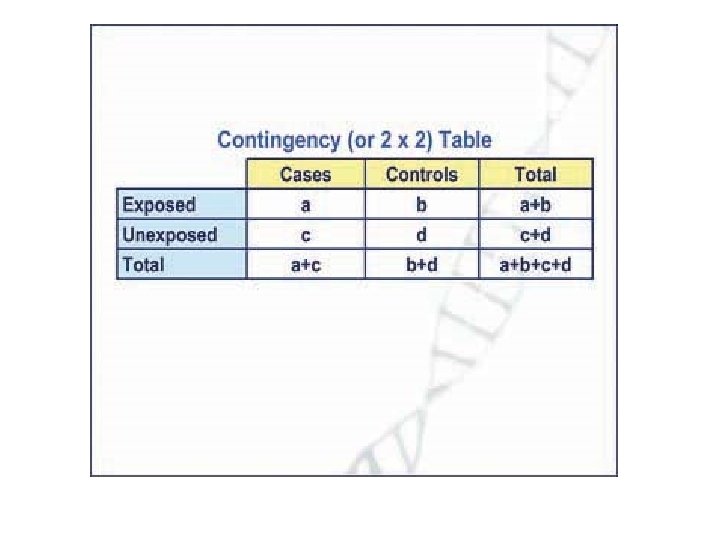
Association between exposure & Disease • Question: Is there an excess risk associated with a given exposure? • Objective: To determine whether certain exposure is associated with a given disease • Methodology: Use one of the epidemiologic study designs Cohort Case-control 64
 of disease in an exposed group")
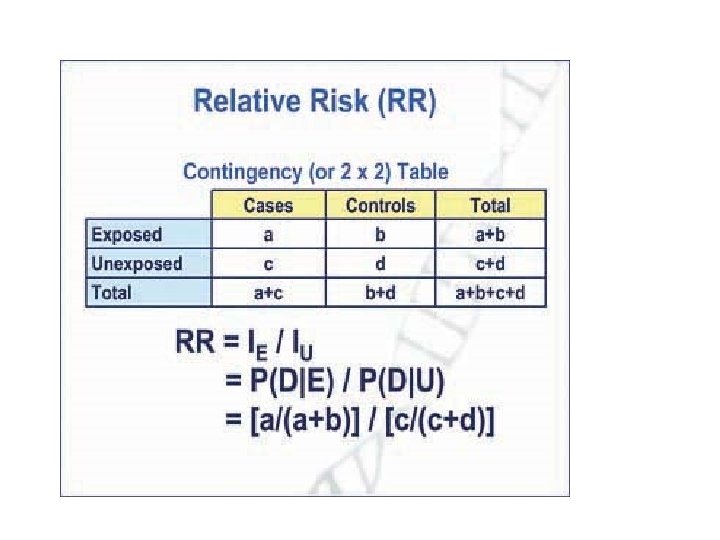
Cohort Study • Assess the cumulative incidence (CIE+) of disease in an exposed group (absolute Risk) Assess the cumulative incidence (CIE-) of disease in unexposed group (absolute Risk) e. g. Coronary Heart Disease (CHD) Risk among Smokers 1 -year risk of CHD among smokers (CIE+)* CHD Yes No Total Smokers 84 2916 3000 CIE+ = 84/3000 = 28/1000/yr (1 -risk of CHD among smokers) Cont. 65
 CHD")
CHD Risk among non-smokers • 1 -year risk of CHD among non-smokers (CIE-) CHD Yes No • Non-smokers 87 4913 5000 CIE-= 87/5000=17. 4/1000/yr (1 -yr among non-smokers) risk of CHD Cont. 66
 a. Ratio RR (Ratio of two risks; Risk")
Assessment of Excess Risk (Two methods) a. Ratio RR (Ratio of two risks; Risk Ratio; Relative Risk) CIE+ / CIE- = 28/17. 4 = 1. 6 Interpretation of RR Smokers were 1. 6 times as likely to develop CHD as were non-smokers b. Difference of two risks (Risk Difference)* CIE+- CIE- = 28. 0 – 17. 4 = 10. 6 67
 • In case-control study (CCS), we cannot calculate the")
OR (Odds Ratio, Relative Odds) • In case-control study (CCS), we cannot calculate the CI or IR, therefore, cannot calculate the RR “directly” • OR as a measure of association between exposure & disease is used when data are collected in case-control study • OR can be obtained however, from a cohort as well as a case-control study and can be used instead of RR. 68

OR in case-control and cohort • Cohort study studies Ratio of the proportion of exposed subjects who developed the disease to the proportion of non-exposed subjects who developed the disease • Case-control study Ratio of the proportion of cases who were exposed to the proportion of controls who were non-exposed 69

Odds Ratio • Odds are ratio of two probabilities i. e. Probability that event occurs / 1 Probability that event does not occur • Odds refer to single entity • If an event has the probability P, then the odds of the same event are P/1 -P 70
 =")
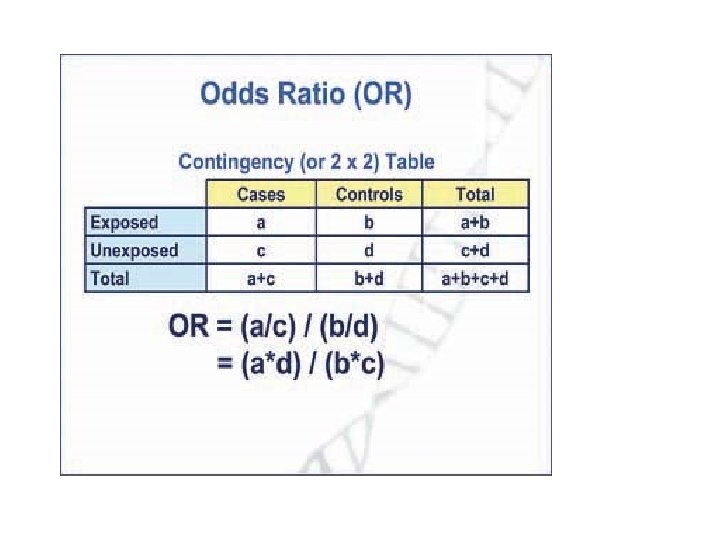
Derivation of OR in Cohort study P D+|E+ = (exposed developed the disease) = a/(a+b) P D-|E+ = (exposed did not develop the disease) = b/(a+b) Odds of developing disease among exposed = D+|E+/1 -P D-|E+ = a/(a+b) b/(a+b) = a/b P D+|E- = (non-exposed developed the disease) = c/(c + d) P - D |E = (non-exposed did not develop the disease)= d/(c + d) Odds of developing disease among non-exposed = = PD+|E-/1 -P D+|E- = c/(c+d) d/(c + d) = c/d Odds ratio a/b : c/d = ad/bc 71

OR in case-control study n In case-control study RR cannot be calculated directly to determine the association between exposure and disease. n Don’t know the risk of disease among exposed and un-exposed since we start recruiting cases and controls. n Can use OR as measure of association between exposure and disease in a case control study. 78

OR in case-control Study Probability of case being exposed = Pcase Probability of case being non-exposed =1 -Pcase Odds of case being exposed = Pcase/1 - Pcase Probability of control being exposed = Pcontrol Probability of case being non-exposed =1 -Pcontrol Odds of control being exposed = Pcontrol/ 1 -Pcontrol 79

Derivation of OR in case-control Study Probability of being exposed among cases = a /(a + c) Probability of being non-exposed among cases) = c /(a + c) Odds of being exposed among cases = a/c Probability of being exposed among controls = b/(b + d) Probability of being unexposed among controls = d/(b + d) Odds of being exposed among controls = b/d OR = ad/bc 80

Example OR in case-control Study • Past surgery • Yes • No » HCV status HCV+ HCV 59 168 54 48 113 216 81
 = 59/113 1")
Odds of Past surgery among HCV+ P 1 (Surgery among HCV+) = 59/113 1 -P 1 (No surgery among HCV+) = 54/113 Odds of surgery among HCV+ ) = 59/54 = 1. 09 Odds of Past surgery among HCVP 2 (Surgery among HCV-) = 168/216 1 -P 2 (No surgery among HCV-) = 48/216 Odds of surgery among HCV- = 168/48 = 3. 5 OR = 3. 50/1. 09 = 3. 21 82

When is the OR a good estimate of RR? In CCS, only OR can be calculated as measure of association n In Cohort study, either RR or OR is a valid measure of association n When a RR can be calculated from case control study? *When exposure prevalence among studied cases in similar and nearly similar to that of disease subjects in the population from which cases are taken. *Prevalence of exposure among studied controls is similar to that of non-diseased population from cases were drawn. 83 *Rare disease (CI < 0. 1) n
- Slides: 83