Faculty of Engineering Minia University Illustrations What is


 Tables with")


- Slides: 25
Faculty of Engineering Minia University Illustrations
What is an illustration? Illustration is a graphic or an image that conveys information.
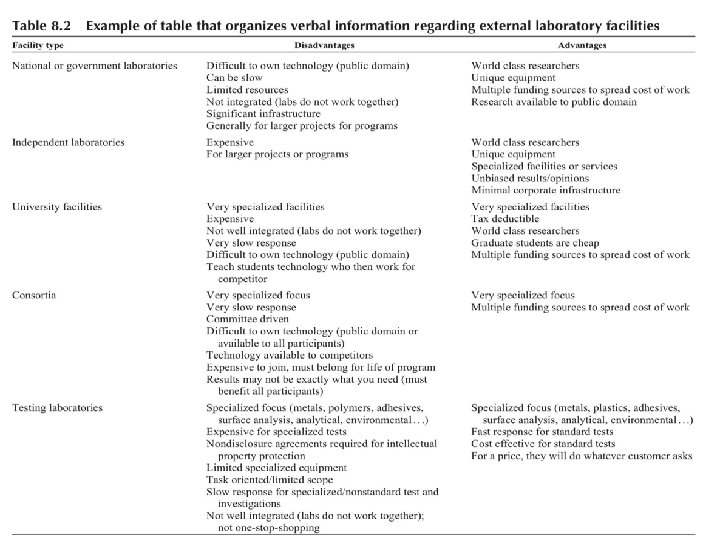
Categories of illustrations: Photographs from digital recordings Line art : (charts –drawings) Tables with numbers or words
concision Easier interpretation of information simplification interest Reasons for using illustrations Speeding up communication
1: Interest Illustrations increase interest and readability by giving readers a visual break. For examble : newspapers and magazines are full of illustration.
3: Concision *Illustrations help make a document more concise. For examble: *The following description has 150 words, and you probably still cannot visualize what the house looks like.
How to Prepare Effective Illustrations *categories of illustration:
1: photographs. There are two ways to capture an image: • q. Halide-made film. q. Digital files. • The choice depends on two things : Ø Speed Ø Resolution
Should any photos be in color? v. Only use color in illustrations when color adds value. v. Only scan photographs from continuous-tone prints.
2: Line art
Schematics: simplified sketches of a process or object. for example : The schematic illustrates how a particular test rig works.
Charts : are visual presentation Of numerical or verbal information. 1 - pie charts are a classic way to show the relative portions of awhole.
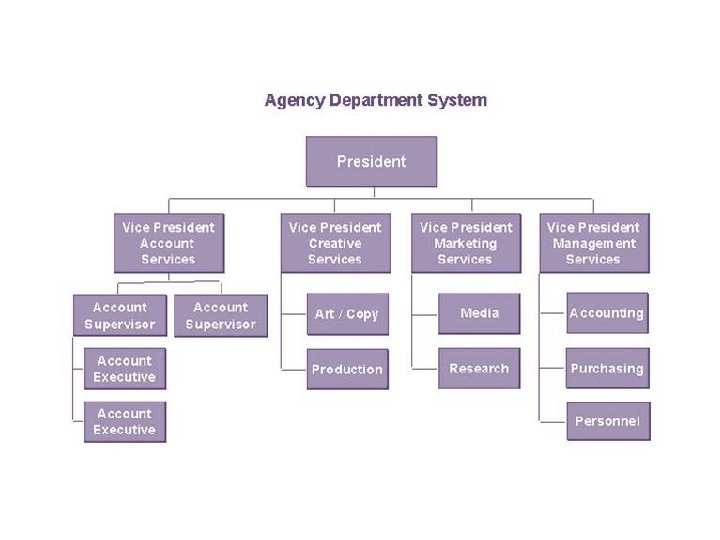
2 : Organization charts are extremely helpful in technical communications for showing department personnel or functions. They are also extremely helpful to authors in developing document distribution lists.
4 : Bar charts : are well suited to illustrate relative properties of a number of items. They are interpreted easily by readers.
5 : Histograms : are very useful forms of bar charts that show the of a large amount of data. For example, they can be used to show which age groups vote in an election or the distribution of hole and “identical” parts. They are great tools for interpreting data and determining if data are normally distributed.
Clip art: is available on most personal computers and is intended to add interest to a document. but it is recommended that you not use clip art in technical documents for decoration. the reason for this opinion is that it may impugn credibility.
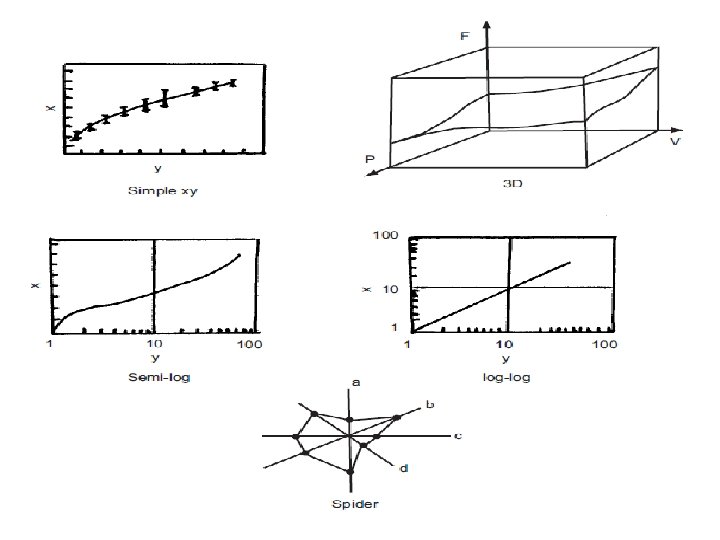
Graphs : are an indispensable part of many technical documents. They interpret data and serve as the basis for models and theories. - There are some types of line graphs shown in next slide:
Videos Computers have made it possible to insert animation into computer documents. --It is not necessary to use them unless the animation offers value.
Drawings *Engineering drawings are often included in edited form in technical documents. *Most engineering drawings contain extra “boilerplates” that need to be deleted for concision when drawings are part of a text document.
Captions for Illustrations *The value and readability of technical documents can be enhanced by the use of properly prepared graphs, charts, photos, and tables. However, the benefits of an illustration can be negated by an inadequate caption. RULE: Every figure caption and table title leads with a clear and concise phrase of what is shown.
Referring to Illustrations All numbered illustrations must be referred to in the text body, and the following are basic recommendations: • Use the term “figure” to refer to any graphic, photo, or piece of artwork. • Use the term “table” to refer to any type of tabular format that can be typeset or presented with spreadsheet or tabular programs. • Number the figures and tables in sequence with their mentioning in text. • Put the figure or table number preceding the caption or title (Figure 1, 2, 3, and Table 1, 2, 3, etc. ). • Include attribution if the illustration belongs to another.
Summary • Keep graphs simple; 3 D graphs are discouraged. • Avoid plotting complex mathematical functions as a scale. • Avoid acronyms in captions, titles, and axis labels. • The caption should describe what the graph shows and cite sources of data. • Show all data points on graphs and show any curve fitting line and/or error bars. • When using multiple graphs to compare items, use the same vertical and horizontal range. Beware of self-scaling computer programs. • Wherever possible, start the scales for numerical data at zero. • Use a key to identify multiple data sets.