Faculty Engineering Technology Chapter 5 Basic Environmental Engineering

| Faculty Engineering Technology Chapter 5 Basic Environmental Engineering & Management Introduction to air pollution engineering Najihah Abdul Rashid

In this chapter you will be able DISCOVER air pollution legislation, generation, sources, characteristics, control, impact and measurements

Composition of the Atmosphere • permanent gases • roles of nitrogen, oxygen and argon • variable gases • role of water vapor • trace gases • carbon dioxide, methane, ozone, CFCs, et al. • aerosols

Composition of the Atmosphere The Hydrological Cycle

WHAT IS AIR POLLUTION? Any visible or invisible particle or gas found in the air that is not part of the original, normal composition.

Air Pollutant • CHARACTERIZATION OF POLLUTANTS • Primary pollutants- pollutants that are directly emitted from air pollution sources. (SO 2, CO and particulate matters) • Secondary pollutants- pollutant that are formed in the atmosphere (ozone) • Most compounds are both primary and secondary
 Pollutant Type Standard Averaging Timea SO")
AIR POLLUTANT NAAQS (National American Air Quality Standard) Pollutant Type Standard Averaging Timea SO 2 Primary 365 μg/m 3 24 -hour SO 2 Primary 0. 80 μg/m³ annual SO 2 Secondary 1, 300 μg/m³ 3 -hour PM 10 Primary and Secondary 150 μg/m³ 24 -hour PM 2. 5 Primary and Secondary 35 μg/m³ 24 -hour PM 2. 5 Primary and Secondary 15 μg/m³ annual CO Primary 40 mg/m³ 1 -hour CO Primary 10 mg/m³ 8 -hour O 3 Primary and Secondary 235 μg/m³ 1 -hourb O 3 Primary and Secondary 235 μg/m³ 8 -hour NOx Primary and Secondary 100 μg/m³ annual Pb Primary and Secondary 1. 5 μg/m³ quarterly
 and counting…")
Composition of the Atmosphere • Carbon dioxide • 390 ppm (by mass) and counting… • Natural and anthropogenic sources/sinks • Strong greenhouse gas (GHG) • CO 2 is neither the strongest atmospheric GHG pound-for-pound nor molecule-for-molecule… • Why the fuss? • CO 2 is a product of the reaction that allows modern civilization to exist: combustion.

Composition of the Atmosphere The Global Carbon Cycle

Composition of the Atmosphere • Methane • • • CH 4 concentration: 1. 8 ppmv anthropogenic and natural sources/sinks too powerful greenhouse gas oxidizes rapidly, hence low concentrations Large concentrations proposed to explain greenhouse warming of early Earth
 •")
Composition of the Atmosphere • Ozone, CFCs and NOx • Ozone (O 3) • shields the surface from UV rays • produced by reaction with NOx and sunlight near the surface • CFC’s (Chlorofluorocarbons) • destroy stratospheric ozone • chlorine is a catalyst: it destroys one O 3 molecule and then is free to find another • Ozone at high altitudes (stratosphere) is “good”; ozone at low altitudes (troposphere) is “bad. ”

EXOSPHERE THERMOSPHERE MESOSPHERE STRATOSPHERE TROPOSPHERE

Composition of the Atmosphere • Aerosols • • Dust Sea-spray Microbes Suspended particles in the atmosphere are responsible for cloud formation: water drops nucleate on them
")
Air Pollutant (Particulates)

What Stoke’s Law tells us is that, all other things being constant, dense particles settle faster, larger particles settle faster, and denser, more viscous air causes particles to settle slower. Stoke’s Law is used in several ways. We can predict settling rate for a given particle if its diameter and density are known. Another way in which Stoke’s Law is used is to estimate particle diameters (called "Stoke’s diameter") from observed settling rates.

AIR POLLUTANT CONCENTRATION MODELS
 • Predict pollutant concentrations at various locations around the source.")
Air Quality Modeling (AQM) • Predict pollutant concentrations at various locations around the source. • Identify source contribution to air quality problems. • Assess source impacts and design control strategies. • Predict future pollutant concentrations from sources after implementation of new regulatory programs.

Introduction to Air Pollutants Concentration Model

Areas Surrounding the Site of Release
 �Mathematical and numerical techniques are used in AQM to simulate")
Air Quality Modeling (AQM) �Mathematical and numerical techniques are used in AQM to simulate the dispersion of air pollutants. �Modeling of the dispersion of pollutants �Toxic and odorous substances �Single or multiple points �Point, Area, or Volume sources �Input data required for Air Quality Modeling �Source characteristics �Meteorological conditions �Site and surrounding conditions

Ambient Air Concentration Modeling • Types of Pollutant Sources • Point Sources • e. g. , stacks or vents • Area Sources • e. g. , landfills, ponds, storage piles • Volume Sources • e. g. , conveyors, structures with multiple vents

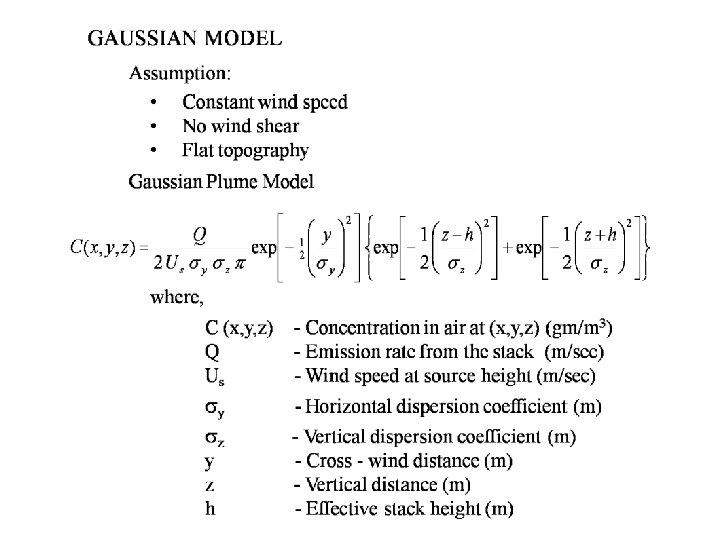
Factors Affecting Dispersion of Pollutants In The Atmosphere • Source Characteristics • Emission rate of pollutant • Stack height • Exit velocity of the gas • Exit temperature of the gas • Stack diameter • Meteorological Conditions • Wind velocity • Wind direction • Ambient temperature • Atmospheric stability

Gaussian Models • Advantages • Produce results that match closely with experimental data • Incorporate turbulence in an ad-hoc manner • Simple in their mathematics • Quicker than numerical models • Do not require super computers

Gaussian Models • Disadvantages • Not suitable if the pollutant is reactive in nature • Fails to incorporate turbulence in comprehensive sense • Unable to predict concentrations beyond radius of approximately 20 Km • For greater distances, wind variations, mixing depths and temporal variations become predominant

SOURCES OF ERROR IN GAUSSIAN MODEL

Dispersion Models – Expression Accumulation rate All f/rates in All f/rates out Creation rate Destruction rate

Fixed Box Model ● Box model is based on the conservation of mass ● The receptor is considered as a box into which pollutants are emitted and undergo chemical and physical processes. ● Input to the model is simple meteorology. ● Emissions and the movement of pollutants in and out of the box is allowed. ● The air mass is considered as well mixed and concentrations to be uniform throughout.
 with width, W and length,")
Fixed Box Model Assumptions 1. City is RECTANGLE (BOX) with width, W and length, L and with one side parallel to the wind direction 2. Atmospheric turbulence produces complete and TOTAL MIXING of pollutants up to the mixing height, H and no mixing above this height. The pollutants over the city distribute uniformly. 3. The WIND blows in the x direction with velocity, u. VELOCITY is constant and is independent of time (in contrast, velocity increase with respect to elevation) – average u.

CONTINUED 5. The CONCENTRATION of the pollutants which are just getting into the city is a constant b 6. The EMISSION RATE of pollutant is Q. Q = q. A, in which q means the emission rate per unit area and A (A = W × L) means the area of city. 7. No pollutant get through the top of box, nor passing the side paralleling with the wind direction. 8. Pollutants stay in atmosphere for a long enough time (particles < 20µm)

Fixed Box Model Mathematical Expression Accumulation rate = All flow rates in - All flow rates out For a steady state situation: All f/rates out All f/rates in 1 2 3 0 + Creation rate - Destruction rate

Example 5. 1 A city has the following description: W= 5 km, L= 15 km, u= 3 m/s, H= 1000 m. The upwind, or background, concentration of carbon monoxide is b= 5µg/m 3. the emission rate per unit area is q= 4 x 10 -6 g/s m 2. What is the concentration c of carbon monoxide over the city?

Example 5. 2 A city with dimension W L H (7 km 13 km 1. 5 km) had a wind velocity of 4 m/s. The upwind concentration of SO 2 is 10 µg/m 3. The emission rate for the city is 4. 5 x 10 -6 g/s. m 2. What is the concentration of SO 2 over the city?

Fractional reduction in emission rate = Ann. Av. Pt. conc. - TSP Ann. Av. Pt. conc. - b
 in the U. S")
Example 5. 3 The ambient quality standard for particulates (TSP) in the U. S in 1971 was 75 µg/m 3 annual average. In 1970, the annual average particulate concentration measured at one monitoring station in Chicago was 190 µg/m 3. The background concentration was estimated to be 20 µg/m 3. By what percentage would the emission rate have to be reduced below the 1970 level in order to meet the 1971 ambient air quality standard?

Example 5. 4 A city consist of 3 parallel strips, located perpendicular to the wind. For all of the strips the wind velocity is 5 m/s. The background concentration of NOx entering the upwind suburbs is 1. 4 mg/m 3. The properties of each of the strips are describe below. Estimate the concentration of NO 2 at the downwind edge of the city. ? Name of trips Length (km) Emission rate (g/s. km 2) Mixing height (m) 6 150 380 Downtown 2. 5 550 450 Downwind suburbs 5 120 410 Upwind suburbs

GENERAL IDEAS IN AIR POLLUTION CONTROL

Alternatives of an air pollution problem • Improve dispersion – Tall stacks – Intermittent control schemes – Relocate the plant • Reduce emissions by process change, pollution prevention • Use a downstream pollution control device

50 years ago • Tall stacks to dilute the pollutants before they came to ground “Dilution is the solution to pollution”

• In sparsely populated area, the pollutant emissions are eliminated by natural removal mechanisms and without causing any damage to the neighbors • In a densely populated world, dispersion is not a satisfactory approach For example: The population density is 1 person/km 2 The population density is 29000 persons/km 2

• It will certainly decrease all the ground level concentration near the stack, but it may increase some concentration far from stack with a tall stack For example: Acid rain controversy SO 2 ultimately comes to the ground, mostly with rain or snow Raising the emission point of stack, may raise the concentration far downwind

Relocate the plant • The emission source should be far away from populated areas. Such as residential areas, commercial centers. • This reasoning is the basis for most industrial zoning and land use planning regulation

Reduce emission by process change, pollution prevention • Basic idea – Change from raw material, old process, old technology, into a cleaner process, to prevent pollution. This is the most economical control solution • Substitute water based paints for some of their oil based paints • Open burning of solid be carried out in closed incinerators, which have much better fuel air mixing and heat conservation • Coal is replaced by natural gas as a home or business fuel – In current US, there is a major effort to prevent pollution rather than control it
- Slides: 43