Factors influencing trip generation 1 Land use is


- Slides: 7
Factors influencing trip generation: 1 Land use is one of the major attributes of trip generation activities, different uses of land produce different trip generation rates. For example, land developed for shopping or office could be expected to generate more trips than that developed for residential use. 2 Family size: there is a relationship between the number frequencies of trips made from home as against the varying family size, average trip frequency
increases with the increasing persons per household at the rate approximately 0. 8 trips per day for each additional person. • 3 - Auto ownerships: increased auto ownership generates more trips per household • 4 - Family income: families with high income generally perform more trips than the low income household.
• To illustrate the trip generation process, three methods are considered: • 1 - Cross-classification (category analysis) • 2 - Regression analysis, which has been applied to estimate both trip productions and attractions. • 3 - Method of trip rate
Cross-Classification method • It is a disaggregated analysis, based on individual sample units such as persons, households. • Cross-classification is a technique developed by the Federal Highway Administration (FHWA) to determine the number of trips that begin or end at the home. The first step is to develop a relationship between socioeconomic measures and trip production. The two variables most commonly used are average income and auto ownership.
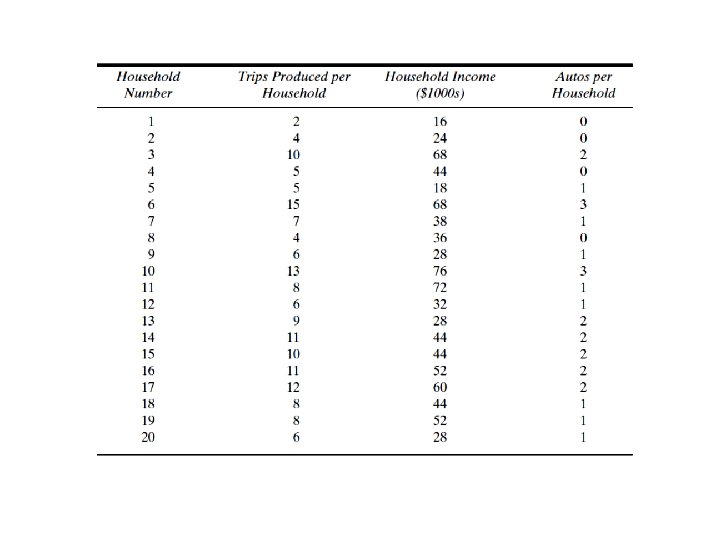
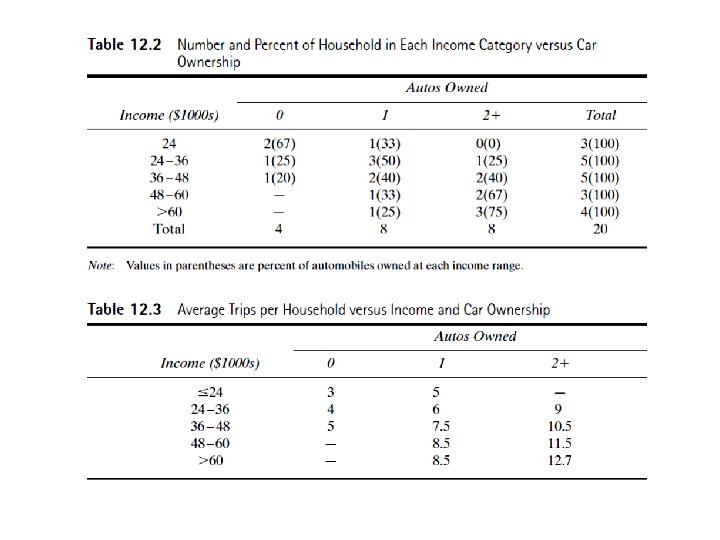
• Example 1: Developing Trip Generation Curves from Household Data • A travel survey produced the data shown in Table, Twenty households were interviewed. The table shows the number of trips produced per day for each of the households (numbered 1 through 20), as well as the corresponding annual household income and the number of automobiles owned. Based on the data provided, develop a set of curves showing the number of trips per household versus income and auto ownership.