Factor Graphs Variable Elimination MLEs Joseph Gonzalez Graphical

Factor Graphs, Variable Elimination, MLEs Joseph Gonzalez

Graphical Models and Distributions Review

Draw the Bayesian Network: A Parameters Binary Variables C A B D B C D E E

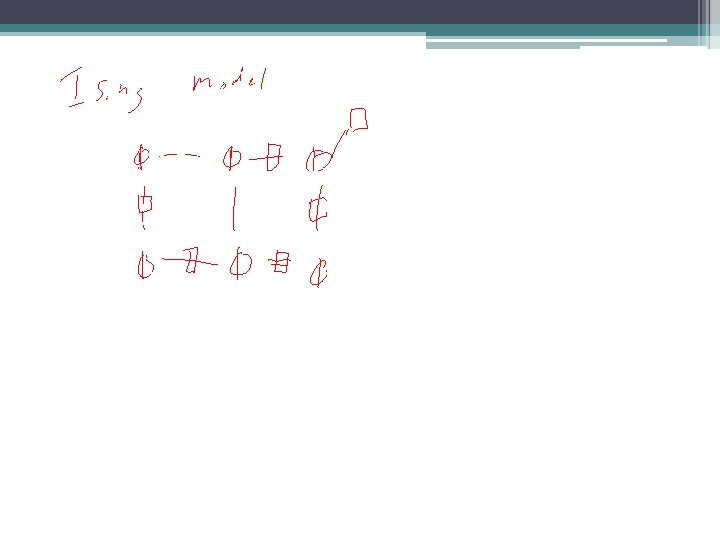
Draw the Factor Graph Variables A f 1 B f 2 C f 3 Factors D f 4 f 5 E f 6

Write down the Equation A B f 1 C f 2 D f 3 E f 4

Compute Z A B f 1 What’s wrong with? C f 2 D f 3 E f 4

Compute Z A B C D E 0 0 0 0 0 1 1 0 0 0 0 1 1 0 0 0 1 1 1 0 0 0 0 1 0 1 0 0 1 1 0 0 0 1 1 1 0 0 1 1 0 0 0 0 0 1 1 0 0 0 0 1 1 0 0 0 1 1 1 0 0 0 0 1 0 1 0 0 1 1 0 0 0 1 1 1 0 Product

Variable Elimination = Being Clever A B f 1 C f 2 D f 3 E f 4 D 0 1 D E f 4(d, e) 0 0 4 0 1 2 1 0 1 1 1 5 g 1 (d)

Variable Elimination = Being Clever A B f 1 C f 2 D f 3 E f 4 B C f 2(b, c) C D f 3(c, d) 0 0 3 0 0 2 0 1 1 1 0 3 1 1 4 B D 0 0 0 1 1 g 1(b, d)

Variable Elimination and Conditioning Query:

Pictorial Depiction of Elimination

Gaussian Distributions Goto Mathematica Random variables that approximately have Gaussian distributions:
: Likelihood")
The Likelihood X Observe i. i. d. data (independent and identically distributed): Likelihood

Maximizing the Likelihood of the Data Observe i. i. d. data (independent and identically distributed): Maximizing with respect to µ: This is difficult! What can we do?

Log is a Monotonic increasing function See Mathematica Notebook

Maximizing a concave function: See plot in Mathematica

Concave Functions: Not Concave or Convex and therefore difficult to maximize and minimize Easy to maximize and minimize
- Slides: 18