Facilty Layout Dr Ron TibbenLembke Layout Types Project

Facilty Layout Dr. Ron Tibben-Lembke

Layout Types �Project or Fixed-position layout �Process-oriented layout �Product-oriented layout �Office layout �Warehouse layout �Retail/service layout

Project or Fixed-Position �Design is for stationary project �Workers & equipment come to site �Complicating factors � Limited space at site � Changing material needs �Examples � Ship building � Highway construction

Process-Oriented Layout �Design places departments with large flows of material or people together �Dept. areas have similar processes � e. g. , All x-ray machines in same area �Used with process-focused processes �Examples � Hospitals � Machine shops

Process-Oriented Layout Table Saws Office © 1995 Corel Corp. Drill Presses Tool Room © 1995 Corel Corp.

Process Layout + Allows specialization - focus on one skill + Allows economies of scale - worker can watch several machines at once + High level of product flexibility -- Encourages large lot sizes -- Difficult to incorporate into JIT -- Makes cross-training difficult

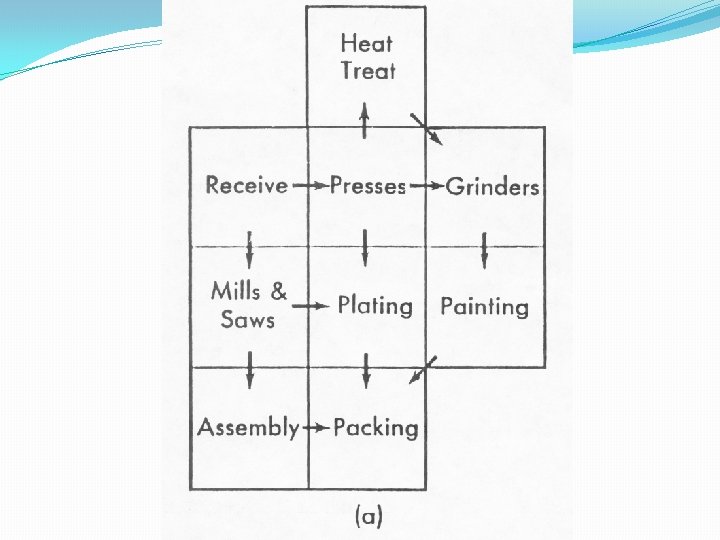
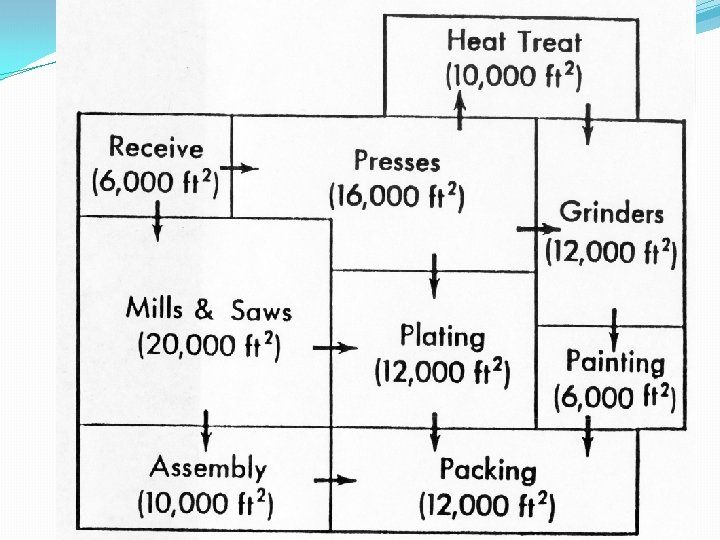
Process-Oriented Layout Steps �Construct ‘from-to-matrix’ �Determine space needs for each dept. �Develop initial schematic diagram �Determine layout cost, Xij • Cij �By trial-and-error, improve initial layout �Prepare detailed plan � Includes factors besides cost

Process-Oriented Example You work in facilities engineering. You want to find the cost of this layout. The cost of moving 1 load between adjacent dept. is $1. The cost between nonadjacent dept. is $2. Dept. 1 Dept. 4 Dept. 2 Dept. 5 Dept. 3 Dept. 6 40 ft. 60 ft. There are 6! or 720 possibilities! Clearly, we can’t look at them all.

From-to-Matrix 1 2 Department 3 4 1 2 Dept. 3 4 Number of Trips 5 6

Schematic Diagram & Cost 100 50 1 20 50 3 10 20 50 4 2 30 100 5 6 Dept. 1 1 1 4 4 4 2 2 3 3 2 6 2 3 5 5 3 6 Total Cost $ $ $ $ $ 200 50 40 50 10 30 100 $570

Schematic Diagram & Cost Dept. 30 2 50 1 100 10 50 20 20 4 50 5 1 1 1 4 3 4 4 2 100 2 3 Dept. 2 3 6 2 3 5 5 3 6 Cost $ $ $ $ $ 50 100 20 50 40 50 10 60 100 6 Total Cost $480

Product-Oriented Layout �Facility organized around product �Design minimizes line imbalance � Delay between work stations �Types: Fabrication line; assembly line �Examples � Auto assembly line � Brewery � Paper manufacturing.
 �Special case of process-oriented layout �Consists of different machines brought")
Cellular Layout (Work Cells) �Special case of process-oriented layout �Consists of different machines brought together to make a product �May be temporary or permanent �Example: Assembly line set up to produce 3000 identical parts in a job shop

Work Cell Floor Plan Saws Tool Room Drills Work Cell Office

Work Cell Advantages Reduces: Inventory Floor space Direct labor costs Increases: Equipment utilization Employee participation Quality

Work Cell Layout + Facilitates cross-training + Can easily adjust production volumes + Easy to incorporate into JIT -- Requires higher volumes to justify -- May require more capital for equipment

Office Layout Example
 3 &")
Relationship Chart 1 President 2 Costing Ordinary 1 closeness: 2 President (1) 3 & costing (2) O U 4 A 3 Engineering A I O 4 President’s Secretary I = Important; U = Unimportant Absolutely necessary: President (1) & secretary (4)

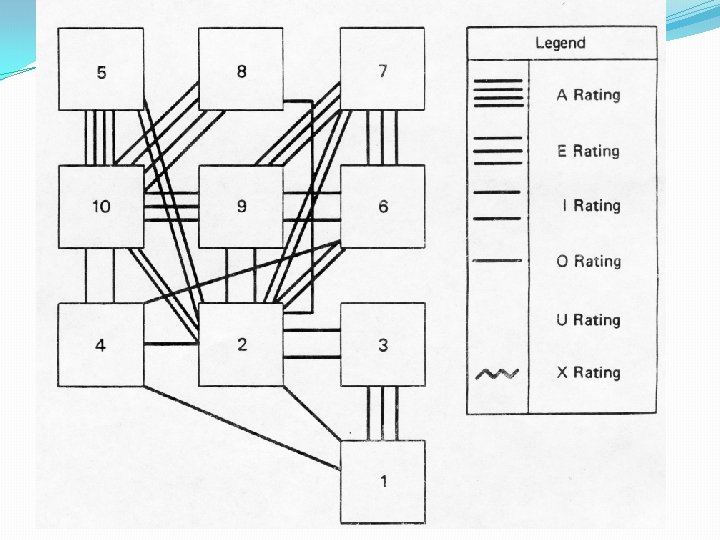
Relationship Chart 1 2 3 4 5 6 7 8 9 10 1 O I U U I E U U E 2 E O U OA U U E A 3 O I U U U I U 4 U I U U 5 U I U U A 6 U O U I 7 U I U 8 U I 9 10 U
 utilization & handling cost �Similar to process layout")
Warehouse Layout �Design balances space (cube) utilization & handling cost �Similar to process layout � Items moved between dock & various storage areas �Optimum layout depends on �Variety of items stored �No. items picked © 1995 Corel Corp.

Warehouse Flow Receiving Shipping

Warehouse Layout Try to organize storage in such a way that order pickers can move through the product in a logical and timely manner.

Warehouse Layout �Fastest near the front �Fastest within easy reach �Bulk storage vs. Single item picking �Serpentine vs. oval picking order �Restocking: frequency, safety stock

Cross-Docking In-coming �Transferring goods from incoming trucks at receiving docks to outgoing trucks at shipping docks �Avoids placing goods into storage Outgoing © 1984 -1994 T/Maker Co. © 1995 Corel Corp.

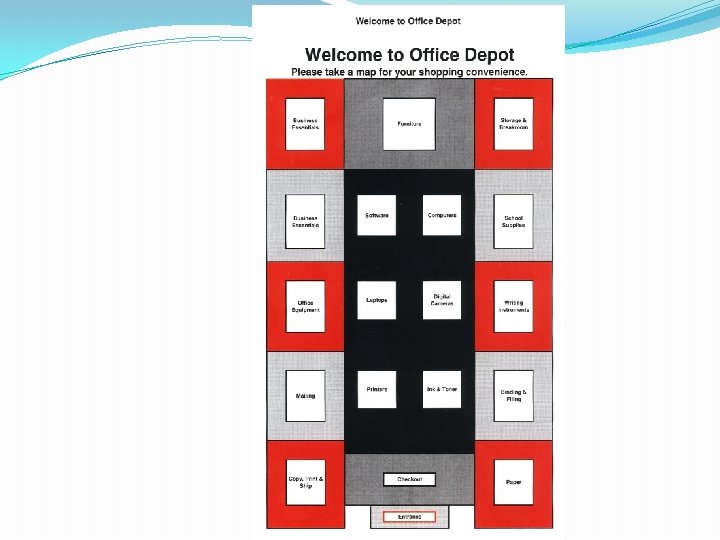
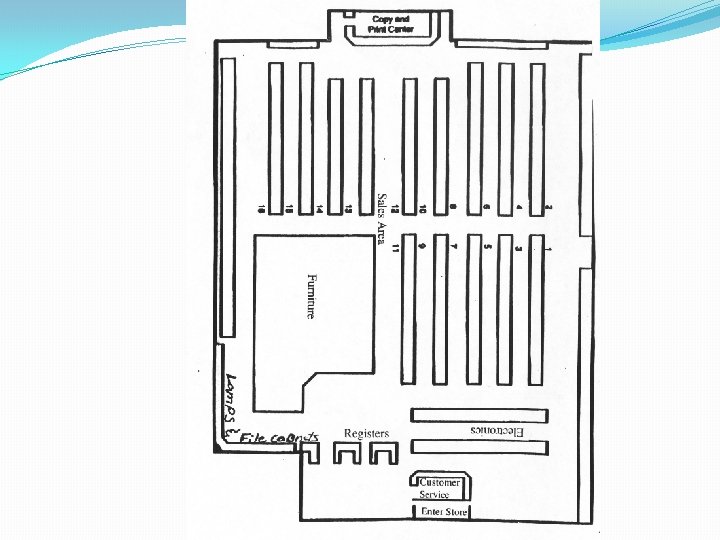
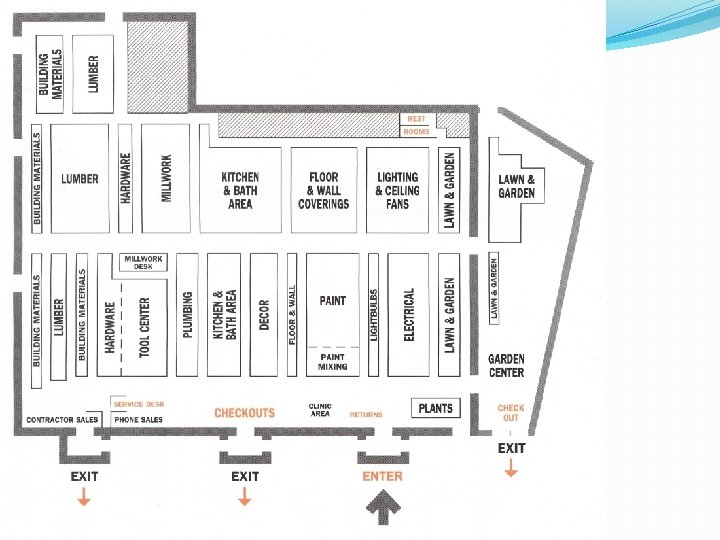
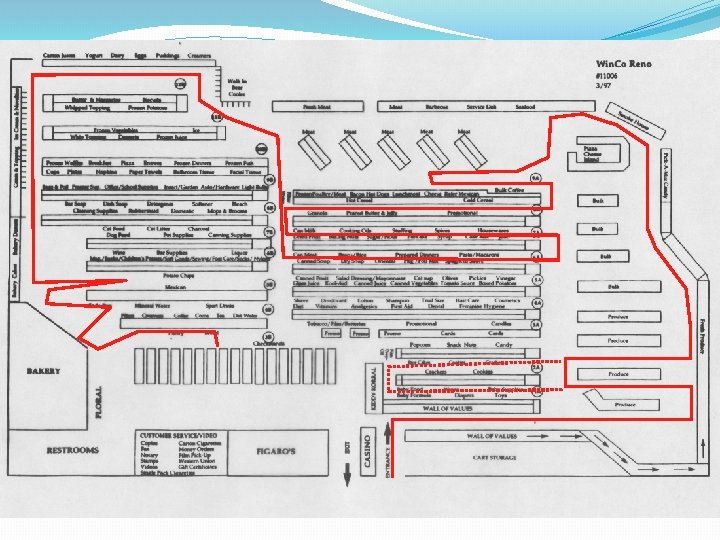
Retail/Service Layout �Design maximizes product exposure to customers, profitability per square foot �Decision variables � Store flow pattern � Allocation of (shelf) space to products �Types � Grid design Video � Free-flow design

Grid Design Grocery Store Meat Milk Bread Office Carts Checkout

Free-Flow Design Apparel Store Trans. Counter Feature Display Table

Retail Store Flow Guidelines � “Prisoner” aisles make you enter store in a particular route, and pass by certain displays � Often contain less profitable (for the store) brands � “Decompression Zone” people walk past first rows of items before settling into shopping mode.

Retail Store Flow Guidelines �Bakery, coffee shop, restaurant spread aromas by entrance to stimulate taste buds �Siren song of the Starbucks (Safeway) �Food samplers throughout store do same

Retail Store Flow Guidelines �Frequently purchased items at far sides of stores so you have to go through entire store (produce or meat). �Profitable sections like produce placed where you keep running into them Meat Milk Produce

Retail Store Flow Guidelines �Major items in middle of aisles so you have to walk down into middle of aisle (Cereal, peanut butter) �‘Power items’ on both sides of aisle so you have to look at both sides Peanut Butter Cereal

Retail Store Flow Guidelines �Quality of produce section important in customer decisions about which stores to visit, so produce is often prominently displayed upon entrance �People like to see what they’re looking for, not read signs Cereal Peanut Butter produce

Retail Flow Guidelines �End caps for highvisibility sale items �Large quantities of inventory serve as “psychic stock” �If there is a lot of it, it must be on sale �Stimulates sales © 1995 Corel Corp.

Retail Flow Guidelines �Eliminate cross-over aisles: �less wasted floor space, �you have to look at more items, �the more time you spend in the store, the more you will buy.

Shelf Space Planogram � Example: P&G 2 ft. SUAVE VO-5 PERT VO-5 PERT 5 facings PERT �Computerized tool for shelf-space management �Generated from store’s scanner data on sales �Often supplied by manufacturer

Shelf Placement �Companies prefer to be at eye-level or at childreaching level �Close to leading brands or high-draw items: snack foods next to the peanut butter or across from the cereal: �Lots of kids visit the area

Slotting Fees �Manufacturer pays retailer to get a product into a store � 35, 000 new grocery products per year �Grocery stores often stock 30, 000 items �Impossible to evaluate all new products to choose the best new ones �Slotting fees guarantee grocer profits on a product, help balance risk of trying unknown product. �Grocery is a narrow margin business, slotting fees can represent a significant revenue source.

Slotting Fees �Senate Small Business Committee held hearings on them in 2000. �Industry refused to cooperate with GAO. �Growers of produce (not just brand names) now getting involved and complaining. �Small businesses claim they can’t afford the big payments big companies can make. �Advocates say small companies can “put their money where their mouths are” just like anyone else

Perimeter Items �People follow perimeter pattern �Sale items on end – everyone sees �Half of a store’s profit comes from items on the perimeter �Breakfast cereal brings in the most dollars per square foot �Manufacturer incentives increase profitability of soft drinks �“Anchors” at ends of a section: milk and butter at opposite ends of dairy case
- Slides: 48