FACILITY LAYOUT Facility layout is a process of


 is also known as Operation Process")


 Activity - Specific task or job. 2) Event - Instant of")
 Activities: § Predecessor activity – Activities that must be accomplished before other activities.")
 Task Predecessor TIME A _ . 3 E C . 2")


 C (15, 5) A (35,")
- Slides: 42
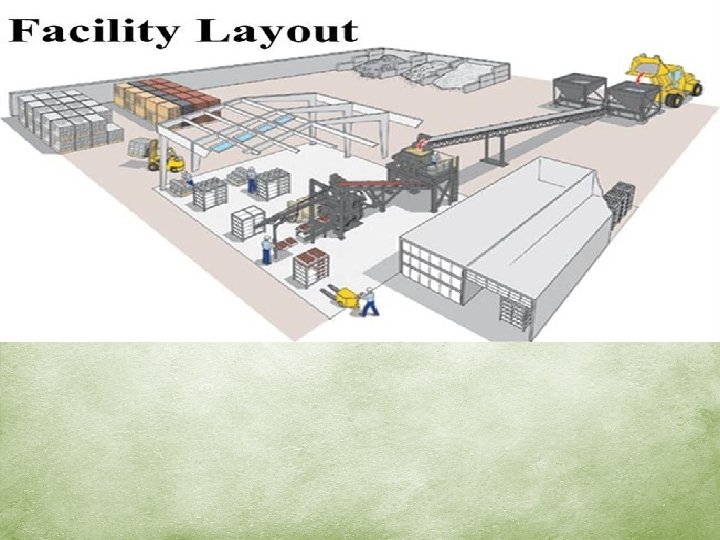
FACILITY LAYOUT Facility layout is a process of arranging all the tangible resources available in the production or a service facility in a manner to maximise productivity. RESOURCES – men material machine
PRINCIPLES OF GOOD FACILITY LAYOUT Ø Ø Ø Ø Ø Maximum safety Maximum utilisation of space Minimum distance and travel time Minimum investment Maximum coordination Sequence Maximum comfort Ease of access Maximum flexibility Minimum handling
OBJECTIVES OF FACILITY LAYOUT q q q q q AVAILABILITY OF ADEQUATE SPACE FOR WORK ENSURE SMOOTH FLOW OF WORK SAFETY OF WORKER COMFORTABLE WORK ENVIRONMENT MINIMUM MOVEMENT OF RESOURCES BETTER SUPERVISION AND MONITORING DECREASE IN OVERALL PRODUCTION TIME INCREASED UTILISATION OF MEN AND MACHINE FLEXIBILITY
TYPES OF FACILITY LAYOUT PROCESS LAYOUT PRODUCT LAYOUT COMBINATION LAYOUT FIXED LAYOUT CELLULAR LAYOUT
1. PROCESS OR FUNCTIONAL LAYOUT v All the activities or machines are arranged as per functions performed by them MACHINES HOMOGENEOUS FUNCTION GROUPED v Suitable where small quantities of large no. Of products are manufactured
PROCESS LAYOUT
PROCESS LAYOUT ADVANTAGES § Flexibility § Less capital intensive § Better utilisation of resources § Better exposure to workers DISADVANTAGES § Manual handling of material § Low pace of processing § Requirement of more space § Delayed detection of defective process § Requires proper scheduling of resources
2. PRODUCT OR LINE LAYOUT q Resources are arranged productwise i. e. Arranged in a line or a sequence to meet production requirement of a specific product. q Suitable where standardised products are manufactured in large quantities.
PRODUCT OR LINE LAYOUT
PRODUCT LAYOUT ADVANTAGES § § § § Uninterrupted flow of work Economies of large scale Automated handling of material Proper utilisation of resources Timely detection of defective good Less material handling cost Less space requirement LIMITATIONS § Less flexible § Heavy investment § Breakdown will cause idle time § Repetitive work § Speed dependence on slowest machine
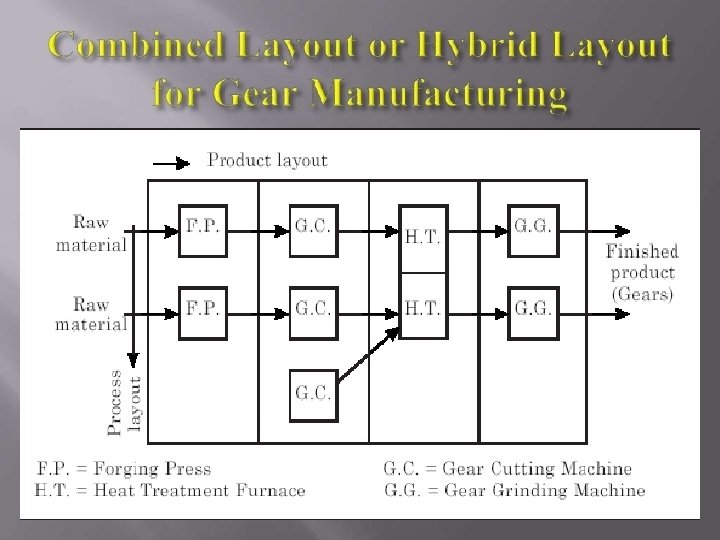
3. HYBRID OR COMBINATION LAYOUT PROCESS LAYOUT COMBINATION LAYOUT PRODUCT LAYOUT
4. FIXED LAYOUT Machines are installed at one place but men and material are moving from one place to another to carry on production.
FIXED LAYOUT ADVANTAGES • High flexibility • Less investment in layout • Scope of job enlargement LIMITATIONS • High equipment handling cost • Non availability of skilled labour • Underutilisation of men and machines • Duplication of tools
5. CELLULAR OR GROUP LAYOUT Machines that produce homogeneous products are divided into various groups called cells
FACTORS AFFECTING LAYOUT 1. PRODUCT – Heavy product – fixed layout Small product – product layout 2. VOLUME – Large scale production - line layout On specification of client – process layout
3. AREA More space – process layout 4. TYPE OF MACHINERYSPECIAL PRODUCTION PROCESS GENERAL PRODUCTION PROCESS PRODUCT LAYOUT PROCESS LAYOUT
4. TYPE OF MACHINERYMANUFACTURING PROCESS CONTINUOUS ANALYTICAL INTERMITTENT SYNTHETIC PRODUCT LAYOUT IRREGULAR PROCESS LAYOUT
6. METHODS OF PRODUCTION Methods of production Project Production FIXED LAYOUT Job Production Batch Production PROCESS LAYOUT 7. WORKING ENVIRONMENT 8. PLANT SITE 9. MATERIAL
Techniques of Layout Planning For laying out a plant there is no such universally accepted technique available. Application of one or more techniques depends upon many factors. These techniques can be divided into two main parts. COMPUTER MANNUAL BASED METHODS
1. Manual methods q Process layout: • Outline process chart • Flow diagram • String diagram • Travel chart • REL chart q Product layout : • Assembly line balancing
1. Outline Process Chart: Outline Process Chart (OPC) is also known as Operation Process Chart. It is a graphical representation of all the ‘Operations’ and ‘Inspections’ of the whole process It presents the raw material used, activity to be performed and the time taken by the operator for the different parts of the work. TIME OF EACH ACTIVITY ACTIVITIES The Standard Practices followed while making OPC is given below: • Write name at the top of the chart. • Use vertical lines in the downward direction to indicate the operations and inspections. • Describe the activity on the right side and time of each activity on left side of the standard symbols. • Label all operations in one serial order and inspections in another serial order.
Activity: Repair of punctured scooter type Chart begins: Scooter ready for jacking up Chart ends: Tube ready after repair to mount on tyre Method Charted by: ACTIVITY SYMBOL METHOD (PRESENT) 1 Jack up scooter 2 Remove hub-cap of wheel 3 Loosen nut and place properly 4 Remove a wheel 5 Remove outer cover 6 Remove rim 1 Locate the puncture in tube Operations 8 7 Mark the puncture Inspection 2 8 Repair the puncture and remove nails, if any 2 Recheck
2. Flow diagrams: They presents movement or flow of workers, material and equipments during the execution of a work or operation and indicates the direction of travel with the help of arrows, drawn on the diagram. According to Robert, L. Harris, “flow diagram is a graphic representation of the physical route or flow of peoples, materials, paperwork’s, vehicles, or communication associated with a process, procedure plan, or investigation. ”
Raw material store Raw material Forge shop Cutting shed Heat treatment section Part storage Inspection Assemble section Machine shop Milling section (Turning Section) FLOW DIAGRAM FOR MANUFACTURE OF BI-CYCLE PEDAL AXLE
3. String Diagram: The diagram records heavy movement and distance travelled of worker, material or equipment at the job. Thee string diagram is a scale plan or model on which a thread is used to measure and trace the path of workers, material or equipment during a specified sequence of events. • The layout plan of working area is fixed on a soft board. • The pins are put on the layout on stops and turning points of the worker. • A thread is woven on the pins as per movements of workers. • The thread is then measured to find the actual distance covered by the workers. The diagram is useful in following circumstances: üOne worker working on several machines. üSeveral workers working on a single machine.
STACK RIVERT FOLD DRILL RIVERT CUT CHECK MARK FOLD CHECK SHEET METAL MARK Symbol Meaning Storage “D” Delay SHEET METAL Symbol “O” STACK Meaning Operations Transportation Inspection
4. Travel Chart: The chart records heavy and regular movements in a working area. “A travel chart is a tabular record for presenting quantitative data about the workers materials or equipment between any numbers of places over any given period of time. ” Application • Several worker working on one machine. • One worker working on several machines. • Several workers working on several machines.
TO FROM Punching Trimming Shining Packaging Total Store 500 pieces 400 pieces 200 pieces 1100 Punching 50 pieces Trimming Shining Store 50 pieces 100 20 pieces 20 Packaging • Construction Each bigger square represents work station. of Travel chart • • Along top, squares towards right denotes stations to which travel Firstly, the a big (divided in small squares)the is drawn. andline down the left hand from where is made. • happens A diagonal is drawn from topdenotes left to bottom right movement square.
5. REL Chart: REL chart stands for relationship charts. These relationship charts records heavy movement between two work centres. It combines qualitative and quantitative aspect to decide about the layout. Construction : • Name all the departments on the relationship chart. • Outline the basis of determining closeness of relationship between departments. • Give rating or code for the relationship.
Rating Meaning Rating Reason A Absolutely necessary 1 High use E Especially important 2 Medium use I Important 3 Low use O Ordinary closeness 4 High flow U Unimportant 5 Medium flow X Undesirable 6 Low flow Store Punching Trimming Shining Packaging 1 A 4 O U 5 As in the example it is most important that The Store and The Punching operation are Close to one Another since the greatest number of journeys are made between these two stations.
2. Product layout : Assembly line balancing Under product layout all the production resources such as men, material and machine arranged in a line or a sequence. The raw materials move from one work station to another till it is converted into finished goods. Designing a product layout requires sequence of operations to be determined, assessment of speed to analyse volume of work done so that all work stations get equal work load. This whole process is called assembly line balancing.
Important Terms 1) Activity - Specific task or job. 2) Event - Instant of time when an activity starts or ends. NODE 3) Network - Graphical representation of activity. 4) Tail and Head Event - When an activity starts and; when an activity ends. A 3 TAIL EVENT HEAD EVENT
5) Activities: § Predecessor activity – Activities that must be accomplished before other activities. § Successor activity - One which starts immediately after completion of other activity. § Concurrent activity - Activities which can be performed simultaneously. Successor activity A Predecessor activity B D C Concurrent activity
Task Predecessor TIME(minutes) Task Predecessor TIME A _ . 3 E C . 2 B _ . 6 F D . 6 C A . 4 G E . 1 D B 1. 2 H F, G . 5 I H . 3 A B C E D G F H (minutes) I
A E C . 2 . 4 . 3 B D . 6 1. 2 F . 6 . 3 C . 4 E . 2 G . 1 I . 5 . 1 W/S # 2 1. 6 min. Total time Minimum = Idle Cycle timenumber = time Operating time Bof workstations. 6 1. 0 D required 1. 2 time Cycle Output A H G . 3 Output : 275 units/day Operating time : IDLE TIIME 440 = 0. 6 minutes min/day W/S # 3 1. 6 min. F. 6 1. 0. 5 0. 7 = 4. 2 min/unit 0. 4 = 2. 6 Hworkstations = 440 = 1. 6 min/unit I. 3 0. 2 0. 3 275 1. 6 min/unit = 3 workstations 0. 2 0. 1 0. 0 0. 4
2. Computer based methods Computer based layout planning methods are used in modern world to solve various process layout issues. These methods are divided into two categories i. e. Construction programs and improvement programs. Construction softwares • ALDEP • CORELAP Improvement softwares • CRAFT
1. Construction softwares : The softwares helps in designing a layout from the very beginning is called construction programs. • ALDEP: ALDEP is developed by IBM to solve issues created while constructing relationship charts. ALDEP stands for automated layout design program. STEPS: • It randomly selects first department. • If more than one department has similar relationship, it can choose any • It positions departments on upper left corner and start laying out departments downwards and then left to right continue laying bottom up and left and right
• CORELAP : It means computerised relationship layout planning and is one step forward to ALDEP Software. The software creates best layout on the basis of total closeness rating 2. Improvement Softwares : These softwares begin with an initial layout and make improvement through additional changes. More the number of departments, layout design may be in millions and trillions. Programs like ALDEP and CORELAP are used in these circumstances. The most popular software to improve layout design is CRAFT. • CRAFT: It stands for Computerised Relative Allocation Of Facilities Techniques. The software requires basic travel chart and load distance score to start its operations. Features : • It compares two adjacent departments and exchange them in layout pair wise. • It tries to reduce the overall cost. • Generally it can handle up to 40 departments.
Steps • Calculate centre point and rectilinear distance of all departments. • Find the cost of initial layout by multiplying the material flow, unit cost and distance i. e. F×C×D= TOTAL COST A B C D • Improve the layout by interchanging A -- 15 10 50 adjacent departments till B -- 20 5 a least total cost layout is found. Rectilinear Distance 20 10 0 A (5, 15) Centroid B (25, 15) D C (35, 5) (15, 5) 10 30 INITIAL LAYOUT 40 C D -- 10 -FLOW DATA Distance: A to B 20 units = |25 -5|+|15 -15| A to D 40 units =|35 -5|+|5 -15| B to D 20 units =|35 -25|+|5 -15| C to D 20 units =|35 -15|+|5 -5| Total movement cost = (20 x 15)+(20 x 10)+(40 x 50)+(20 x 20)+(20 X 5)+(20 x 10) = 3200
A B C 20 10 0 B (15, 15) C (15, 5) A (35, 15) D (35, 5) 30 A B C D D -- 15 10 50 -- 20 5 -- 10 -FLOW DATA 40 Total movement cost =(20 x 15)+(30 x 10)+(10 x 50)+(10 x 20) Distance: A 20 +(30 X 5)+(20 x 10) B A to B 20 units = |35 -15|+|15 -15| (5, 15) (25, 15) = 1650 A to D 10 units =|35 -35|+|5 -15| 10 D C B to D 30 units =|15 -35|+|15 -5| (35, 5) (15, 5) C to D 20 units =|35 -15|+|5 -5| 0 10 30 40 INITIAL LAYOUT Reduction in movement cost= 3200 -1650=1550