
Facility Layout 6 MULTIPLE Other algorithms Department Shapes


- Slides: 17
Facility Layout 6 MULTIPLE, Other algorithms, Department Shapes
MULTIPLE • MULTI-floor Plant Layout Evaluation (MULTIPLE) – Improvement type – From-To chart as input – Distance based objective function (rectilinear distances between centroids). – Improvements: Two way exchanges and steepest descent
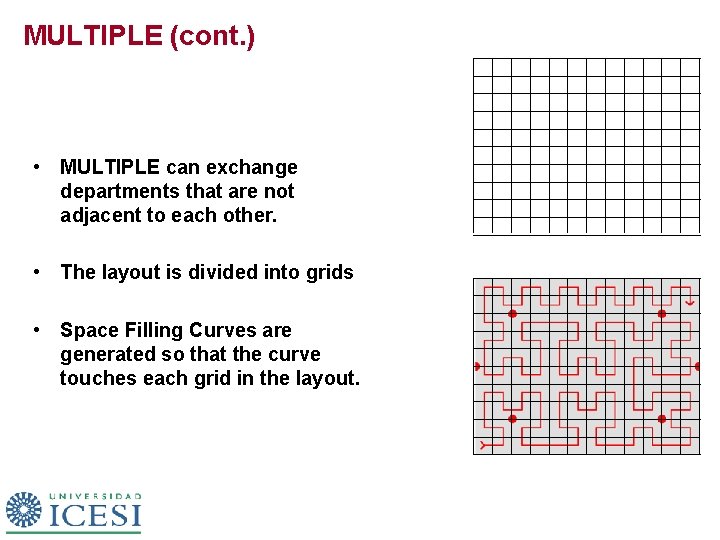
MULTIPLE (cont. ) • MULTIPLE can exchange departments that are not adjacent to each other. • The layout is divided into grids • Space Filling Curves are generated so that the curve touches each grid in the layout.
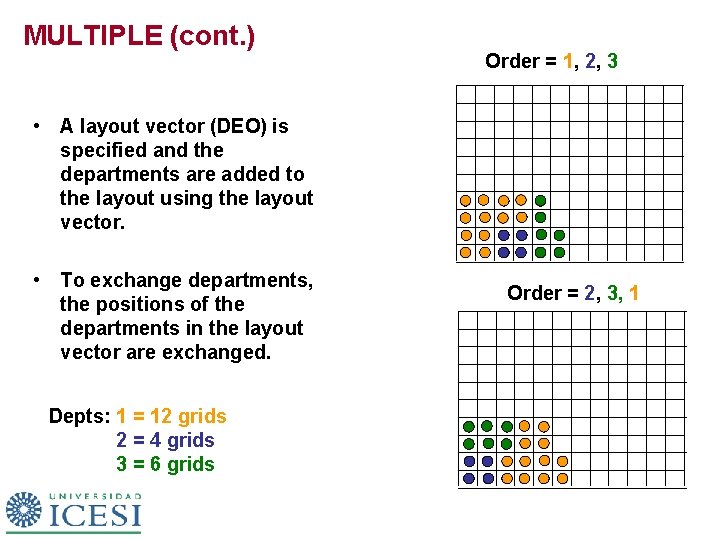
MULTIPLE (cont. ) Order = 1, 2, 3 • A layout vector (DEO) is specified and the departments are added to the layout using the layout vector. • To exchange departments, the positions of the departments in the layout vector are exchanged. Depts: 1 = 12 grids 2 = 4 grids 3 = 6 grids Order = 2, 3, 1
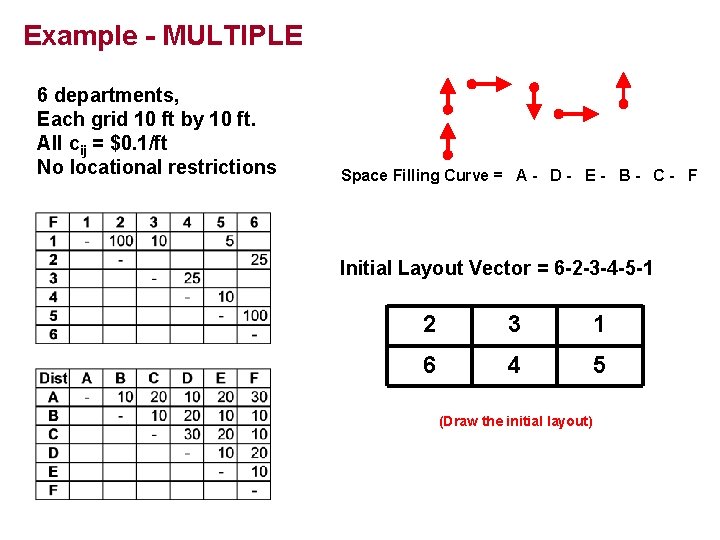
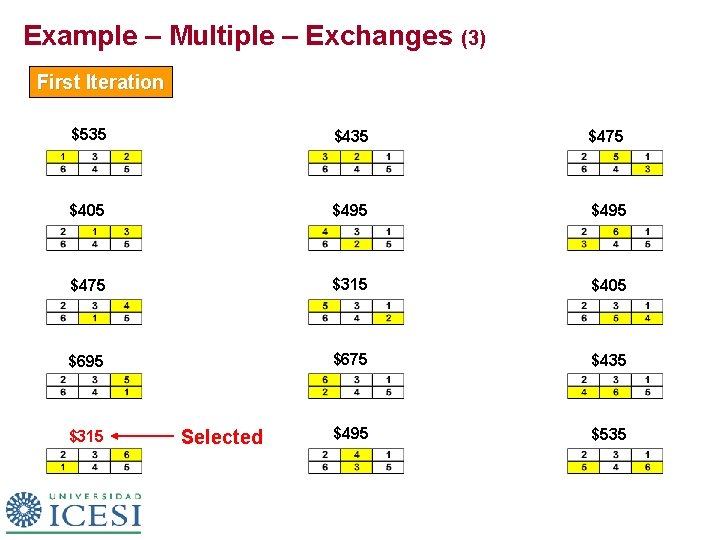
Example - MULTIPLE 6 departments, Each grid 10 ft by 10 ft. All cij = $0. 1/ft No locational restrictions Space Filling Curve = A - D - E - B - C - F Initial Layout Vector = 6 -2 -3 -4 -5 -1 2 3 1 6 4 5 (Draw the initial layout)
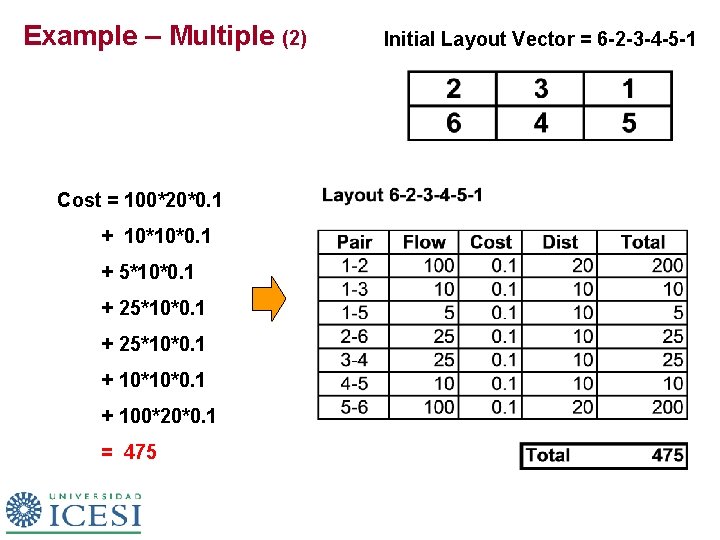
Example – Multiple (2) Cost = 100*20*0. 1 + 10*10*0. 1 + 5*10*0. 1 + 25*10*0. 1 + 100*20*0. 1 = 475 Initial Layout Vector = 6 -2 -3 -4 -5 -1
Example – Multiple – Exchanges (3) First Iteration $535 $475 $405 $495 $475 $315 $405 $695 $675 $435 $495 $535 $315 Selected
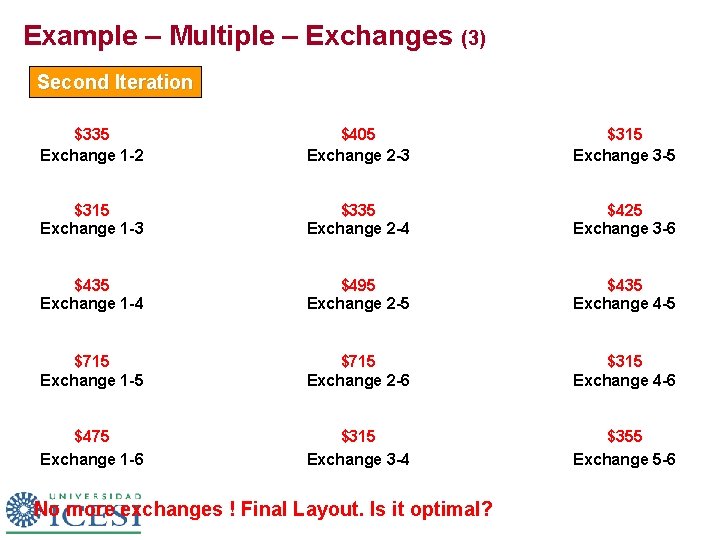
Example – Multiple – Exchanges (3) Second Iteration $335 Exchange 1 -2 $405 Exchange 2 -3 $315 Exchange 3 -5 $315 Exchange 1 -3 $335 Exchange 2 -4 $425 Exchange 3 -6 $435 Exchange 1 -4 $495 Exchange 2 -5 $435 Exchange 4 -5 $715 Exchange 1 -5 $715 Exchange 2 -6 $315 Exchange 4 -6 $475 Exchange 1 -6 $315 Exchange 3 -4 $355 Exchange 5 -6 No more exchanges ! Final Layout. Is it optimal?
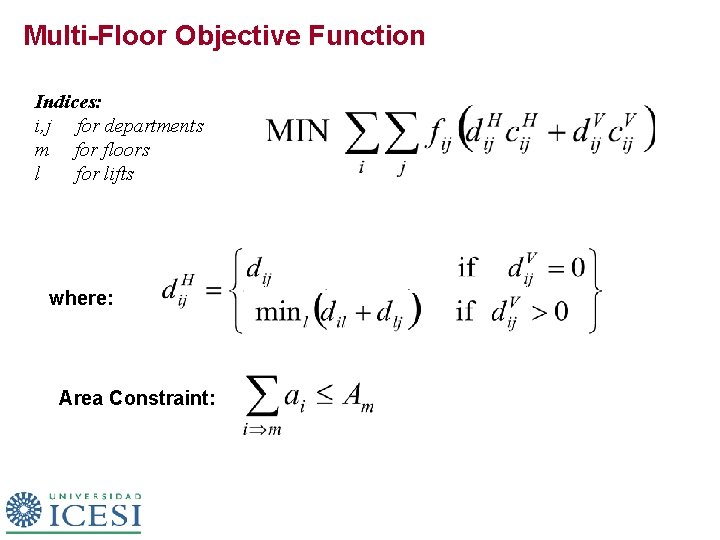
Multi-Floor Objective Function Indices: i, j for departments m for floors l for lifts where: Area Constraint:
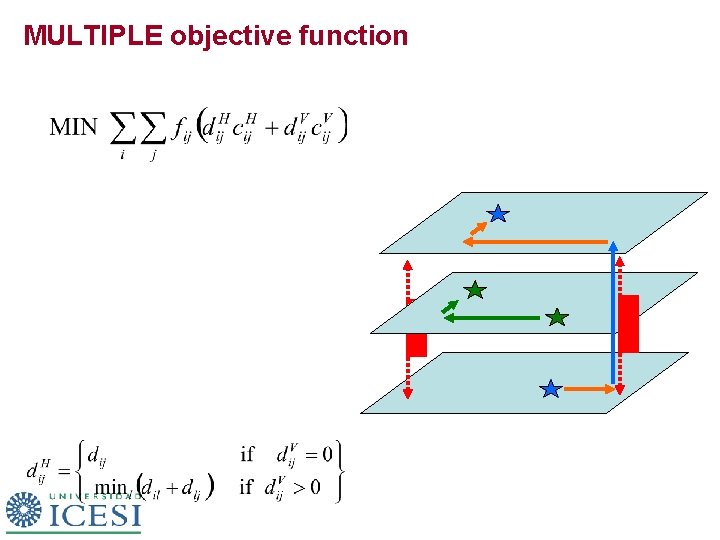
MULTIPLE objective function
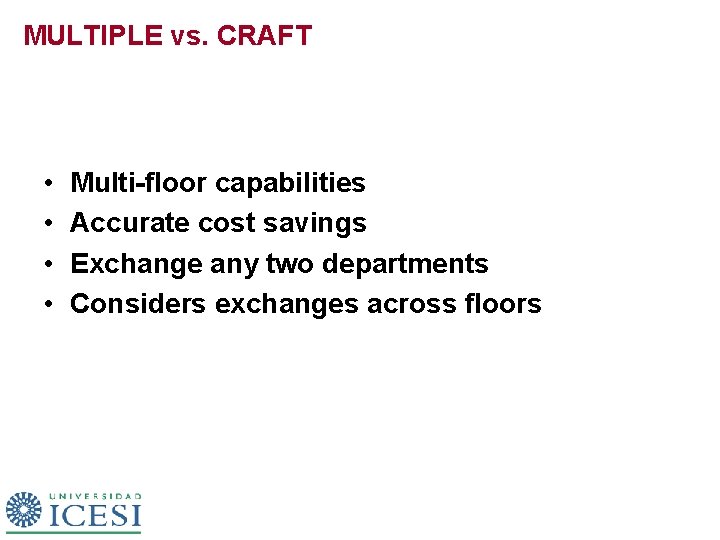
MULTIPLE vs. CRAFT • • Multi-floor capabilities Accurate cost savings Exchange any two departments Considers exchanges across floors
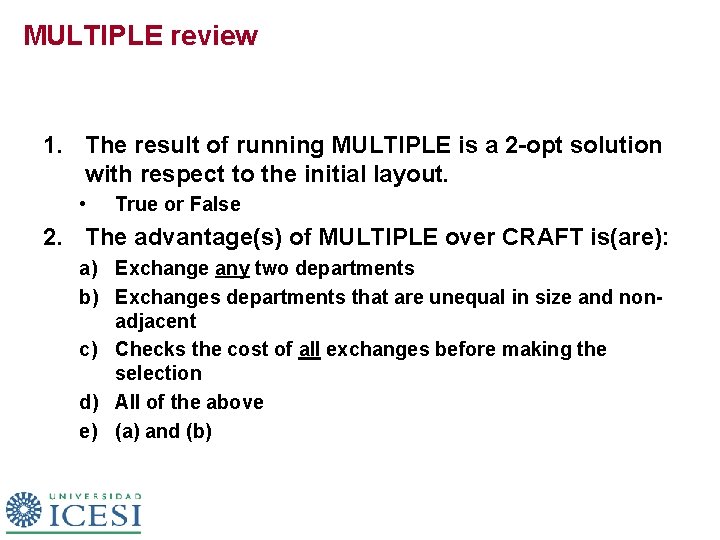
MULTIPLE review 1. The result of running MULTIPLE is a 2 -opt solution with respect to the initial layout. • True or False 2. The advantage(s) of MULTIPLE over CRAFT is(are): a) Exchange any two departments b) Exchanges departments that are unequal in size and nonadjacent c) Checks the cost of all exchanges before making the selection d) All of the above e) (a) and (b)
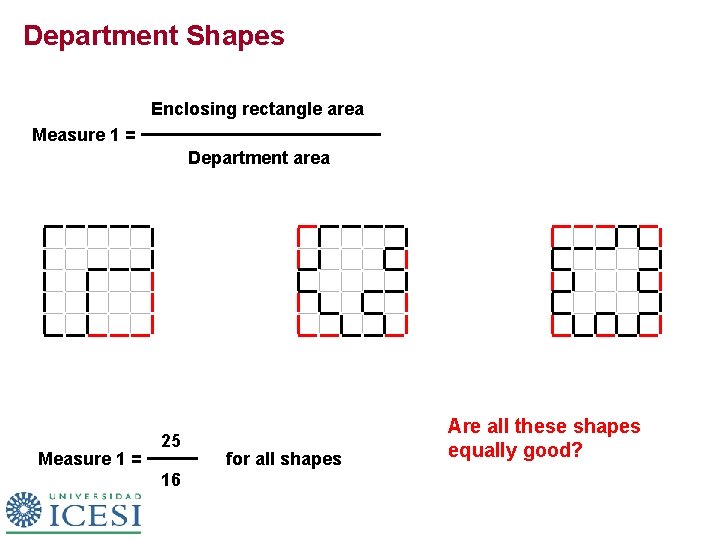
Department Shapes Enclosing rectangle area Measure 1 = Department area Measure 1 = 25 16 for all shapes Are all these shapes equally good?
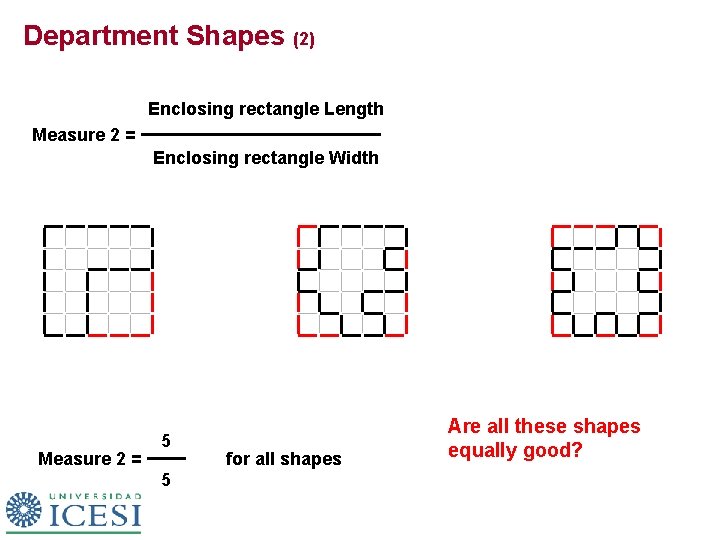
Department Shapes (2) Enclosing rectangle Length Measure 2 = Enclosing rectangle Width Measure 2 = 5 5 for all shapes Are all these shapes equally good?
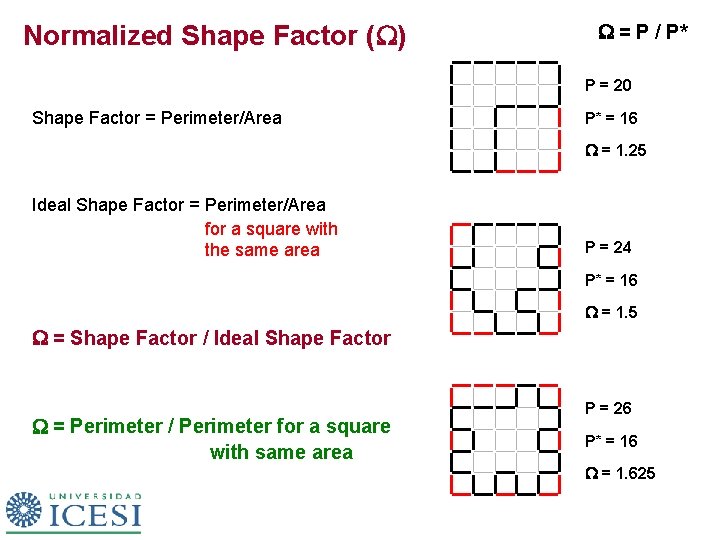
Normalized Shape Factor (W) W = P / P* P = 20 Shape Factor = Perimeter/Area P* = 16 W = 1. 25 Ideal Shape Factor = Perimeter/Area for a square with the same area P = 24 P* = 16 W = 1. 5 W = Shape Factor / Ideal Shape Factor W = Perimeter / Perimeter for a square with same area P = 26 P* = 16 W = 1. 625
Other Methods and Tools • MIP: – formulate the facility layout problem as a mixed integer programming (MIP) problem by assuming that all departments are rectangular. • SABLE: – Like MULTIPLE, but instead of steepest descent pair-wise exchanges, it uses simulated annealing to search for exchanges. – Less likely to get “stuck” in a local optima
Other Methods and Tools (Cont. ) • Simulated Annealing (SA) and Genetic Algorithms (GA) – All methods/tools based on steepest descent approach (forces an algorithm to terminate the search at the first two-opt or three-opt solution it encounters), result in a solution which is likely locally optimal. – Steepest descent algorithms are highly dependent on the initial solution (path dependent). – SA-based procedure may accept non-improving solutions several times during the search in order to “push” the algorithm out of a solution which may be only locally optimal. – GA is originated from the “survival of the fittest” (SOF) principle, which works with a family of solutions to obtain the next generation of solutions (good ones propagate in multiple generations)