Facilities Location Layout and Planning FACILITY PLANNING The


 movements ü")
 ü Used when quantitative data is not available ü Muther’s")


")


 ü Identify activities ü Establish precedence")


 ü Du. Pont & Remington-Rand (1956) ü Deterministic")
: developed in conjunction with the development of")


 The capacity of the firm to produce")


 - process of determining in detail the")


 • Brings together all plans for business • performed")


- Slides: 81
Facilities Location, Layout and Planning
FACILITY PLANNING • The placement of facility – customers, suppliers, other links in the supply chain • Resources • Strategy – 99 cents Only example • Access to customers • Government impacts
Objectives of Facility Layout ü Minimize material handling costs ü Utilize space efficiently ü Utilize labor efficiently ü Eliminate bottlenecks ü Facilitate communication and interaction between workers, between workers and their supervisors, or between workers and customers ü Reduce manufacturing cycle time or customer service time
Objectives of Facility Layout ü Eliminate waste or redundant movement ü Facilitate the entry, exit, and placement of material, products, or people ü Incorporate safety and security measures ü Promote product and service quality ü Encourage proper maintenance activities ü Provide a visual control of operations or activities ü Provide flexibility to adapt to changing conditions ü Increase capacity
Questions on Layout Planning • How should the facility be laid out? • Does my layout cause unnecessary movement/excess travel time? • Does my work flow in a logical manner? • Does size dictate layout or does layout/product flow dictate the size?
Basic Types of Layouts ü Process Layout ü Machines grouped by process they perform ü Product Layout ü Linear arrangement of workstations to produce a specific product ü Fixed Position Layout ü Used in projects where the product cannot be moved
Manufacturing Process Layout Lathe Department L L L L L Milling Department Drilling Department M M D D D D G G G P Grinding Department Receiving and Shipping Painting Department A A Assembly A
Manufacturing Process Layout Lathe Department L L L L L Milling Department Drilling Department M M D D D D G G G P Grinding Department Receiving and Shipping Painting Department A A Assembly A
Manufacturing Process Layout Lathe Department L L L L L Milling Department Drilling Department M M D D D D G G G P Grinding Department Receiving and Shipping Painting Department A A Assembly A
A Product Layout In Out
Fixed-Position Layouts ü Typical of projects ü Equipment, workers, materials, other resources brought to the site ü Highly skilled labor ü Often low fixed ü Typically high variable costs
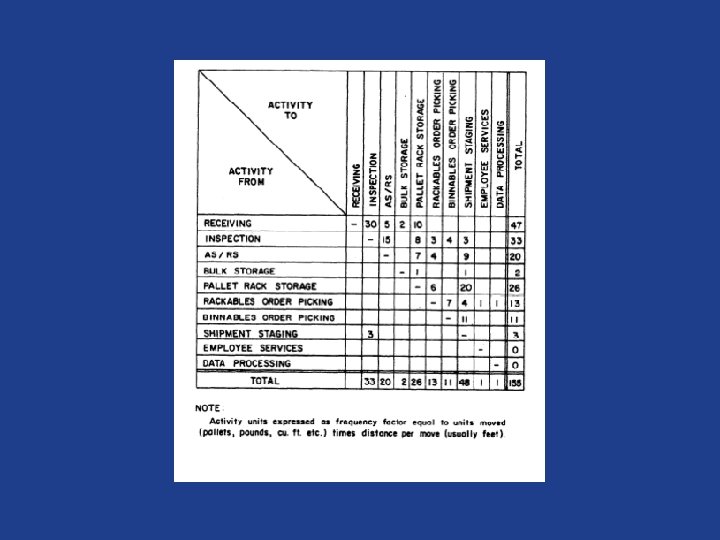
Designing Process Layouts ü Minimize material handling costs ü Block Diagramming ü Minimize nonadjacent loads ü Use when quantitative data is available ü Relationship Diagramming ü Based on location preference between areas ü Use when quantitative data is not available
Block Diagramming ü Create load summary chart ü Calculate composite (two way) movements ü Develop trial layouts minimizing number of nonadjacent loads ü Example
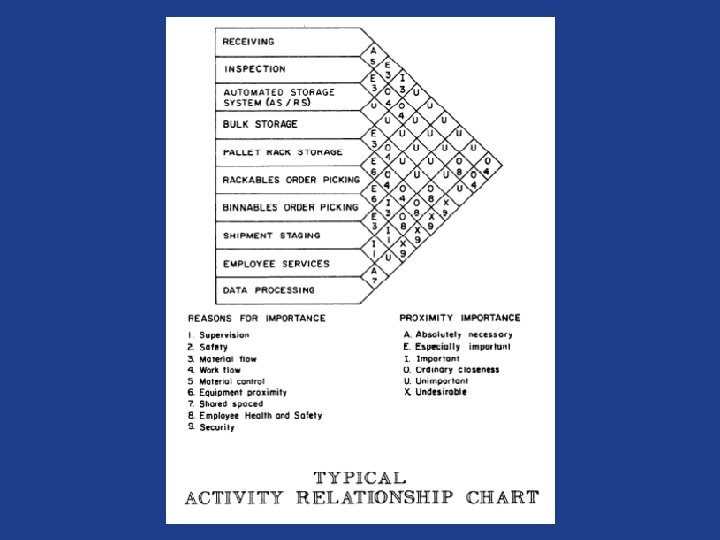
Relationship Diagramming (Murther’s Grid) ü Used when quantitative data is not available ü Muther’s grid displays preferences ü Denote location preferences with weighted lines
Relationship Diagramming Example Production Offices Stockroom Shipping and receiving Locker room Toolroom
Relationship Diagramming Example A Absolutely E Production Offices Stockroom Shipping and receiving Locker room Toolroom O U A U O A O U O I X O E U I O U X A necessary Especially important Important Okay Unimportant Undesirable
Relationship Diagramming Example 1 Absolutely 2 Production Offices Stockroom Shipping and receiving Locker room Toolroom 4 5 1 5 4 1 4 5 4 3 6 4 2 5 3 4 5 6 1 necessary Especially important Important Okay Unimportant Undesirable
Facility Location Models
Types Of Facilities ü Heavy manufacturing üAuto plants, steel mills, chemical plants ü Light industry üSmall components mfg, assembly ü Warehouse & distribution centers ü Retail & service
Factors in Heavy Manufacturing Location ü Construction costs ü Land costs ü Raw material and finished goods shipment modes ü Proximity to raw materials ü Utilities ü Labor availability
Factors in Light Industry Location ü Construction costs ü Land costs ü Easily accessible geographic region ü Education & training capabilities
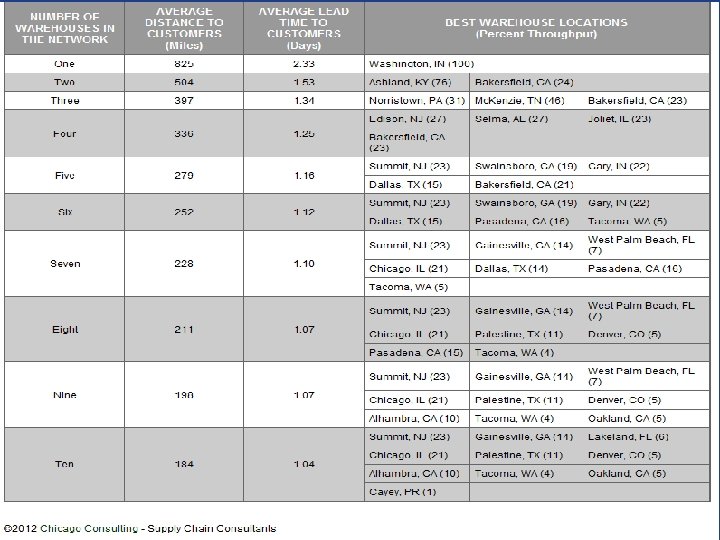
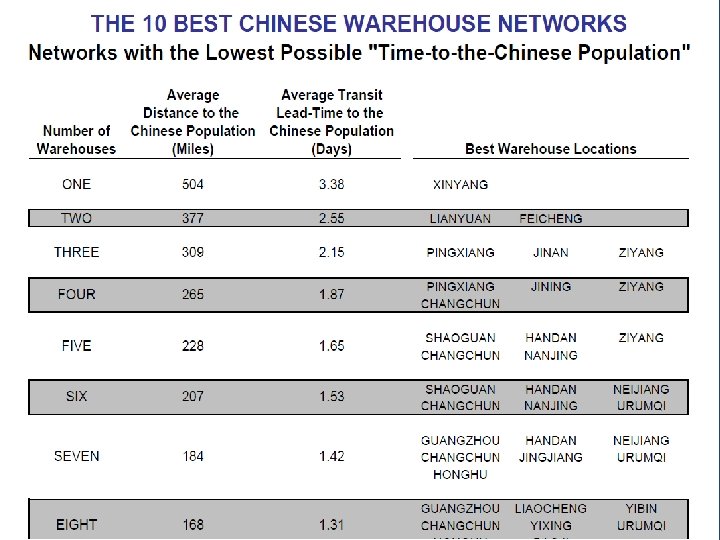
Factors in Warehouse Location ü Transportation costs ü Proximity to markets (Customers)
Service Location Considerations • • • Labor Cost of Living Real Estate Construction Government Incentives Examples – Amoco, Mass St, Tattoo Parlors, Walgreen’s
Global Location Factors ü Government stability ü Government regulations ü Political and economic systems ü Economic stability and growth ü Exchange rates ü Culture ü Climate ü Export import regulations, duties and tariffs ü Raw material availability ü Number and proximity of suppliers ü Transportation and distribution system ü Labor cost and education ü Available technology ü Commercial travel ü Technical expertise ü Cross-border trade regulations ü Group trade agreements
Regional Location Factors ü Community government ü Local business regulations ü Government services ü Business climate ü Community services ü Taxes ü Availability of sites ü Financial Services ü Community inducements ü Proximity of suppliers ü Education system
Site Location Factors ü Customer base ü Construction/ leasing cost ü Land cost ü Site size ü Transportation ü Utilities ü Zoning restrictions ü Traffic ü Safety/security ü Competition ü Area business climate ü Income level
Location Incentives ü Tax credits Wal-Mart in Wyandotte ü Relaxed government regulation ü Job training ü Infrastructure improvement ü Money
Center-of-Gravity Technique ü Locate facility at center of geographic area ü Based on weight and distance traveled ü Establish grid-map of area ü Identify coordinates and weights shipped for each location
Facility Summary • Why is it important? • Location analysis • Location Criteria – global, local, regional - education • Location and Strategy • Location and Customers • Layout planning
Project Management and Operations
Project Management First Essay on Project Management: 1697 – “An Essay Upon Projects” 1959 HBR Article – “The Project Manager” Air Force Manual 1964
Project Management In today’s global marketplace, complexity and speed are certainties. In such an environment, a good axiom for project management is, Do It Right, Do It Right Now. Creating clear direction, efficiency, timely response, and quality outcomes requires project managers who are agile -- adept at change. The associated disciplinary areas are clearly spelled out in the following PMI definition. “Project management is the application of knowledge, skills, tools, and techniques to a broad range of activities in order to meet the requirements of a particular project. Project management is comprised of five Project Management Process Groups – Initiating Processes, Planning Processes, Executing Processes, Monitoring and Controlling Processes, and Closing Processes. Source: Project Management Institute - http: //www. pmi. org/info/PP_About. Profession. Overview. asp? nav=0501
Elements of Project Management ü Project team ü Individuals from different departments within company ü Matrix organization ü Team structure with members from different functional areas depending on skills needed ü Project manager - Leader of project team ü Project Charter – high level description of what is to be accomplished in a project and delegates authority to project manager to implement actions to complete project
Project Planning ü Statement of work ü Written description of goals, work & time frame of project ü Activities require labor, resources & time ü Precedence relationship shows sequential relationship of project activities
Elements of Project Planning ü Define project objective(s) ü Identify activities ü Establish precedence relationships ü Make time estimates ü Determine project completion time ü Compare project schedule objectives ü Determine resource requirements to meet objective
Work Breakdown Structure ü Hierarchical organization of work to be done on a project ü Project broken down into modules ü Modules subdivided into subcomponents, activities, and tasks ü Identifies individual tasks, workloads, and resource requirements
Project Control ü All activities identified and included ü Completed in proper sequence ü Resource needs identified ü Schedule adjusted ü Maintain schedule and budget ü Complete on time
A Gantt Chart Around since 1914 ü Popular tool for project scheduling ü Graph with bar for representing the time for each task ü Provides visual display of project schedule ü Also shows slack for activities ü Amount of time activity can be delayed without delaying project
Gantt Charts Gantt described two principles for his charts: 1. measure activities by the amount of time needed to complete them 2. the space on the chart can be used the represent the amount of the activity that should have been done in that time. Gantt charts were employed on major infrastructure projects including the Hoover Dam and Interstate highway system and still are an important tool in project management.
A Gantt Chart 0 | 2 | Month 4 | 6 | 8 | Activity Design house and obtain financing Lay foundation Order and receive materials Build house Select paint Select carpet Finish work 1 Figure 6. 2 3 Month 5 7 9 10
Example of Gantt Chart Problem
CPM/PERT ü Critical Path Method (CPM) ü Du. Pont & Remington-Rand (1956) ü Deterministic task times ü Project Eval. & Review Technique (PERT) ü US Navy, Lockheed ü Multiple task time estimates
PERT/CPM Program Evaluation and Review Technique (PERT): developed in conjunction with the development of the Polaris missile program for submarines – developed by the US Navy with Lockheed as the lead contractor Critical Path Method (CPM): developed through a joint venture between the Du. Pont Corporation and the Remington Rand Corporation – the original purpose was to monitor and evaluate plant maintenance management projects.
Project Network for a House Lay foundation 1 3 Design house and obtain financing 2 3 2 Dummy 0 1 Order and receive materials 4 Select paint Build house 1 1 5 Figure 6. 4 6 3 Select carpet Finish work 1 7
Critical Path ü A path is a sequence of connected activities running from start to end node in network ü The critical path is the path with the longest duration in the network ü Project cannot be completed in less than the time of the critical path
The Critical Path 1 3 Lay foundation 2 3 Design house and obtain financing 2 Dummy Build house 0 1 Order and receive materials 4 Select paint Finish work 6 3 1 1 Select carpet 5 A: 1 -2 -3 -4 -6 -7 3 + 2 + 0 + 3 + 1 = 9 months B: 1 -2 -3 -4 -5 -6 -7 3 + 2 + 0 + 1 + 1 = 8 months C: 1 -2 -4 -6 -7 3 + 1 + 3 + 1 = 8 months D: 1 -2 -4 -5 -6 -7 3 + 1 + 1 = 7 months 1 7
The Critical Path 3 Lay foundation 2 3 1 Build house 0 1 2 Design house and obtain financing Dummy Order and receive materials 4 Select paint Finish work 6 3 1 1 7 1 Select carpet 5 Activity Start Times 3 Start at 5 months 2 1 3 2 0 1 4 6 3 1 1 Start at 3 months 5 Figure 6. 6 Finish at 9 months 1 7 Start at 8 months
Project Crashing ü Crashing is reducing project time by expending additional resources ü Crash time is an amount of time an activity is reduced ü Crash cost is the cost of reducing the activity time ü Goal is to reduce project duration at minimum cost
Time-Cost Relationship ü Crashing costs increase as project duration decreases ü Indirect costs increase as project duration increases ü Reduce project length as long as crashing costs are less than indirect costs
Life Cycle Management • Long term view of projects to guide decision making – solutions that provide life time success vice short term • Acquisition; development; production; introduction; sustainment; disposal • Links system costs to big picture; better use of resources; minimize total cost of ownership
Capacity and Aggregate Planning
Capacity Outputs: Examples
The goal of capacity planning decisions (1) The capacity of the firm to produce the service or good (2) The processes for providing the service or making the good (3) The layout or arrangement of the work space (4) The design of work processes to enhance productivity
Capacity • The max output that an organization be capable of producing • Measure a single facility: – Design vs. Effective capacity – Capacity Utilization: design vs. efficient utilization • For systems have more than one facility and flows of product – System capacity and bottleneck – Improve system capacity
Determinants of Effective Capacity • Facilities • Human considerations – Adding people – Increasing employee motivation • Operations – Improving operating rate of a machine – Improving quality of raw materials and components • External forces – Safety regulations
Capacity Utilization Measures how much of the available capacity is actually being used: – Always <=1(percentage of usage) – Higher the better – Denominator: • If effective capacity used: efficient utilization • If design capacity used: design utilization
Aggregate Planning • The process of planning the quantity and timing of output over the intermediate range (3 -18 months) by adjusting production rate, employment, inventory • Master Production Schedule: formalizes the production plan and translates it into specific end item requirements over the short to intermediate horizon
Capacity Planning • The process of determining the amount of capacity required to produce in the future. May be at the aggregate or product line level • Master Production Schedule anticipated build schedule • Time horizon must exceed lead times for materials
Capacity Planning • Look at lead times, queue times, set up times, run times, wait times, move times • Resource availability • Material and capacity - should be in synch • driven by dispatch list - listing of manufacturing orders in priority sequence - ties to layout planning • load profiles - capacity of each section
the capacity decisions: • • When to add capacity How much capacity to add Where to add capacity What type of capacity to add • When to reduce capacity
Capacity Planning • Rough Cut Capacity Planning process of converting the master production schedule into requirements for key resources • capacity requirements plan - timephased display of present and future capacity required on all resources based on planned and released orders
Capacity Planning • Capacity Requirements Planning (CRP) - process of determining in detail the amount of labor and machine resources required to meet production plan • RCCP may indicate sufficient capacity but the CRP may indicate insufficient capacity during specific time periods
Theory of Constraints • Every system has a bottle neck • capacity of the system is constrained by the capacity of the bottle neck • increasing capacity at other than bottle neck operations does not increase the overall capacity of the system
Theory of Constraints • What needs to be changed • What to change to • How to make the change happen
Theory of Constraints • • • Identify the constraint Subordinate Inertia Walk the process again inertia of change can create new bottle necks
Capacity Planning ü Establishes overall level of productive resources ü Affects lead time responsiveness, cost & competitiveness ü Determines when and how much to increase capacity
Capacity Expansion ü Volume & certainty of anticipated demand ü Strategic objectives for growth ü Costs of expansion & operation ü Incremental or one-step expansion
Sales and Operations Planning (S&OP) • Brings together all plans for business • performed at least once a month • Internal and external
Adjusting Capacity to Meet Demand 1. Producing at a constant rate and using inventory to absorb fluctuations in demand (level production) 2. Hiring and firing workers to match demand (chase demand) 3. Maintaining resources for high demand levels 4. Increase or decrease working hours (overtime and undertime) 5. Subcontracting work to other firms 6. Using part-time workers 7. Providing the service or product at a later time period (backordering)
Demand Management ü Shift demand into other periods ü Incentives, sales promotions, advertising campaigns ü Offer product or services with countercyclical demand patterns ü Partnering with suppliers to reduce information distortion along the supply chain
Remedies for Underloads 1. Acquire more work 2. Pull work ahead that is scheduled for later time periods 3. Reduce normal capacity
Remedies for Overloads 1. Eliminate unnecessary requirements 2. Reroute jobs to alternative machines or work centers 3. Split lots between two or more machines 4. Increase normal capacity 5. Subcontract 6. Increase the efficiency of the operation 7. Push work back to later time periods 8. Revise master schedule
Scheduling as part of the Planning Process
Scheduling • Scheduling is the last step in the planning process? • It is one of the most challenging areas of operations management. • Scheduling presents many day-to-day problems for operations managers because of – – Changes in customer orders Equipment breakdowns Late deliveries from suppliers A myriad of other disruptions
Objectives in Scheduling Ø Ø Ø Ø Ø Meet customer due dates Minimize job lateness Minimize response time Minimize completion time Minimize time in the system Minimize overtime Maximize machine or labor utilization Minimize idle time Minimize work-in-process inventory Efficiency
Sequencing Rules Ø Ø Ø Ø Ø FCFS - first-come, first-served LCFS - last come, first served DDATE - earliest due date CUSTPR - highest customer priority SETUP - similar required setups SLACK - smallest slack CR - critical ratio SPT - shortest processing time LPT - longest processing time
Critical Ratio Rule CR considers both time and work remaining time remaining work remaining due date - today’s date remaining processing time If CR > 1, job ahead of schedule If CR < 1, job behind schedule If CR = 1, job on schedule Ties scheduling to Gantt Chart or PERT/CPM