Facilitators of School Improvement Lisa Guzzardo Asaro Lisa


 Special Education Handout • Created Common Core Essential Elements (CCEEs)")

 Stages and Steps")


 Component One Executive Summary (All Schools")

")


 DID IT WORK? Implementation: Adult")
 Stages and Steps")


 I adopt:")


 Activity 1. Get into groups of three. 2. Locate your")
")


 INFRACTIONS GRADE 9 10")


")


 INFRACTIONS GRADE 9 10")


 using these sentence stems Ø I believe")
 INFRACTIONS GRADE 9 10")


- Slides: 100
Facilitators of School Improvement Lisa Guzzardo Asaro Lisa Rivard January 2013
Michigan Continuous School Improvement How to Survive Data Overload “Data are useless without a good analysis. ” SIX STEPS Begin with a Question The Data Source The Big Picture Team Dialogue Guide: Moving from Data to Classroom Instruction Patterns in Data Patterns for Students Handout • Discovery TAB TWO • Take Back
TAB TWELVE Today’s Outcomes • Provide ASSIST and Requirement updates • Engage in activities that connect you to Michigan’s continuous school improvement process • Heighten awareness of how the Ladder of Inference influences data selection • Receive a presentation from Troy School District • Use a 3 -phase, data dialogue protocol to analyze current school data • Use the 5 Whys protocol
TAB TWELVE • • • Today’s Roadmap Welcome Connector: Data Overload Updates and Changes ASSIST Components of a CNA Ladder of Inference Data Dialogue Protocol 5 Whys: root cause Troy School District Presentation Tool for Learning Schools Network and Planning
Key Working Agreements A Facilitation Tool • Respect all Points of View • Be Present and Engaged • Honor Time Agreements • Get All Voices in the Room These breathe life into our Core Values
Parking Lot A Facilitation Tool • Rest questions that do not benefit the whole group • Place questions that do not pertain to content at this time • Place questions that pertain, but participants do not want to ask at this time
LIVING BELIEF STATEMENT “Networking is not an option, but a critical part of how Facilitators of School Improvement learn and share their learning. ”
ADVANCED MI and MDE UPDATES AND CHANGES
New MDE Website Houses Important URL http: //www. michiganccr. org This website has been created to connect users with the resources available for helping all students graduate career and college ready. • • Effective Instruction Balanced Assessment Accountability Supporting Quality Educators Infrastructure P-20 Resources Success Stories
TAB TWELVE Handout
Professional Learning Opportunities • Assessing the Impact with Joellen Killion March 12 -13, 2013 NCA Building • Common Core: Leading the Change March 19, 2013 MISD Rm. 100 A-C • MDE/Advanc. ED Spring SI Conference April 17 -18, 2013 Lansing Center • MAISA Michigan ELA Model Curriculum Units June 24 -27, 2013 Teams Lansing Center • Kagan Structures for Cooperative Learning and Active Engagement Institute August 12 -16, 2013 MISD
TAB TWELVE Smarter Balanced Assessment Consortium • In October, higher education faculty and K-12 teachers teamed up at a 5 -day workshop to draft initial Achievement Level Descriptors (ALD) for summative assessments. • This will help students, teachers, and parents interpret student scores on the SBAs. • The draft initial ALDs are available for public review and comment through January 15. The documents are located on the Smarter Balanced website: http: //www. smarterbalanced. org/achievement-level-descriptors-andcollege-readiness/ • ELA and Math Claims: Summative Assessment Handout
TAB TWELVE Spring 2013 SBA Pilot Test • Smarter Balanced is gearing up to test drive the assessments. • The Pilot Test will include several thousand items and performance tasks, giving the Consortium important information about how the items and tasks perform in a realworld setting. • Participation in the Pilot Test is voluntary and all schools in Michigan are eligible. – Two types of schools: • 1) scientifically-selected schools were notified 12. 04. 12 and • 2) schools can volunteer by completing the volunteer registration form at http: //www. surveymonkey. com/s/Smarter. Blanced. Pilot To complete the survey, you will need your school’s National Center for Educational Statistics (NCES) number. – Volunteer schools will be tested in mid-April to mid-May – Only one content area will be assessed/grade within a school – Schools should plan on 3 hours of testing • Important to remember that the PURPOSE is a tryout of test items and the test interface, not an assessment of student learning. Students will not receive SCORES.
Dynamic Learning Maps (DLM) Special Education Handout • Created Common Core Essential Elements (CCEEs) in ELA and Math which are linked to the CCSS • These provide alternate grade level content standards linked to the CCSS and are available for review • Visit the MDE MI-Access website at www. michigan. gov/mi-access • Alternate assessments based on the CCEEs are being developed by the DLM alternate assessment consortium and will be available for use in Michigan starting in the 2014 -2015 school year • See handout
MAISA Collaborative Project Update • MAISA Units • Phase III – ELA Curriculum Leadership Team (K-12 timeline) – Math Curriculum Leadership Team
One Common Voice – One Plan Michigan Continuous School Improvement (MI-CSI) Stages and Steps Gather Getting Ready Collect School Data Build School Profile Do Implement Plan Monitor Plan Evaluate Plan Student Achievement Plan Develop Action Plan Study Analyze Data Set Goals Set Measurable Objectives Research Best Practice
One Common Voice – One Plan TAB TWELVE Gather Michigan Continuous School Improvement Stages and Steps Handout • Getting Ready • Collect School Data • Build School Profile Ø I. Executive Summary Ø IV. School Process Rubrics Study • Analyze Data Ø II. School Data Analysis Ø IV. School Process Analysis • Set Goals • • Plan Do Comprehensive Needs Assessment III. Additional Requirements V. Goals and Plan • Set Measurable Objectives • Research Best Practice • Develop Action Plan • Implement Plan • Monitor Plan • Evaluate Plan • VI. Evaluation Tool (2014) School Improvement Plan
TAB TWELVE Handout
Handout TAB TWELVE MDE NCA
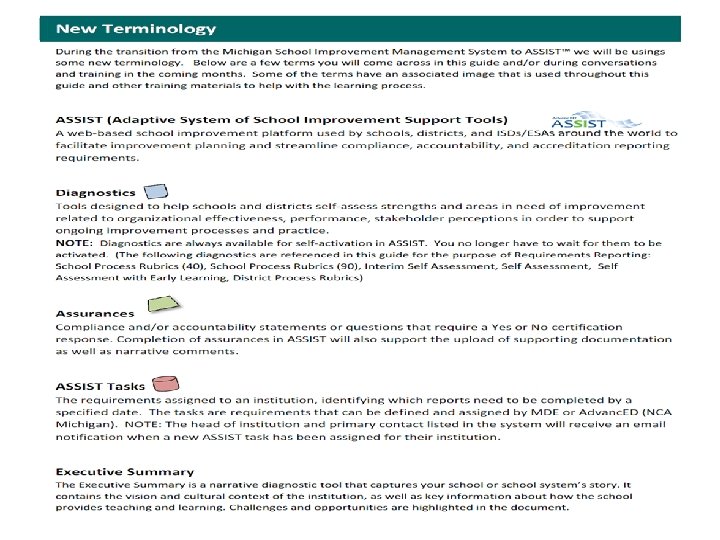
MDE Updates BLUE Report RED ASSIST TAB • ASSIST Updates – Not all School Data Profiles (40/90 OR ISA/SA) have been fully activated on Advanc. ED as an assigned task in the Overview Tab. (Was to be done by Break) – Diagnostics can be started at anytime by logging into ASSIST and using the Diagnostics and Surveys Tab – Title I Components and SIPs will be available on ASSIST with the 02. 09. 13 push (schools can activate a SIP by using the Goals and Plan Tab – Demographic information can be updated by using the Profile Tab and clicking on the Demographic link (EEM trumps everything) – The old SDP/A questions will be located in the Diagnostic Tab after the 02. 09. 13 push and will be called School Data Analysis • Questions Handout
TAB TWELVE Schools Handout Comprehensive Needs Assessment (CNA) Component One Executive Summary (All Schools Yearly) Due 09. 01. 13 Component Two School Data Analysis (Updates) Due 09. 01. 13 • • Student Performance Diagnostic (5 th year) 4 wks. prior to External Review Date Stakeholder Feedback Diagnostic (5 th year) prior to External Review Date Component Three Additional Requirements for Title I SW &TA, and Non-Title I Schools Due 09. 01. 13 Component Four School Process Rubrics: Component Five MDE Rubrics 40/90 Advanc. ED MI ISA/SA Goals and Plan (All Schools every 3 to 5 years) Due 09. 01. 13 Component Six Strategy Evaluation Tool (All schools 2 nd year in Reading and Math) DUE 04. 01. 13
District CNA Component I: Due 04. 15. 13 OR 4 wks. Prior to an External Review District Process Rubrics (DPR) OR District Interim Self Assessment (ISA)/District Self Assessment (SA) Component II: Due 06. 28. 13 District Improvement Plan (DIP) ALERT: Districts may request submission of SIPS as early as 04. 01. 13, to complete their DIPs. ASSIST Technical Guide is located at: Macombfsi. net ASSIST TAB OR http: //www. advanc-ed. org/webfm_send/372
Executive Summary Component I. • • Vision Mission Belief Statements Strengths/Challenges (See Slide 11)
Challenges Matrix I Activities Connection to SPP SPR 40/90 OR ISA/SA How will we address the targeted areas in your Process Data (SPP)? What areas in your process data have been identified as challenge areas during your comprehensive needs assessment process? Getting Ready to Implement Monitoring Fidelity of Implementation and Impact
MATRIX ISA/SA From your Executive Summary Report Handout
School Data Analysis Component II. Advanc. ED Michigan MDE Diagnostics School Data Analysis Student Performance Diagnostic Stakeholder Feedback Diagnostic (perception surveys) (Was the Data Profile) External Review (ER) 5 th. Year Update Yearly SPDA Type Questions HANDOUT
Additional Requirements Component III. Content has been aligned, unduplicated, and flagged to meet multiple requirements. Unique diagnostics are available for Title I SW, TA, and Non Title I schools (This could include Priority and Focus Diagnostics and Reform and Redesign Plans).
TAB TWELVE School Process Rubrics Component IV. MDE NCA
MI-CSI Framework
Michigan School Improvement Framework Strand I Teaching for Learning Strand III Strand IV Strand V Leadership Personnel & Professional Learning School and Community Relations Data and Information Management Standards (12) and Benchmarks (26) 1. Curriculum • Aligned, Reviewed & Monitored • Communicated 2. Instruction • Planning • Delivery 3. Assessment • Aligned to Curriculum and Instruction • Data Reporting and Use 1. Instructional 1. Personnel Leadership Qualifications Educational • Requirements Program • Skills, · Instructional Knowledge, Support Dispositions 2. Shared 2. Professional Leadership Learning • School Culture • Collaboration and Climate • Content & • Continuous Pedagogy Improvement • Alignment 3. Operational Resource Management • Resource Allocation • Operational Management 1. Parent/Family Involvement • Communication • Engagement 2. Community Involvement • Communication • Engagement 1. Data Management • Data Generation, Identification & Collection • Data Accessibility • Data Support 2. Information Management • Analysis & Interpretation • Applications
Advanc. ED Michigan 5 Standards Standard 3: Teaching and Assessing for Learning Standard: The school’s curriculum, instructional design, and assessment practices guide and ensure teacher effectiveness and student learning. 3. 1 The school’s curriculum provides equitable and challenging learning experiences that ensure all students have sufficient opportunities to develop learning, thinking, and life skills that lead to success at the next level. 3. 2 Curriculum, instruction, and assessment are monitored and adjusted systematically in response to data from multiple assessments of student learning and an examination of professional practice. 3. 3 Teachers engage students in their learning through instructional strategies that ensure achievement of learning expectations. 3. 4 School leaders monitor and support the improvement of instructional practices of teachers to ensure student success. 3. 5 Teachers participate in collaborative learning communities to improve instruction and student learning 3. 6 Teachers implement the school’s instructional process in support of student learning 3. 7 Mentoring, coaching, and induction programs support instructional improvement consistent with the school’s values and beliefs about teaching and learning. 3. 8 The school engages families in meaningful ways in their children’s education and keeps them informed of their children’s learning progress. 3. 9 The school has a formal structure whereby each student is well known by at least one adult advocate in the school who supports that student’s educational experience. 3. 10 Grading and reporting are based on clearly defined criteria that represent the attainment of content knowledge and skills and are consistent across grade levels and courses. 3. 11 All staff members participate in a continuous program of professional learning. 3. 12 The school provides and coordinates learning support services to meet the unique learning needs of students.
Goals & Plan Component V.
www. macombfsi. net Component VI. Stage Do Step 11
EVALUATE ADULT IMPLEMENTATION AND IMPACT ON STUDENT ACHIEVEMENT (Summative) DID IT WORK? Implementation: Adult Focused MONITOR ARE STRATEGIES AND ACTIVITIES BEING IMPLEMENTED AS INTENDED WITH FIDELITY? ARE WE COLLECTING & USING STUDENT AND ADULT DATA TO MODIFY & ADJUST ONGOING IMPLEMENTATION? Impact: Student Focused EVALUATE MONITOR WAS THE PROGRAM IMPLEMENTED AS INTENDED? DID WE IMPLEMENT THE PLAN/STRATEGIES CORRECTLY & CONSISTENTLY? DID WE GIVE IT ENOUGH TIME? RESOURCES? IS WHAT WE ARE DOING WORKING? ARE WE SHOWING EVIDENCE OF STUDENT GROWTH? WHAT INTERIM ADJUSTMENTS ARE SUGGESTED BY IMPLEMENTATION DATA? HOW MIGHT THESE ADJUSTMENTS AFFECT THE INTEGRITY OF THE RESULTS? EVALUATE DID OUR STRATEGIES RESULT IN INCREASED STUDENT ACHIEVEMENT? WHAT UNINTENDED CONSEQUENCES (GOOD AND BAD) HAVE OCCURRED? SHOULD THE STRATEGY/ACTIVITY BE CONTINUED? DISCONTINUED? MODIFIED? MONITOR ADULT IMPLEMENTATION AND IMPACT ON STUDENT ACHIEVEMENT (Formative) IS IT WORKING?
One Common Voice – One Plan Michigan Continuous School Improvement (MI-CSI) Stages and Steps Gather Getting Ready Collect School Data Build School Profile Do Implement Plan Monitor Plan Evaluate Plan Student Achievement Plan Develop Action Plan Study Analyze Data Set Goals Set Measurable Objectives Research Best Practice
Stage One: GATHER Step 1: Getting Ready GATHER Getting Ready Collect School Data Build School Profile
“In God we trust, everyone else brings DATA”
One Common Voice – One Plan Stage One Gather: Step 2 Collect School Data s n o i t i in What do you already know? f e D What data do you need to know? What additional information/data do you need to know? Where can the information/data be found? Demographic or Contextual Data Describes our students, staff, building, and community Achievement Student Outcome Data Process Data Perception Data Opinions of The policies, How our students procedures, and staff, parents, perform on local, systems we have community and state and federal students in place that assessments define how we do regarding our (subgroups) school business
Tab Two Page 3 -4 What types of data are/are not readily available in your building? Demographic Data • Enrollment • Subgroups of students • Staff • Attendance (Students and Staff) • Mobility • Graduation and Dropout • Conference Attendance • Education status • Student subgroups • Parent Involvement • Teaching Staff • Course enrollment patterns • Discipline referrals • Suspension rates • Alcohol‐tobacco‐drugs violations • Participation extra‐curriculars • Physical, mental, social and health Achievement/ Outcome Data • Local assessments: District Common Assessments, Classroom Assessments, Report Cards • State assessments: MME, ACT, MEAP, MI-Access, MEAP Access, ELPA • National assessments: ACT Plan, ACT Explore, ACT Work. Keys, NWEA, ITBS, CAT, MET NAEP, PSAT • GPA • Dropout rates • College acceptance 40 Process Data Perception Data • Policies and procedures (e. g. grading, homework, attendance, discipline) • Academic and behavior expectations • Parent participation – PT conferences, PTO/PTA, volunteers • Suspension data School Process Profile Rubrics (40 or 90) or SA/SAR (NCA) • Event occurred: who, what, when, where, why, how • What you did for whom: Eg. All 8 th graders received violence Prevention • Survey data (student, parent, staff, community) • Opinions • Clarified what others think • People act based on what they believe • How do they see you/us?
School Data Profile
Data Statements Observation Statements
Ladder of Inference • We live in a world of self-generating beliefs that remain largely untested. • We adopt these beliefs because they are based on our conclusions, which are inferred from what we observe, plus our past experience. • Our ability to achieve the results we truly desire is eroded by our feelings that: – – Our beliefs are the truth; The truth is obvious; Our beliefs are based on real data; The data we select are the real data.
Ladder of Inference cont’d • The ladder of inference explains how we generate assumptions, how we make observations and assessments, then act upon them. • First, we select data that makes sense to us and we want to hear. Next, we add meaning to the data based on our experience and our frame of reference. Then we make an assumption about the original data, draw a conclusion, and act on or advocate a belief based on the filtered data.
Source: Schools that Learn: A Fifth Discipline Handbook for Educators, Peter Senge Each trip up the ladder affects what data we select next time.
Ladder of Inference • • • I take: actions (based on beliefs) I adopt: beliefs (about the world) I draw: conclusions I make: assumptions (based on meaning added) I add: meanings (cultural and personal) I select: “Data” (from what I observe) Observable “data” and experiences start here.
One Common Voice – One Plan Michigan Continuous School Improvement Stages and Steps Gather Getting Ready Collect School Data Build School Profile Do Implement Plan Monitor Plan Evaluate Plan Student Achievement Plan Develop Action Plan Study Analyze Data Set Goals Set Measurable Objectives Research Best Practice
Stage Two: Study Step 4: Analyze Data STUDY Analyze Data Set Goals Set Measurable Objectives Research Best Practice
Reminder of our Adaptive Schools Work Data-Driven Dialogue Slides 51 -71 are the work of Paul Robinson, Utica’s District Improvement Facilitator
Why Data-Driven Dialogue? • Data have no meaning on its own. Meaning is a result of human interaction (socially mediated) with data. • Knowledge, meaning and commitment result from dialogue (everything is on the table) around the story the data is telling.
“Assessment illiteracy is surely a prescription for professional suicide. ” James Popham, 2004
What is a data-driven dialogue? A data-driven dialogue is: • A conversation where members of a professional learning community examine a particular issue using dialogue. • A way to reflect and learn about our practices, programs, our students, and our teaching. • A way to facilitate collective meaning-making, connections, and shared understandings. • A way to turn our insights into actions that promote and improve student and staff learning.
“Dialogue can occur only when a group of people see each other as colleagues in mutual quest for deeper insight and clarity. ” Peter Senge, The Fifth Discipline 55
Most Important Point (MIP) Activity 1. Get into groups of three. 2. Locate your book (Got Data? Now What? ) and turn to pages 100 -104. 3. Each person reads either the Dialogue, Discussion or Decision section and reports out the Most Important Point of the reading to other members of the group. 4. Be prepared to share your conversation 56 with the whole group.
Data-Driven Dialogue (Dialogue Discussion Decision)
Dialogue vs. Discussion? • Dialogue is a reflective learning process, seeking to understand (use opening tools) another’s viewpoint. • Discussion is where participants attempt to reach decisions (use narrowing tools) through a variety of voting and consensus techniques.
Dialogue vs. Discussion Dialogue Discussion thinking holistically thinking analytically making connections making distinctions surfacing and inquiring into assumptions developing shared meaning developing agreement or action seeking understanding seeking decisions
Why dialogue… • Creates shared understanding and shared goals. • Creates ownership. • Leads to collaborative planning • Leads to collaborative problem-solving • Leads to collective action plans
Requires… – Careful and active listening – Being open to new ideas – Focusing on the goal of developing a shared understanding – Depersonalize yourself from the data – Data becomes a “thing” – tells a story – Role of decision making is clear before the dialogue – Practice
To collaborate – A process through which parties who see different aspects of a problem (lens) can constructively explore their differences and search for solutions that go beyond their own limited vision of what is possible. Barbara Gray 62
Collaborative Learning Cycle A framework that establishes a learning forum for group exploration of data.
Collaborative Learning Cycle Phase I – Activating & Engaging Phase 2 – Exploring & Discovering Phase 3 – Organizing Integrating
The Collaborative Learning Cycle Organizing & Integrating Activating & Engaging Exploring & Discovering
Collaborative Learning Cycle
Phase I – Activating & Engaging • Assumptions about learners and learning • Surface predictions and assumptions (note on separate sheets of chart paper) to the data to be explored • Predictions are accompanied with assumptions • Person who lists a prediction should also share the underlying assumption • Surface perspectives (lens) and create readiness for looking at data • Seek to understand, not persuade • Share what the data might look like • No right or wrong statements • No debate in this phase • Everyone offers their thoughts – equity focus • Data free
Activating and Engaging • Members share what they think they will see in the data and make predictions. • Share underlying assumptions associated with those predictions. • Explore predictions and assumptions and develop an awareness of them so those feelings and beliefs do not interfere.
Predictions • I know. . . • Something you expect to see in the data • Experienced-based conjectures regarding what group members expect might appear in the data Assumptions • Because. . . • Something that you think but that will not show up in the data • Remain tacit and unquestioned
Activating and Engaging Use the following questions: • What are our underlying feelings about data? • What are some predictions we are making? • With what assumptions are we entering? • What are some questions we are asking? • What are some possibilities for learning that this experience presents to us?
Identifying Predicting or Assumption Statements 1. The boys will outperform girls by at least 10% points in Mathematics. 2. Boys brains are wired differently than girls when it comes to Mathematics. 3. All of the Fall 2011 scores will drop due to the new state cut scores. 4. Economically Disadvantaged early elementary students struggle with Reading because they are not developmentally ready to read. 5. The students in the 5 th grade will gain one year’s academic growth in Mathematics from Fall 2011 to Fall 2012. 6. The graduating class of 2014 will display scores less than the state. That group of students never scores well on tests.
Data Driven Dialogue 3 MAIN Phases: 1. Generating Predictions – Surfacing perspectives, beliefs, assumptions 2. Analyzing the Data (Observations) – Analyzing data for patterns, trends, surprises 3. Organizing and Integrating: Inferences – Generating hypotheses, explaining, drawing conclusions KEY Writing your personal reflections, prior to sharing with team.
Model making PREDICTIONS using these sentence stems ØI assume. . . ØI predict. . . ØI wonder. . . ØSome possibilities for learning that this data may present. . .
Office Referrals Fall 2012 (n = 200 in each grade) INFRACTIONS GRADE 9 10 11 12 Sum Absenteeism Physical Altercation Smoking Use of Profanity Drugs/Alcohol Theft Major Disruptions/Outbursts Throwing Objects in Cafeteria Destroying School Property Sexual Assault Bullying Students Assaulting a Teacher Sum
School Teams 20 Minutes
Collaborative Learning Cycle A framework that establishes a learning forum for group exploration of data.
Collaborative Learning Cycle Phase I – Activating & Engaging Phase 2 – Exploring & Discovering Phase 3 – Organizing Integrating
The Collaborative Learning Cycle Organizing & Integrating Activating & Engaging Exploring & Discovering
Collaborative Learning Cycle
Phase II – Exploring & Discovering • • • Purposeful uncertainty Avoiding jumping to premature conclusion and closure Intellectual Hang Time Push to explore multiple storylines Distinguishing, sorting, analyzing, comparing, and contrasting Publicly charted Balanced exploration of the data Place chairs in a semicircle around a central data display Two to three minutes of orientation to the data displays before talking Chart observations in a language that is concise and specific Neutral language – these data or this chart
Phase II – Exploring & Discovering (Intellectual Hang Time)
Phase II – Exploring & Discovering becaus e
Exploring & Discovering Activity I 1. Get into groups of four or below. 2. Take 2 -3 minutes (in silence) to examine the posted data artifacts on the wall and taking note of what you notice about the artifacts. 3. Using the Rough and Refined Observation Handout, record your observations in the Rough Observation column. (List anything you observe. ) Each observation should communicate a single idea clearly and concisely and should be observable. 4. Once finished, be prepared to share with your group.
Data Driven Dialogue Analyzing the Data Observations 1. If you catch yourself using. . . Ø Ø Because. . . Therefore. . . It seems. . . However. . .
Model making Quantifiable OBSERVATIONS using these sentence stems ØI observe that. . . ØSome patterns/trends that I notice are. . . ØI can count. . . ØI’m surprised that I see. . .
Potential Exploring & Discovering Questions • What important points seem to “pop out”? • What patterns, categories or trends are emerging? • What seems to be surprising or unexpected? • What are some ways we have not yet explained these data? (The data in front of you. )
Office Referrals Fall 2012 (n = 200 in each grade) INFRACTIONS GRADE 9 10 11 12 Sum Absenteeism 7 1 0 0 8 Physical Altercation 31 14 2 2 49 Smoking 12 7 9 14 42 Use of Profanity 17 12 14 13 56 Drugs/Alcohol 10 8 12 9 39 Theft 4 1 0 0 5 Major Disruptions/Outbursts 15 6 0 0 21 Throwing Objects in Cafeteria 2 0 0 0 2 Destroying School Property 6 1 0 0 7 Sexual Assault 1 0 0 1 2 Bullying Students 36 20 10 7 73 Insubordination 45 22 9 6 82 186 92 56 52 400 Sum
School Teams 30 Minutes
Data Driven Dialogue Organizing and Integrating Causation Phase Three Sentence Stems Ø I believe that the data suggests. . . because, Ø Additional data that would help me verify/confirm my explanation is. . . Ø I think the following are appropriate suggestions/solutions/responses that address the needs implied by the data. . . Ø Additional data that would help guide implementation of the suggestions/solutions/responses and determine if they are working. . .
Model making Organizing and Integrating Statements (Causation) using these sentence stems Ø I believe that the data suggests. . . because, Ø Additional data that would help me verify/confirm my explanation is. . . Ø I think the following are appropriate suggestions/solutions/responses that address the needs implied by the data. . . Ø Additional data that would help guide implementation of the suggestions/solutions/responses and determine if they are working. . .
Office Referrals Fall 2012 (n = 200 in each grade) INFRACTIONS GRADE 9 10 11 12 Sum Absenteeism 7 1 0 0 8 Physical Altercation 31 14 2 2 49 Smoking 12 7 9 14 42 Use of Profanity 17 12 14 13 56 Drugs/Alcohol 10 8 12 9 39 Theft 4 1 0 0 5 Major Disruptions/Outbursts 15 6 0 0 21 Throwing Objects in Cafeteria 2 0 0 0 2 Destroying School Property 6 1 0 0 7 Sexual Assault 1 0 0 1 2 Bullying Students 36 20 10 7 73 Insubordination 45 22 9 6 82 186 92 56 52 400 Sum
School Teams 20 Minutes
Troy School District Student Achievement through Purposeful Planning and Action Presenters Dr. Rich Machesky, Asst. Superintendent Secondary Education Dr. Lara Dixon, Principal Troy Athens Mark Dziatczak, Principal Troy High School
Probing for Root Cause Select a concern from the causation or theories generated in Math or Reading that if focused upon by the school, it will leverage student achievement.
Low IMPACT High Stage Two Study Step Four: Analyze Data School Summary Report The Five “Why’s” Consider impact/control Low DEGREE OF CONTROL High
5 Why’s Example • 4 th grade math achievement on the MEAP is below the state average. WHY? Create an exhaustive list. Next, select the one statement; that if addressed, will leverage student achievement.
5 Why’s Example Handout • Statement: The data indicates that our 4 th grade students do poorly on story problems. – (62% of our students score at level 3 and 4 on story problems). • Turn this statement into the NEXT question: Why are our 4 th graders scoring poorly on story problems?
Tool for Learning Schools • • • Evaluate high expectations Storyboard Thinking Lens Four-step reflection process Success analysis protocol
Next Steps Time • Network with colleagues • Place handouts in binder • Plan what to bring back to share with SI team • Visit the Smarter Balance Consortium website www. smarterbalanced. org • Visit the Career and College Readiness website www. michiganccr. org