Facilitating Data Days A Webinar for VTPBIS Schools

Facilitating Data Days A Webinar for VTPBIS Schools and SUs/SDs Presented by the VTPBIS State Team December 8, 2017

Webinar Logistics • Orient to Webinar Screen • 2 ways to Interact: • Raise your hand using the icon on your screen • Type a question into the text box • This webinar will be recorded. • Please note, your microphone will be muted unless otherwise indicated.

Opening Activity: • What have been some successes and challenges in using PBIS data this year? (fidelity and/or student outcome measures) • Please type into the chat box

Purpose • To build competence and confidence in your role as facilitators of data review • To introduce/review useful tools and strategies for problem solving around fidelity and student outcome data • To explore strategies for sharing data to build momentum

Agenda • • • Why collect and analyze data? What data should you be looking at? Who facilitates the process? How will you use and share the data? When and to whom will you share the data? What are next steps?

Why use PBIS data? To assess current status To assess implementation fidelity To assess impact on students To plan for school-wide and individual student changes To acknowledge incremental success along the way To determine priority areas of focus To show staff you value and use their input to make changes (SAS) • To reward staff and student performance • To determine breaks between “roll-outs” • •

Using PBIS Data Will Help You: • Identify a possible problem • Build a precise “problem statement” • Select a solution (intervention) • Assess if a solution is (a) being implemented and (b) being effective.

Big Ideas About Data • All data should serve a purpose • Collect data with fidelity • Be prompt about looking at data and acting upon it • Use multiple sources of data to confirm what you see • Use data to support, not punish

Types of Data to Consider Intensive: • TFI • I-SWIS • EST • FBA/BSP Targeted: • TFI • SWIS-CICO • EST • FBA/BSP • Universal Screening Universal: • TFI • SAS • SWIS • Attendance • Grades • Leadership Team Self. Assessment • School Climate • Family Engagement

Characteristics of an Effective Data Team

Data Analyst: Role & Responsibilities • Establish the role of a data analyst (and backup person) • Use the data sources needed for problem solving and decision making (DIBELS, SWIS, etc. ) • Create written data summaries in advance to assist the team in: • determining if there are problems; • jump starting a problem solving discussion; and • evaluating the impact of solutions and fidelity of implementation
 • Launch the meeting with a data summary")
Data Analyst: Role & Responsibilities (cont’d) • Launch the meeting with a data summary that helps define the problem with precision • Start problem solving by defining the problem with precision • Refine precision of problem statement through inferences and hypothesis • Generate reports during the meeting as questions about the data arise

POLL: To what extent does someone function as data analyst in your PBIS planning meetings? 1. Data has not been used in our meetings so there has been no need for a data analyst 2. There is no one in particular serving in this role. The Team reviews and analyzes the data together at the meetings. 3. One person on the team brings data to the meeting for the team to review. 4. There is a person identified in this role who prepares data for review and points out trends in advance for discussion and problem solving at meetings.

Effective meetings extend before and after the actual meeting time. Other key roles are necessary! BEFORE: • Set agenda and send to team • Collect data, review, and prepare summary statements DURING: AFTER: • Follow agenda & time frames • Complete action items • Review data • Follow-up on action item status • Make precision problem statements • Develop solutions • Take notes and set action items

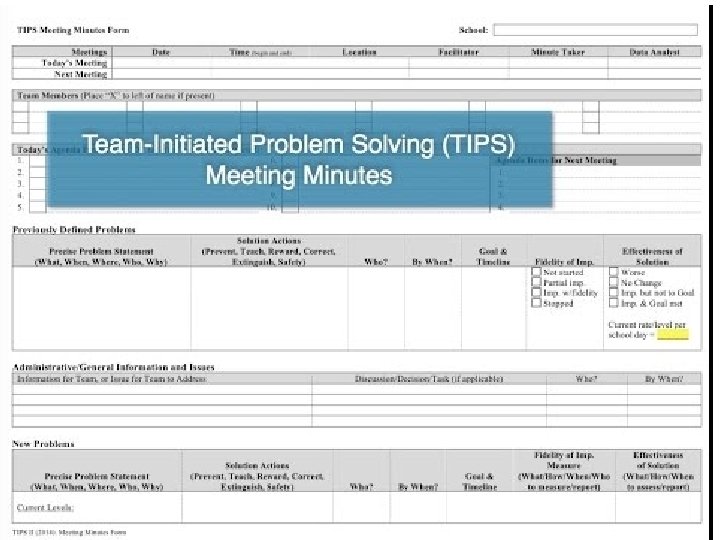
Student Outcome Data: Consider Team Initiated Problem Solving! https: //vimeo. com/user 18175786/videos

TIPS Offers: A process for using data to make decisions: A structured meeting process • Formal problem solving steps that a group can use to build and implement solutions. • Access to the right information at the right time in the right format • Formal roles (facilitator, recorder, data analyst) • Specific expectations (before, during & after meetings) • Access and use of data • Use of electronic and projected meeting minutes
 Model Review Status and Identify Problems Evaluate and Revise")
Team Initiated Problem Solving (TIPS) Model Review Status and Identify Problems Evaluate and Revise Action Plan Develop and Refine Hypotheses Collect and Use Data Develop and Implement Action Plan Discuss and Select Solutions Problem Solving Foundations

Decision-Making Can Occur at Many Levels • Whole school • Small groups or school areas • Individual student • Same basic process

SWIS Big 7: Core Reports Avg. Ref errals Pe e m i T f o y Da k Wee G rade r Day Pe r Month Loca tion Prob Beh lem avio r Stud ent

CICO - Reports: • School-wide Report • Average Daily Points • Student Count • Student Period • Student Single Period 20

I-SWIS Reports:

What Does this Graph Tell You?

Same Graph Looking at Majors Only

What Does this Graph Tell You?

R R E B M E . . … e to us TIPS Problem-Solving “Mantra” 1. Do we have a problem? (identify) 2. What is the precise nature of our problem? (define, clarify, confirm/disconfirm inferences) 3. Why does the problem exist, & what can we do about it? (hypothesis & solution) 4. What are the actual elements of our plan? (Action Plan) 5. Is our plan being implemented, & is it working? (evaluate & revise plan) Innovation neutral: Use for Reading, Behavior, Math, School Improvement

Why Does the Problem Exist & What Can We Do About It? (hypothesis & solution) • Problem Statement: The sixth graders are disruptive & use inappropriate language in the cafeteria between 11: 30 AM and 12: 00 PM • Hypothesis: We believe they are trying to get attention from their peers.

Solution Development for Disruption in Cafeteria Prevention: Remove/alter “trigger” for problem behavior Maintain current lunch schedule, but shift classes to balance numbers. Teaching: Define, instruct & model expected Teach behavioral expectations in cafeteria behavior Reward: Expected/alternative behavior when it occurs; prompt as necessary Establish “Friday Five”: Extra 5 min of lunch on Friday for five good days. Extinction: Increase acknowledgement of presence of desired behavior Encourage all students to work for “Friday Five”… make problem behavior less rewarding than desired behavior Corrective Consequence: Use nonrewarding/non-reinforcing responses when problem behavior occurs Active supervision and continued early consequence (ODR) Data Collection: Indicate how you know when you have a solution Maintain ODR record and supervisor weekly report

…include logistics:
")
Is Our Plan Being Implemented & Is It Working? (evaluate & revise plan)

Fidelity Data

www. pbisapps. org
 Purpose: Assess leadership team’s perceptions of PBIS implementation at the")
Tiered Fidelity Inventory (TFI) Purpose: Assess leadership team’s perceptions of PBIS implementation at the Universal Level Format: Survey on www. pbisapps. org Completed by: Leadership Team, School Coordinator, and SU/District Coordinator (external coach if possible) When? January – March (or 2 -3 times per year)

Uses of the TFI • Formative Assessment • Determine current PBIS practices in place and needed prior to launching implementation • Progress Monitoring • Self-assess PBIS practices by tier to guide implementation efforts and assess progress by tier • Build action plan to focus implementation efforts • Annual Self-Assessment • Facilitate sustained implementation of PBIS • State Recognition • Determine schools warranting recognition for their fidelity of PBIS implementation
 Scale 2) Subscale 3) Items")
Understanding TFI Results: www. pbisassessment. org 1) Scale 2) Subscale 3) Items

Example Scale Report

Sub-Subscale and Item Reports ▪ Sub-subscale ▪ Tier I ▪ Teams ▪ Implementation ▪ Evaluation ▪ Tier II ▪ Teams ▪ Interventions ▪ Evaluation ▪ Tier III ▪ ▪ Teams Resources Support plan Evaluation

Action Planning Form
 Purpose: Assess staff perceptions of PBIS practices in place and priority")
Self-Assessment Survey (SAS) Purpose: Assess staff perceptions of PBIS practices in place and priority for changes Design annual action plan Format: Survey Completed by: All staff Manual or on-line scoring, graphing When? Annually, January - March 40

Two Main Questions 1. What systems are in place now? 2. What systems are most in need of improvement?

Total Score:

Subscale:

Items:

SAS Team Summary Tool

For More Information • https: //www. pbisvermont. org/evaluation/ • www. pbisapps. org *Note: Other fidelity measures (e. g. , BOQ, BAT, etc. ) will remain on the PBIS Apps website.

EXAMPLE: Presentation to Staff

INSERT School Name PBIS Update! Insert School Mascot/Logo and Expectations HERE
 of Staff")
PBIS Data Update THANK YOU ALL! (INSERT # of Staff or %) of Staff Members Completed the Self-Assessment Survey!

This year --% of our staff completed the SAS. --% indicated that they think school-wide system is in place compared to --% last year. --% of staff still say this is a medium or high priority for improvement. INSERT your SAS Graph

--% of staff think that non-classroom settings are in place, an increase of --% since last year. Only --% say this is still a high priority for improvement. INSERT your SAS Graph

Overall, staff perception of implementation has improved across all categories! INSERT your SAS Multi-year by Element Graph

This year our PBIS team took the TFI to assess PBIS fidelity of PBIS at the Universal level. This year --% of PBIS features are in place. Compared to last year’s Bo. Q, only --% of features were in place. INSERT your TFI Universal Score Graph
")
Based on your feedback, our team has determined the following areas for improvement: 1) INSERT GOAL 2) INSERT GOAL 3) INSERT GOAL (Use the SAS and TFI Summary to help articulate these)

Thanks! Questions about PBIS? Contact one of the team members: INSE RT T eam Mem bers HERE

Other Ways to Share Data • Email a monthly report; give context, provide connections, and suggest next steps • Create a data wall focusing on data related to school-wide goals • Share data at a monthly staff meeting. Invite all staff to participate in finding ways to improve outcomes • Present to parents, school boards, community

Responsibilities for Facilitating Data Review and Improvement Planning: • Schedule Data Days – Fall, Winter, Spring • Identify/enhance the role of the Data Analyst • Plan professional development around priorities identified through assessments • Consider TIPS/SWIS learning module • Consider training in Universal Screening • Consider training in classroom management, FBA/BSP, crisis prevention and intervention, other

Six Things to Avoid 1. Defining a solution before defining the problem 2. Building solutions from broadly defined, or fuzzy problem statements 3. Failure to use data to confirm/define problem 4. Agreeing on a solution without building a plan for how to implement or evaluate the solution 5. Agreeing on a solution but never assessing if the solution was implemented 6. Serial problem solving without decisions

General Recommendations for PBIS Decision-Making • Never stop doing what is already working • Always look for the smallest change that will produce the largest effect • Avoid defining a large number of goals • Do a small number of things well • Do not add something new without also defining what you will stop doing to make the addition possible.
- Slides: 58