
FACILITATING BUSINESS INVESTMENT IN THE UNITED STATES Select
FACILITATING BUSINESS INVESTMENT IN THE UNITED STATES Select. USA Seth Isenberg Senior International Investment Specialist Select. USA Tel: +1 202 482 0588 E-mail: Seth. Isenberg@trade. gov November 2015 U. S. Department of Commerce | International Trade Administration | Select. USA
2 Introduction U. S. Department of Commerce | International Trade Administration | Select. USA
Interagency Investment Working Group 3 The Executive Order establishes the Federal Interagency Investment Working Group (IIWG) “The Working Group shall coordinate activities to promote business investment and respond to specific issues that affect business investment decisions” Over 20 IIWG participating Agencies, including: ü Department of State ü DHS ü SBA ü Ex-Im Bank ü USTR ü DOE ü DOD U. S. Department of Commerce | International Trade Administration | Select. USA
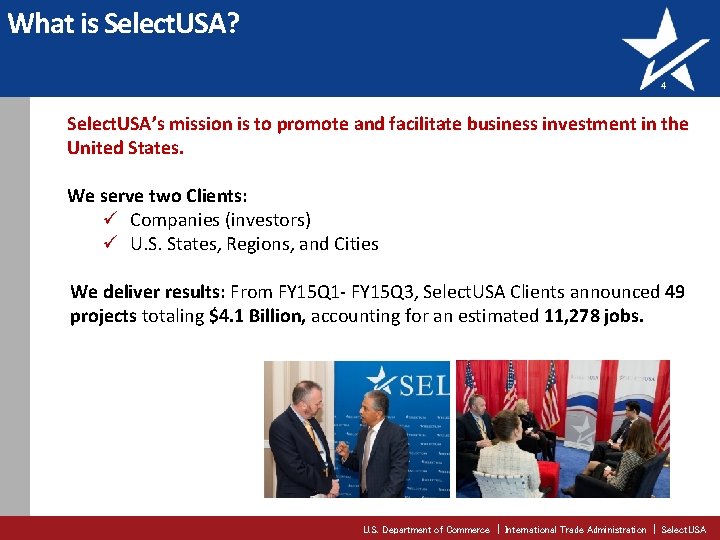
What is Select. USA? 4 Select. USA’s mission is to promote and facilitate business investment in the United States. We serve two Clients: ü Companies (investors) ü U. S. States, Regions, and Cities We deliver results: From FY 15 Q 1 - FY 15 Q 3, Select. USA Clients announced 49 projects totaling $4. 1 Billion, accounting for an estimated 11, 278 jobs. U. S. Department of Commerce | International Trade Administration | Select. USA
Who We are 5 Our Team U. S. Department of Commerce – International Trade Administration ü Select. USA HQ ü U. S. and Foreign Commercial Service Our Network Inter-Agency Investment Working Group ü U. S. State Department, Embassy & consulate Personnel U. S. Department of Commerce | International Trade Administration | Select. USA
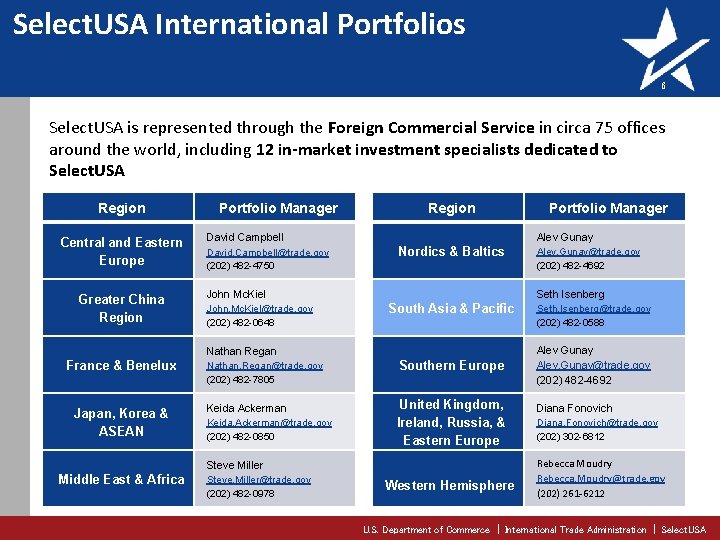
Select. USA International Portfolios 6 Select. USA is represented through the Foreign Commercial Service in circa 75 offices around the world, including 12 in-market investment specialists dedicated to Select. USA Region Central and Eastern Europe Greater China Region Portfolio Manager Region Alev Gunay David Campbell David. Campbell@trade. gov (202) 482 -4750 Nordics & Baltics South Asia & Pacific Nathan Regan France & Benelux Japan, Korea & ASEAN Nathan. Regan@trade. gov (202) 482 -7805 Keida Ackerman Keida. Ackerman@trade. gov (202) 482 -0850 Southern Europe United Kingdom, Ireland, Russia, & Eastern Europe Steve Miller Middle East & Africa Steve. Miller@trade. gov (202) 482 -0978 Alev. Gunay@trade. gov (202) 482 -4692 Seth Isenberg John Mc. Kiel John. Mc. Kiel@trade. gov (202) 482 -0648 Portfolio Manager Western Hemisphere Seth. Isenberg@trade. gov (202) 482 -0588 Alev Gunay Alev. Gunay@trade. gov (202) 482 -4692 Diana Fonovich Diana. Fonovich@trade. gov (202) 302 -6812 Rebecca Moudry Rebecca. Moudry@trade. gov (202) 261 -6212 U. S. Department of Commerce | International Trade Administration | Select. USA
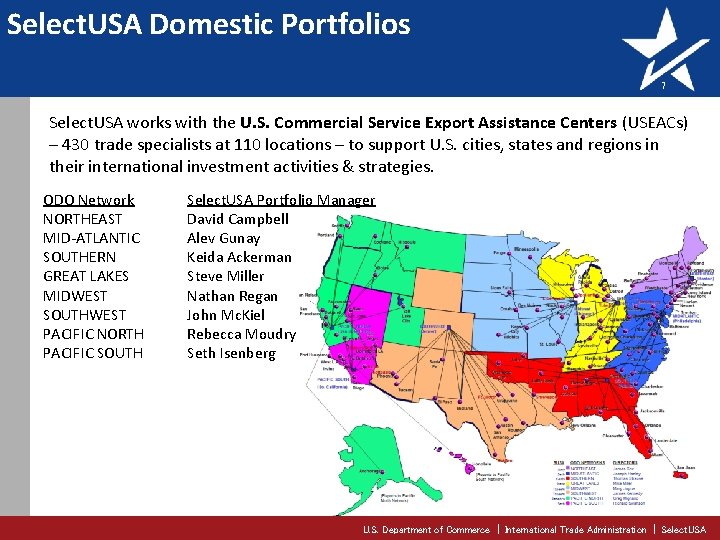
Select. USA Domestic Portfolios 7 Select. USA works with the U. S. Commercial Service Export Assistance Centers (USEACs) – 430 trade specialists at 110 locations – to support U. S. cities, states and regions in their international investment activities & strategies. ODO Network NORTHEAST MID-ATLANTIC SOUTHERN GREAT LAKES MIDWEST SOUTHWEST PACIFIC NORTH PACIFIC SOUTH Select. USA Portfolio Manager David Campbell Alev Gunay Keida Ackerman Steve Miller Nathan Regan John Mc. Kiel Rebecca Moudry Seth Isenberg U. S. Department of Commerce | International Trade Administration | Select. USA
8 Trends in Foreign Direct Investment U. S. Department of Commerce | International Trade Administration | Select. USA
U. S. Open Investment Policy 9 “ The United States reaffirms our open investment policy, a commitment to treat all investors in a fair and equitable manner under the law. ” President Barack Obama June 20, 2011 U. S. Department of Commerce | International Trade Administration | Select. USA
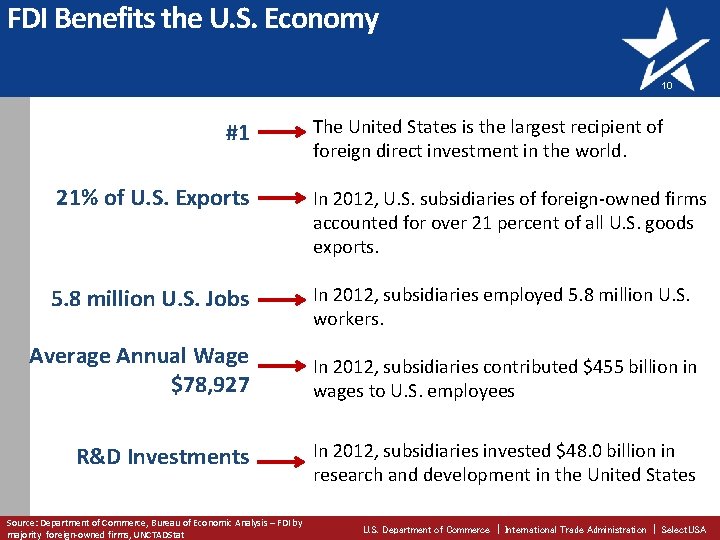
FDI Benefits the U. S. Economy 10 #1 The United States is the largest recipient of foreign direct investment in the world. 21% of U. S. Exports In 2012, U. S. subsidiaries of foreign-owned firms accounted for over 21 percent of all U. S. goods exports. 5. 8 million U. S. Jobs In 2012, subsidiaries employed 5. 8 million U. S. workers. Average Annual Wage $78, 927 In 2012, subsidiaries contributed $455 billion in wages to U. S. employees R&D Investments In 2012, subsidiaries invested $48. 0 billion in research and development in the United States Source: Department of Commerce, Bureau of Economic Analysis – FDI by majority foreign-owned firms, UNCTADStat U. S. Department of Commerce | International Trade Administration | Select. USA
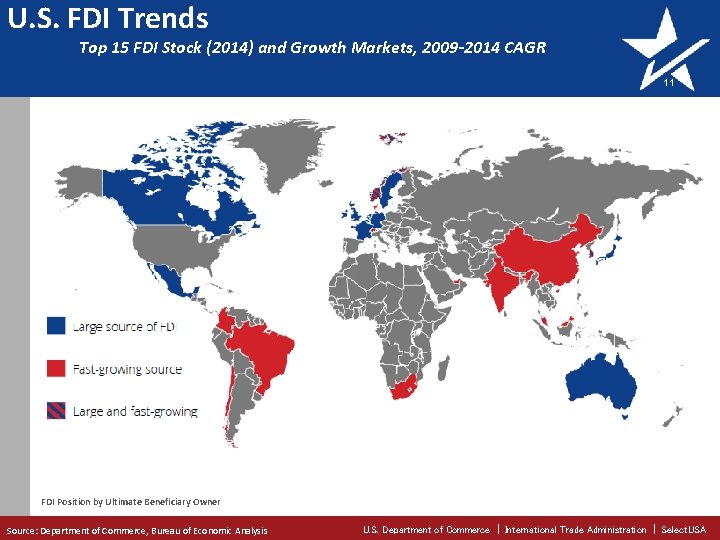
U. S. FDI Trends Top 15 FDI Stock (2014) and Growth Markets, 2009 -2014 CAGR 11 FDI Position by Ultimate Beneficiary Owner Source: Department of Commerce, Bureau of Economic Analysis U. S. Department of Commerce | International Trade Administration | Select. USA
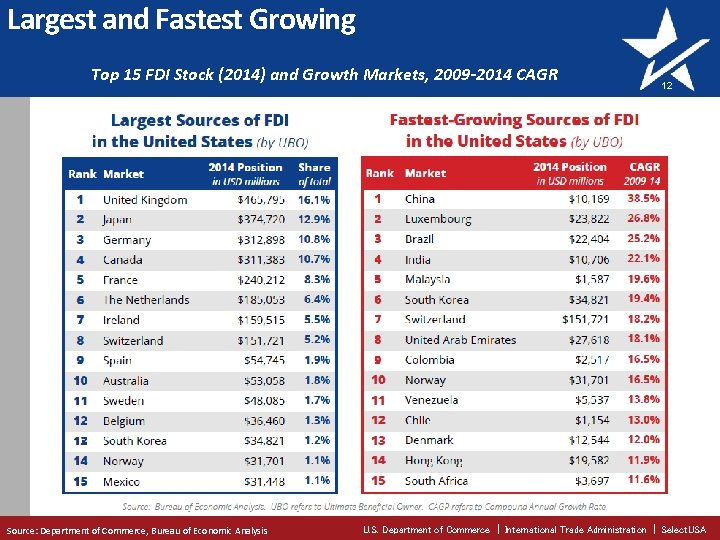
Largest and Fastest Growing Top 15 FDI Stock (2014) and Growth Markets, 2009 -2014 CAGR Source: Department of Commerce, Bureau of Economic Analysis 12 U. S. Department of Commerce | International Trade Administration | Select. USA
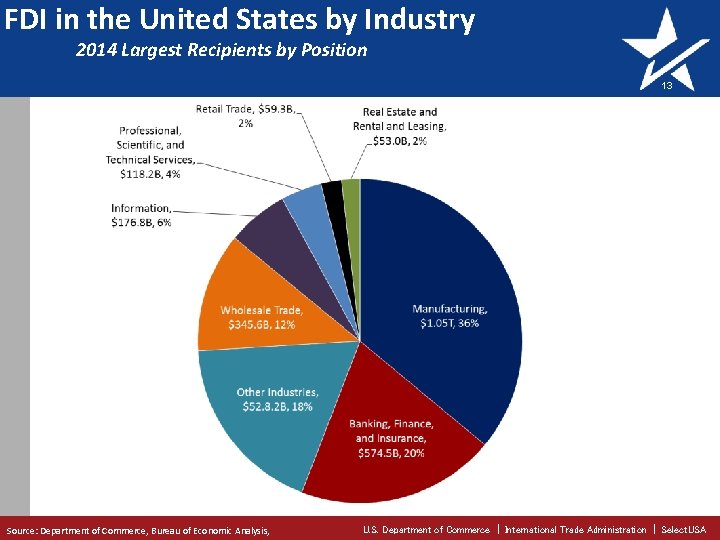
FDI in the United States by Industry 2014 Largest Recipients by Position 13 Source: Department of Commerce, Bureau of Economic Analysis, U. S. Department of Commerce | International Trade Administration | Select. USA
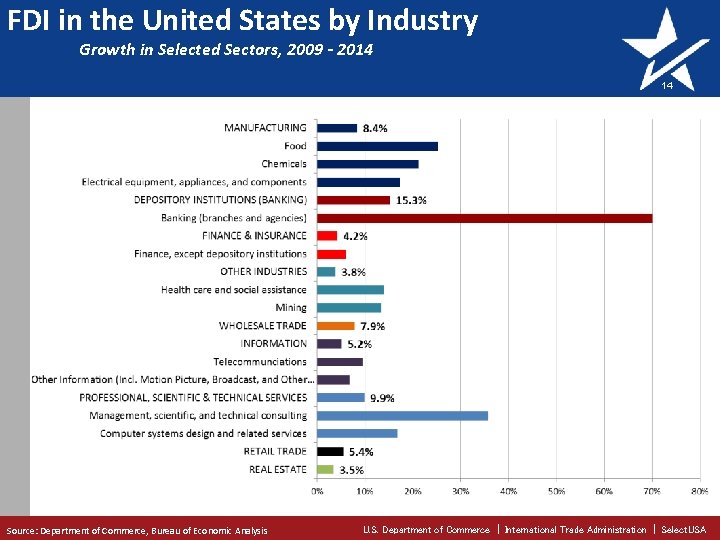
FDI in the United States by Industry Growth in Selected Sectors, 2009 - 2014 14 Source: Department of Commerce, Bureau of Economic Analysis U. S. Department of Commerce | International Trade Administration | Select. USA
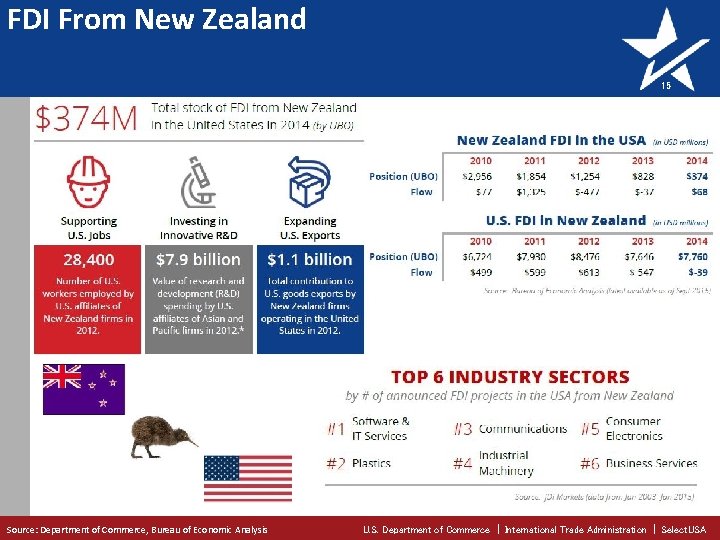
FDI From New Zealand 15 Source: Department of Commerce, Bureau of Economic Analysis U. S. Department of Commerce | International Trade Administration | Select. USA
16 Select. USA Services U. S. Department of Commerce | International Trade Administration | Select. USA
How Select. USA Can Help 17 Select. USA Services for Firms Information, Research & Counseling on business investment in the United States and developing an FDI strategy. Ombudsman Assistance to help with questions or concerns about U. S. federal rules and regulations. In-Market Investment Promotion for EDOs to market their locations to targeted investor audiences U. S. Department of Commerce | International Trade Administration | Select. USA
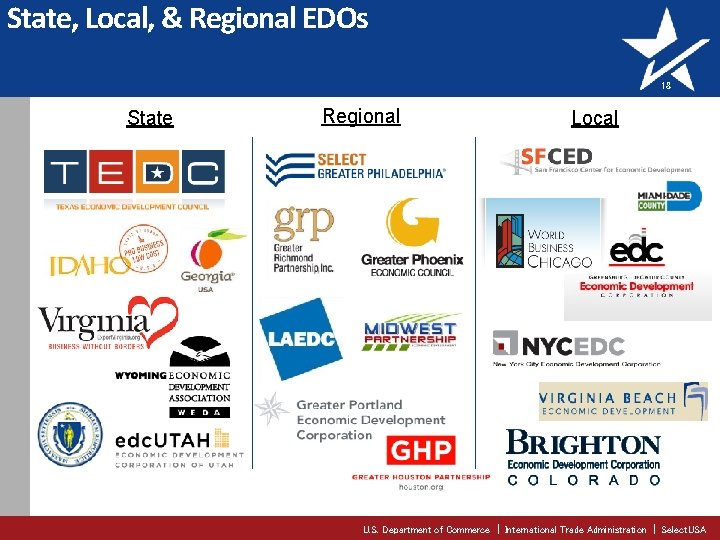
State, Local, & Regional EDOs 18 State Regional Local U. S. Department of Commerce | International Trade Administration | Select. USA
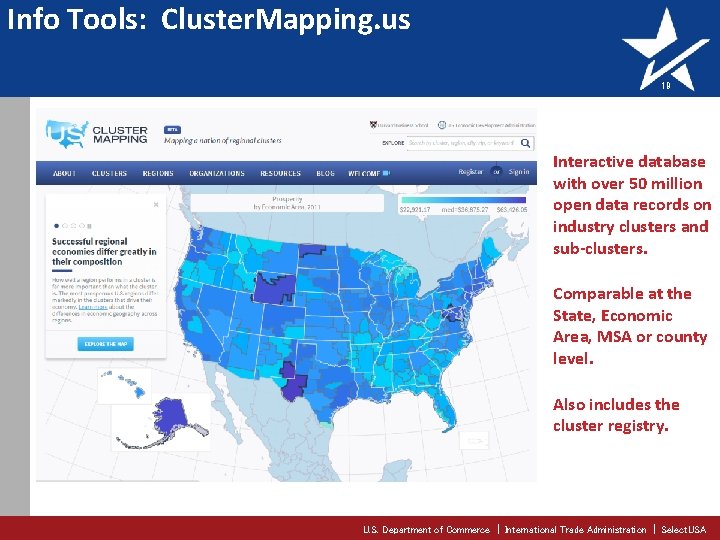
Info Tools: Cluster. Mapping. us 19 Interactive database with over 50 million open data records on industry clusters and sub-clusters. Comparable at the State, Economic Area, MSA or county level. Also includes the cluster registry. U. S. Department of Commerce | International Trade Administration | Select. USA
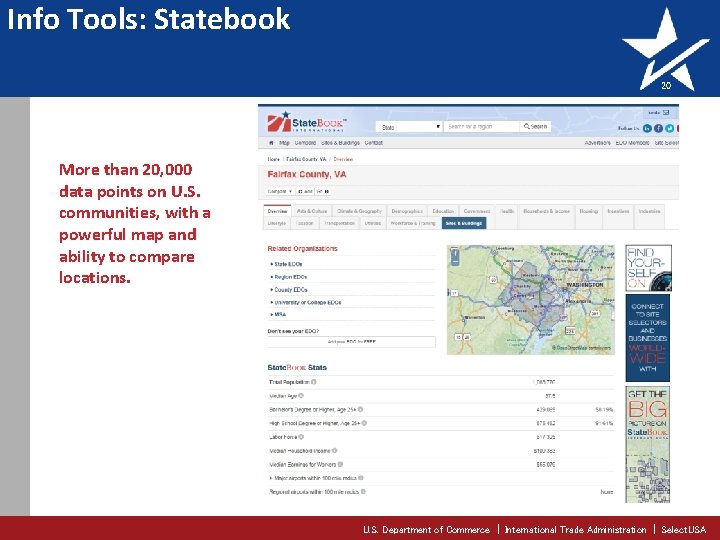
Info Tools: Statebook 20 More than 20, 000 data points on U. S. communities, with a powerful map and ability to compare locations. U. S. Department of Commerce | International Trade Administration | Select. USA
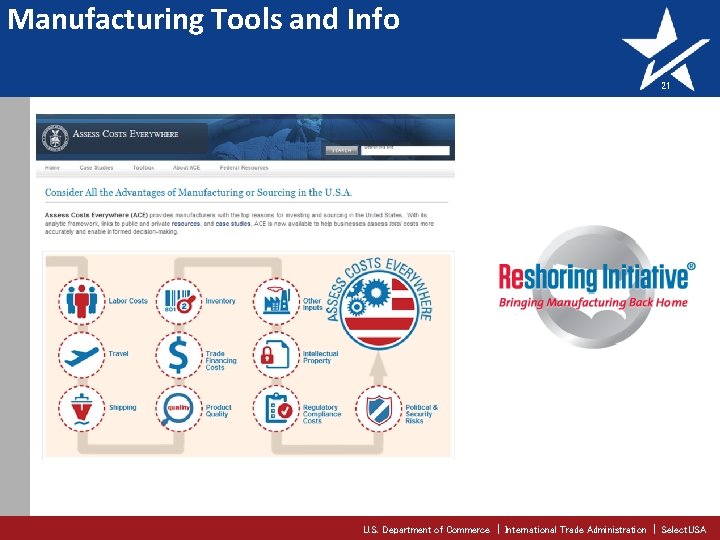
Manufacturing Tools and Info 21 U. S. Department of Commerce | International Trade Administration | Select. USA
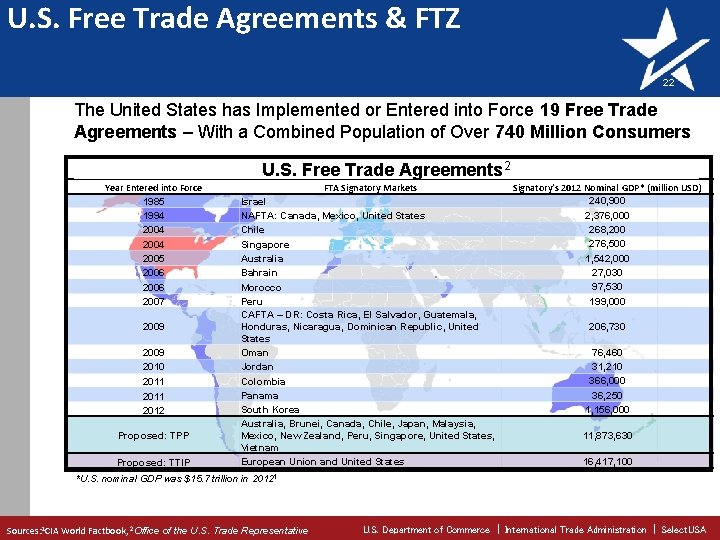
U. S. Free Trade Agreements & FTZ 22 The United States has Implemented or Entered into Force 19 Free Trade Agreements – With a Combined Population of Over 740 Million Consumers U. S. Free Trade Agreements 2 Year Entered into Force 1985 1994 2004 2005 2006 2007 2009 2010 2011 2012 Proposed: TPP Proposed: TTIP FTA Signatory Markets Israel NAFTA: Canada, Mexico, United States Chile Singapore Australia Bahrain Morocco Peru CAFTA – DR: Costa Rica, El Salvador, Guatemala, Honduras, Nicaragua, Dominican Republic, United States Oman Jordan Colombia Panama South Korea Australia, Brunei, Canada, Chile, Japan, Malaysia, Mexico, New Zealand, Peru, Singapore, United States, Vietnam European Union and United States *U. S. nominal GDP was $15. 7 trillion in Signatory’s 2012 Nominal GDP* (million USD) 240, 900 2, 376, 000 268, 200 276, 500 1, 542, 000 27, 030 97, 530 199, 000 206, 730 76, 460 31, 210 366, 000 36, 250 1, 156, 000 11, 873, 630 16, 417, 100 20121 Sources: 1 CIA World Factbook, 2 Office of the U. S. Trade Representative U. S. Department of Commerce | International Trade Administration | Select. USA
23 What Drives FDI Decisions? U. S. Department of Commerce | International Trade Administration | Select. USA
Reasons to Invest in the United States 24 There are many reasons to invest in the United States! Open investment policy – with few exceptions (e. g. national security), the U. S. is open to virtually all types of foreign investment and foreign companies (not true elsewhere) • Economic growth (versus other mature markets) • Large, affluent consumer market • Access to growing markets (especially Canada and Mexico via NAFTA) • Political stability (versus other markets, esp. emerging markets) • Skilled and productive work force • Access to advanced technology and leading Research & Development institutions (the U. S. is generally regarded as the best in moving from “idea to market” / “inspiration to sale” due, in part, to close relationships between the private sector and academia) • Government policies and regulations, including incentives (in the U. S. , incentives are often routed through the tax code, whereas in Europe, similar incentives often occur “up-front” in the form of subventions) • Strong protection for Intellectual Property • Abundant (often affordable) natural resources, such as oil and natural gas • Strong, diverse financial services industry (including access to capital for companies) Historically, foreign (direct) investment [FDI] was motivated by the U. S. consumer market (320 million). That remains true today, but increasingly, FDI is motivated by other factors, including access to other markets. For example: BMW is the largest exporter of US-produced autos! • U. S. Department of Commerce | International Trade Administration | Select. USA
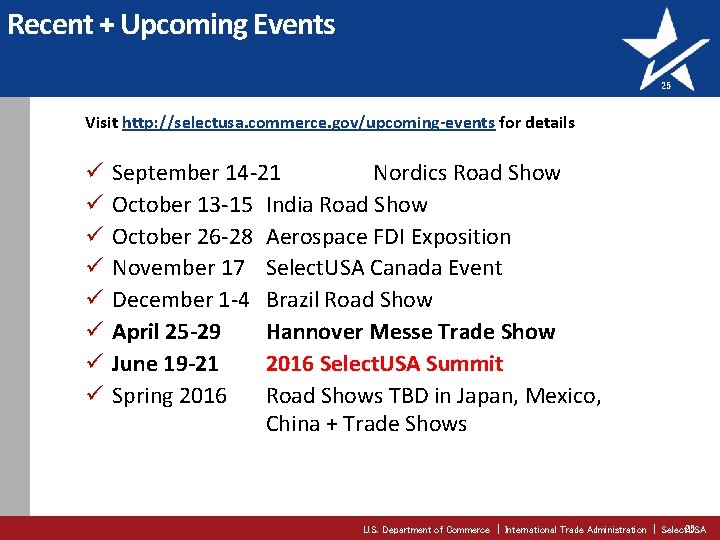
Recent + Upcoming Events 25 Visit http: //selectusa. commerce. gov/upcoming-events for details ü ü ü ü September 14 -21 Nordics Road Show October 13 -15 India Road Show October 26 -28 Aerospace FDI Exposition November 17 Select. USA Canada Event December 1 -4 Brazil Road Show April 25 -29 Hannover Messe Trade Show June 19 -21 2016 Select. USA Summit Spring 2016 Road Shows TBD in Japan, Mexico, China + Trade Shows 25 U. S. Department of Commerce | International Trade Administration | Select. USA
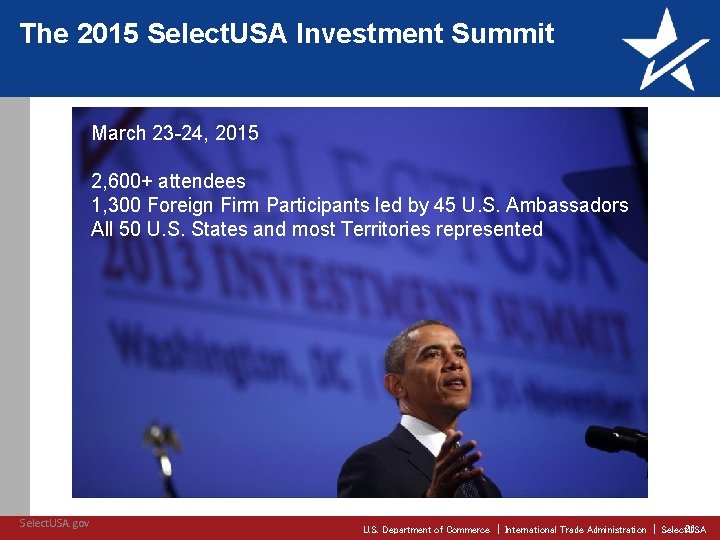
The 2015 Select. USA Investment Summit March 23 -24, 2015 2, 600+ attendees 1, 300 Foreign Firm Participants led by 45 U. S. Ambassadors All 50 U. S. States and most Territories represented Select. USA. gov 26 U. S. Department of Commerce | International Trade Administration | Select. USA
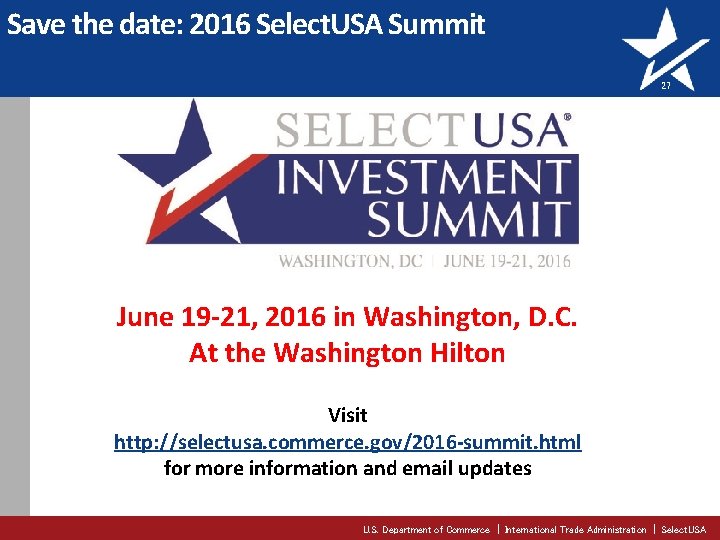
Save the date: 2016 Select. USA Summit 27 June 19 -21, 2016 in Washington, D. C. At the Washington Hilton Visit http: //selectusa. commerce. gov/2016 -summit. html for more information and email updates U. S. Department of Commerce | International Trade Administration | Select. USA
Thank You 28 New Zealand Portfolio Manager: Seth Isenberg Senior International Investment Specialist Select. USA Washington, DC USA Office: +1 202 482 0588 Seth. Isenberg@trade. gov In-Country Contact: Dhiraj Mani Commercial Specialist U. S. Commercial Service Auckland, New Zealand Office: 64 (9) 3032724 x 2867 Cell: 64 (21) 2235406 Dhiraj. Mani@trade. gov @Select. USA & #Select. USA on Twitter U. S. Department of Commerce | International Trade Administration | Select. USA
- Slides: 28