
Facilitated By Chak Tay Elizabeth Xie Lee Theng

Facilitated By: Chak Tay Elizabeth Xie Lee Theng Liang Yip Su Jen
Agenda 1. 2. 3. Various ways of Organizing Data Major Sections of a Report Preparation of an Outline
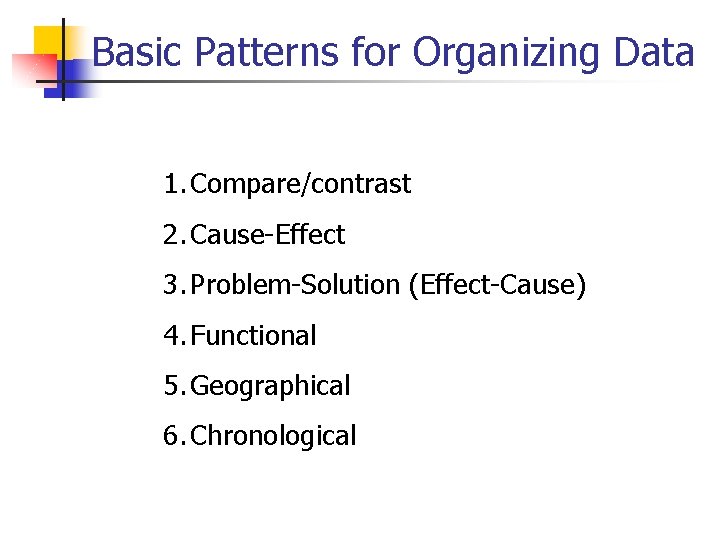
Basic Patterns for Organizing Data 1. Compare/contrast 2. Cause-Effect 3. Problem-Solution (Effect-Cause) 4. Functional 5. Geographical 6. Chronological
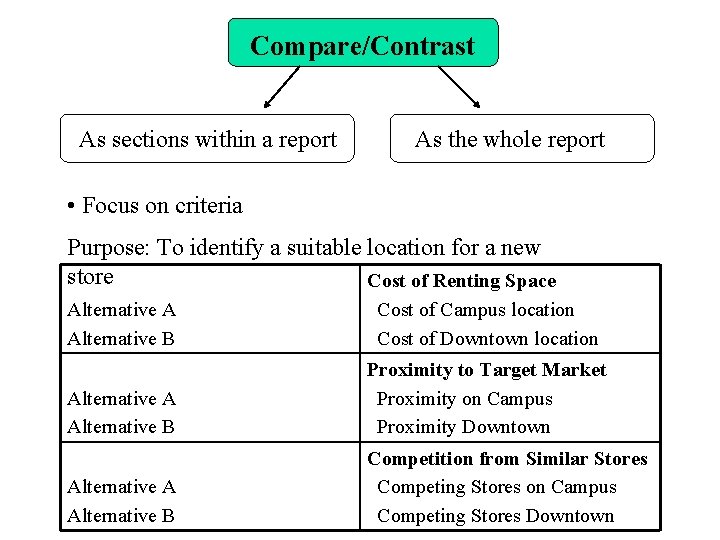
Compare/Contrast As sections within a report As the whole report • Focus on criteria Purpose: To identify a suitable location for a new store Cost of Renting Space Alternative A Alternative B Cost of Campus location Cost of Downtown location Alternative A Alternative B Proximity to Target Market Proximity on Campus Proximity Downtown Alternative A Alternative B Competition from Similar Stores Competing Stores on Campus Competing Stores Downtown
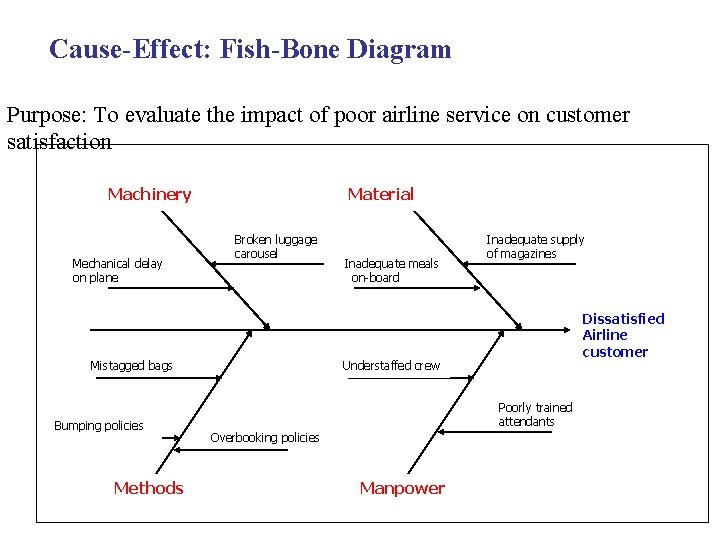
Cause-Effect: Fish-Bone Diagram Purpose: To evaluate the impact of poor airline service on customer satisfaction Machinery Mechanical delay on plane Material Broken luggage carousel Mistagged bags Bumping policies Methods Inadequate meals on-board Inadequate supply of magazines Dissatisfied Airline customer Understaffed crew Poorly trained attendants Overbooking policies Manpower
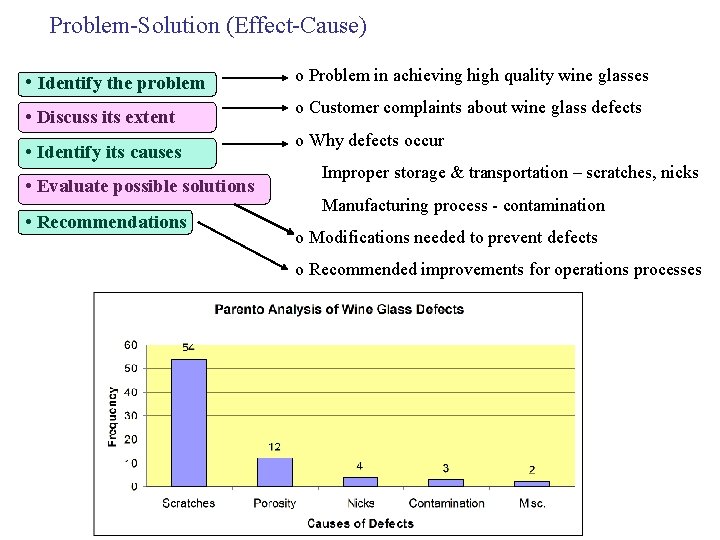
Problem-Solution (Effect-Cause) • Identify the problem o Problem in achieving high quality wine glasses • Discuss its extent o Customer complaints about wine glass defects • Identify its causes • Evaluate possible solutions • Recommendations o Why defects occur Improper storage & transportation – scratches, nicks Manufacturing process - contamination o Modifications needed to prevent defects o Recommended improvements for operations processes
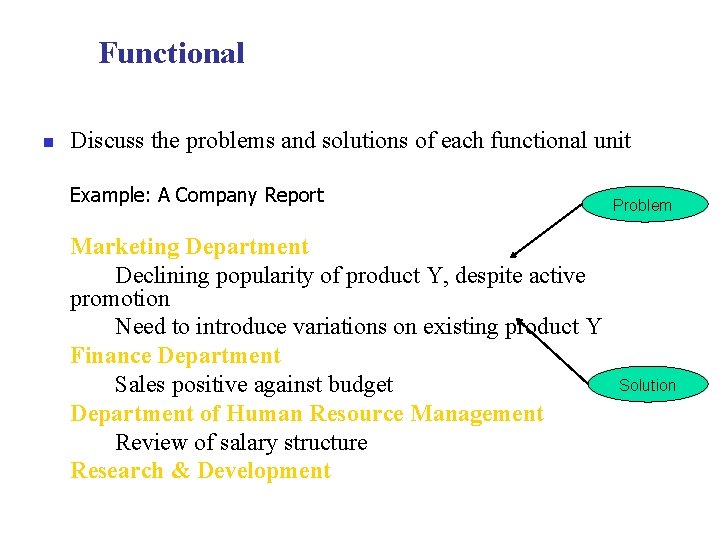
Functional n Discuss the problems and solutions of each functional unit Example: A Company Report Marketing Department Declining popularity of product Y, despite active promotion Need to introduce variations on existing product Y Finance Department Sales positive against budget Department of Human Resource Management Review of salary structure Research & Development Problem Solution
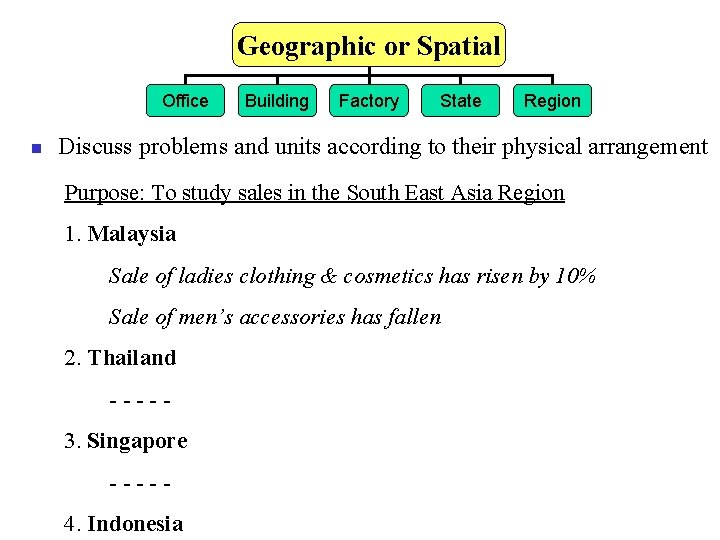
Geographic or Spatial Office n Building Factory State Region Discuss problems and units according to their physical arrangement Purpose: To study sales in the South East Asia Region 1. Malaysia Sale of ladies clothing & cosmetics has risen by 10% Sale of men’s accessories has fallen 2. Thailand ----3. Singapore ----4. Indonesia
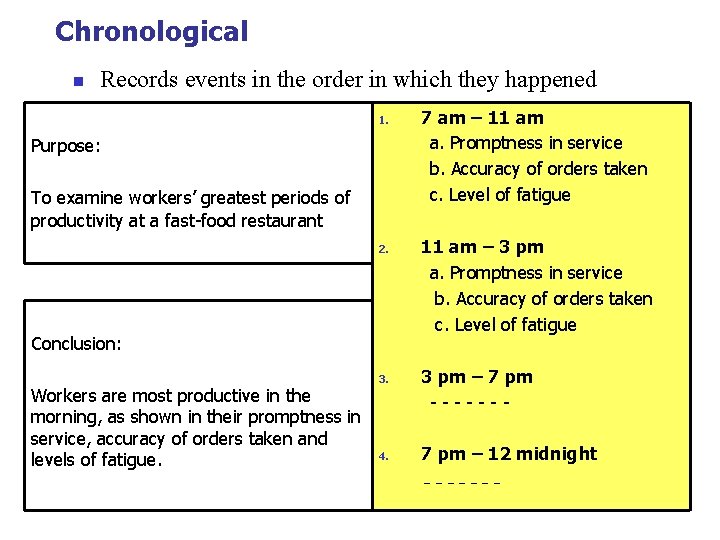
Chronological n Records events in the order in which they happened 1. Purpose: To examine workers’ greatest periods of productivity at a fast-food restaurant 2. Conclusion: Workers are most productive in the morning, as shown in their promptness in service, accuracy of orders taken and levels of fatigue. 3. 4. 7 am – 11 am a. Promptness in service b. Accuracy of orders taken c. Level of fatigue 11 am – 3 pm a. Promptness in service b. Accuracy of orders taken c. Level of fatigue 3 pm – 7 pm ------7 pm – 12 midnight -------
Sections of a Report § Introduction § Findings § Conclusions § Recommendations
Introduction § Authorization §Assumptions & Limitations § Background §Research methods and sources § Purpose / Problem § Scope § Definitions §Report Organisation
Should Accomplish… § Tie the report to a problem § Introduce the subject/purpose of the report & state the importance § Preview the main ideas & their order in the report § Establish the tone of report and writer’s relationship with audience
Findings § The objective presentation of your data through text & visuals (eg. charts, tables)
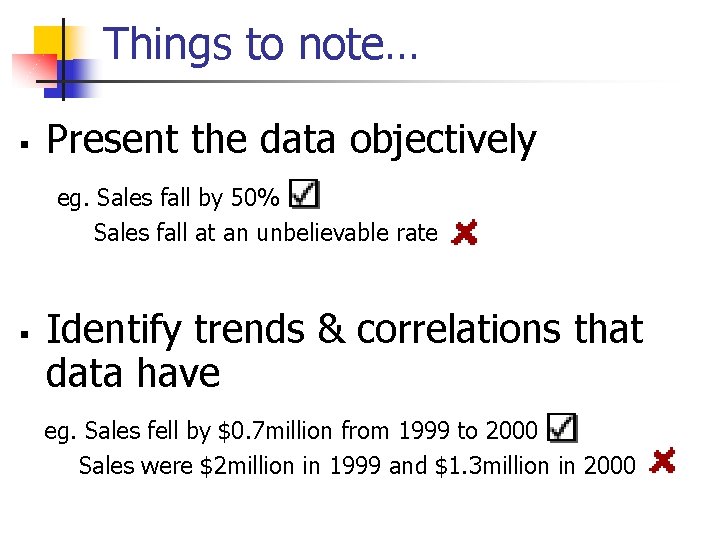
Things to note… § Present the data objectively 1 eg. Sales fall by 50% Sales fall at an unbelievable rate § 1 Identify trends & correlations that data have 1 eg. Sales fell by $0. 7 million from 1999 to 2000 Sales were $2 million in 1999 and $1. 3 million in 2000 1
Things to note… § § Ensure organisation reflects the purpose & leads reader towards the conclusion Present data using graphics when appropriate
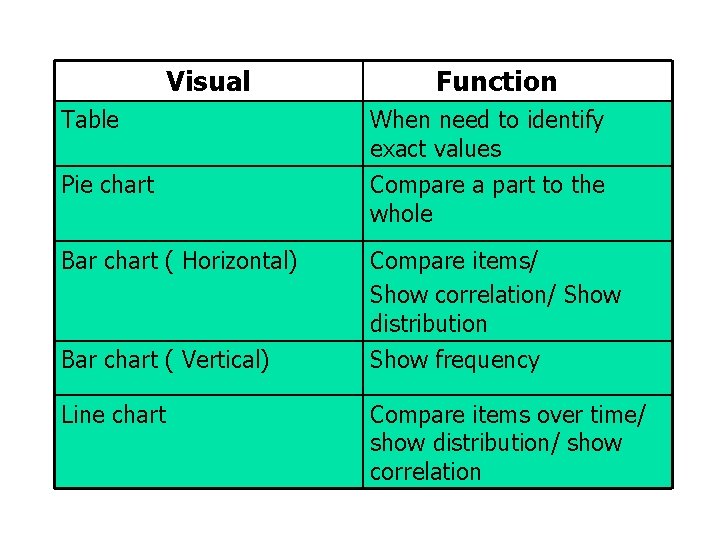
Visual Table Pie chart Bar chart ( Horizontal) Bar chart ( Vertical) Line chart Function When need to identify exact values Compare a part to the whole Compare items/ Show correlation/ Show distribution Show frequency Compare items over time/ show distribution/ show correlation
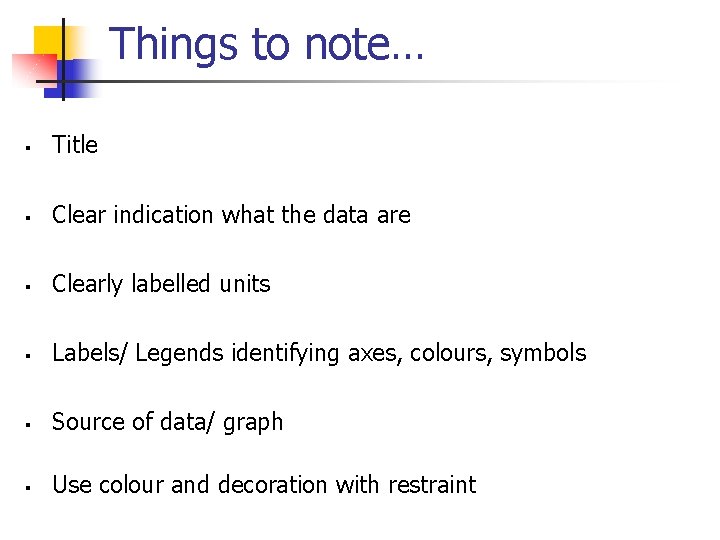
Things to note… § Title § Clear indication what the data are § Clearly labelled units § Labels/ Legends identifying axes, colours, symbols § Source of data/ graph § Use colour and decoration with restraint
Conclusion n Evaluation n Ensure the content is relevant n Ensure the content is logical n Substantiate with data
Evaluating Data n Relationship n Significance
Conclusion- Points to Note No new information should be included n Paragraphs Or Numbered or Bulleted List n A Strong Lasting Impression n
Recommendations n Improvements Practical n Acceptable n Detailed Explanation n
Recommendations- n n n Points to Note Itemize recommendations in bullet points/ Number them Make alternatives clear Give Rationale after each Difficult/Controversial recommendation.
Conclusion & Recommendations n Indirect Approach: Formal & Conventional n n End with Conclusion & Recommendations Direct Approach: Problem Solving/ Feasibility Report n Start with Conclusion & Recommendations
Final Section of Report Emphasize main points n Summarize and Recommend n Actions n Leave a Strong Lasting Impression n
Preparation of an Outline Importance of an Outline § Structuring of an Outline § Principles of Outlining § Usage of Appropriate Heading §
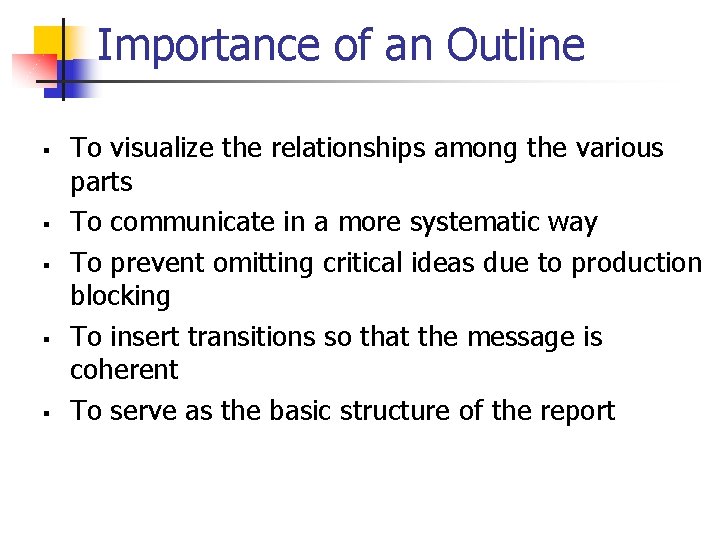
Importance of an Outline § § § To visualize the relationships among the various parts To communicate in a more systematic way To prevent omitting critical ideas due to production blocking To insert transitions so that the message is coherent To serve as the basic structure of the report
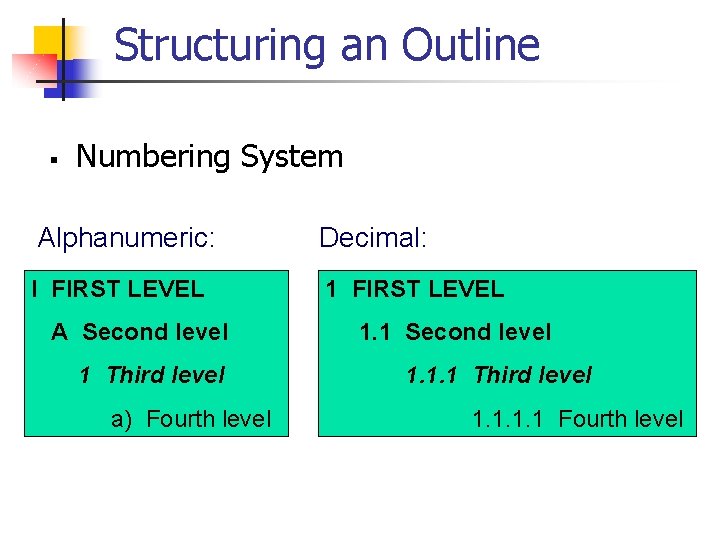
Structuring an Outline § Numbering System Alphanumeric: Decimal: I FIRST LEVEL 1 FIRST LEVEL A Second level 1 Third level a) Fourth level 1. 1 Second level 1. 1. 1 Third level 1. 1 Fourth level
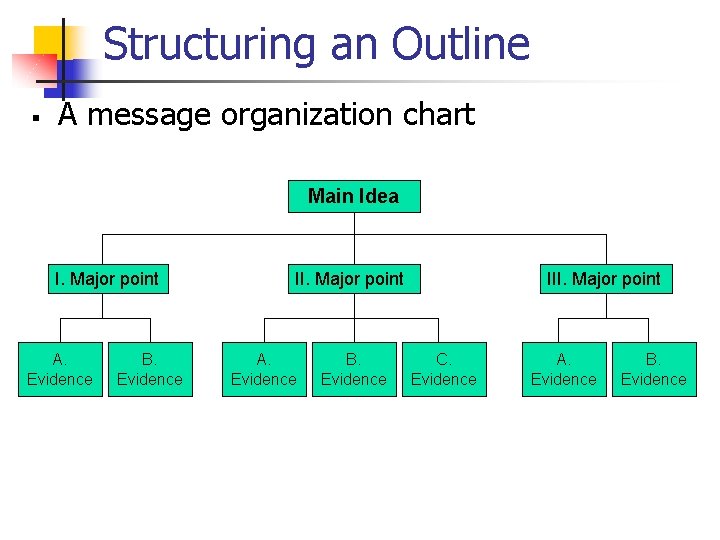
Structuring an Outline § A message organization chart Main Idea I. Major point A. Evidence B. Evidence III. Major point C. Evidence A. Evidence B. Evidence
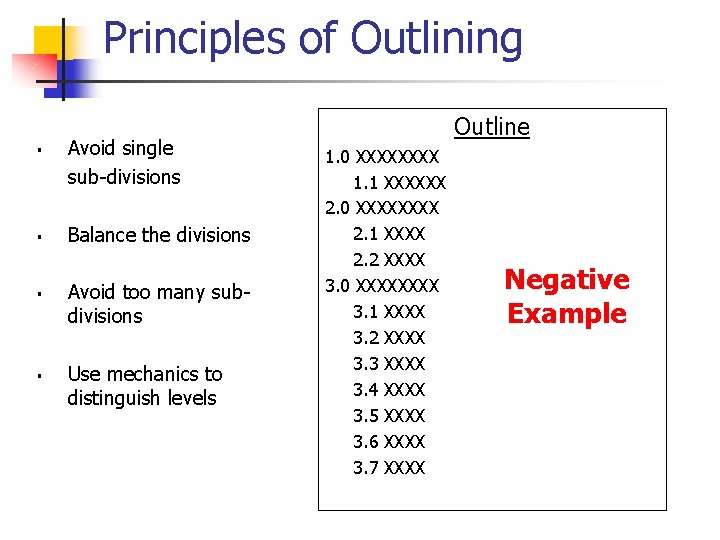
Principles of Outlining § § Avoid single sub-divisions Balance the divisions Avoid too many subdivisions Use mechanics to distinguish levels Outline 1. 0 XXXX 1. 1 XXXXXX 2. 0 XXXX 2. 1 XXXX 2. 2 XXXX 3. 0 XXXX 3. 1 XXXX 3. 2 XXXX 3. 3 XXXX 3. 4 XXXX 3. 5 XXXX 3. 6 XXXX 3. 7 XXXX Negative Example
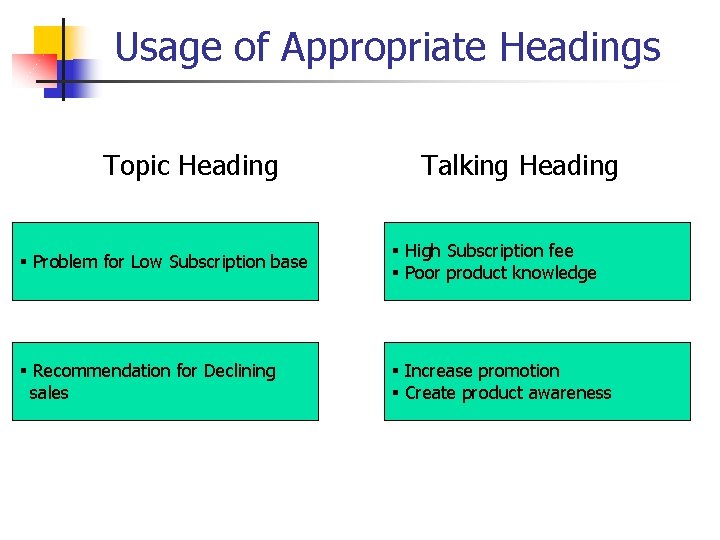
Usage of Appropriate Headings Topic Heading Talking Heading § Problem for Low Subscription base § High Subscription fee § Poor product knowledge § Recommendation for Declining sales § Increase promotion § Create product awareness
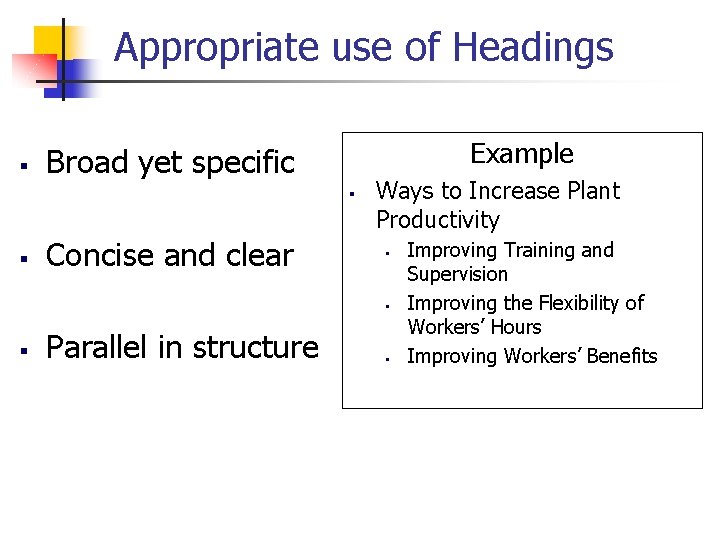
Appropriate use of Headings § Example Broad yet specific § § Concise and clear Ways to Increase Plant Productivity § § § Parallel in structure § Improving Training and Supervision Improving the Flexibility of Workers’ Hours Improving Workers’ Benefits
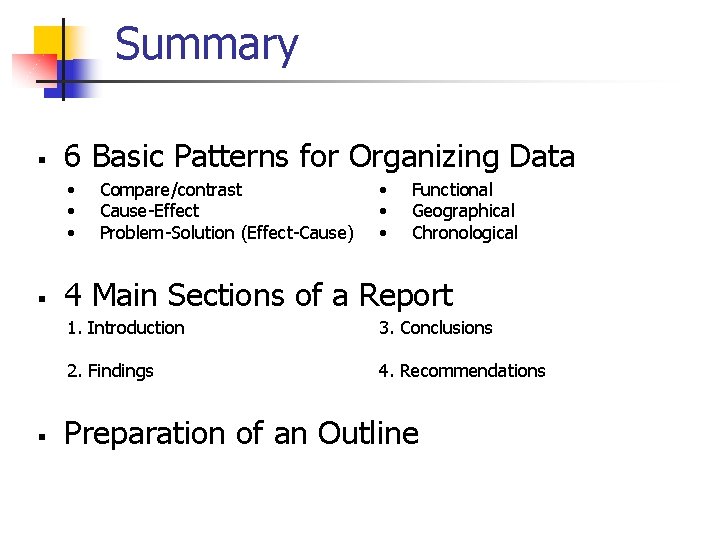
Summary § 6 Basic Patterns for Organizing Data • • • § § Compare/contrast Cause-Effect Problem-Solution (Effect-Cause) • • • Functional Geographical Chronological 4 Main Sections of a Report 1. Introduction 3. Conclusions 2. Findings 4. Recommendations Preparation of an Outline
- Slides: 32