
FAAGMU Project Development of AL MAT 224 Dataset
- Slides: 37
FAA/GMU Project Development of AL MAT 224 Dataset (V 2. 0) AWG Annual Meeting 03/15/2018
Introduction – Revision Need Ø The previously released set of *MAT 224 input parameters for Al-2024 did not produce accurate predictions for all six available sets of ballistic impact data Ø Since the original material model was released, additional mechanical property data has been created by OSU ð High rate Split-Hopkinson Bar tests, with full field strains measured by DIC, and temperature rise measured by high-rate thermal imaging § We have become convinced that high rate data without DIC is misleading at best, and at worst, dangerous ð Testing to higher rates ð Failure strains at important, previously unmeasured states of stress, using newly designed test specimens Ø Therefore, it was appropriate to revise the FAA sponsored Al-2024 material model Slide 2
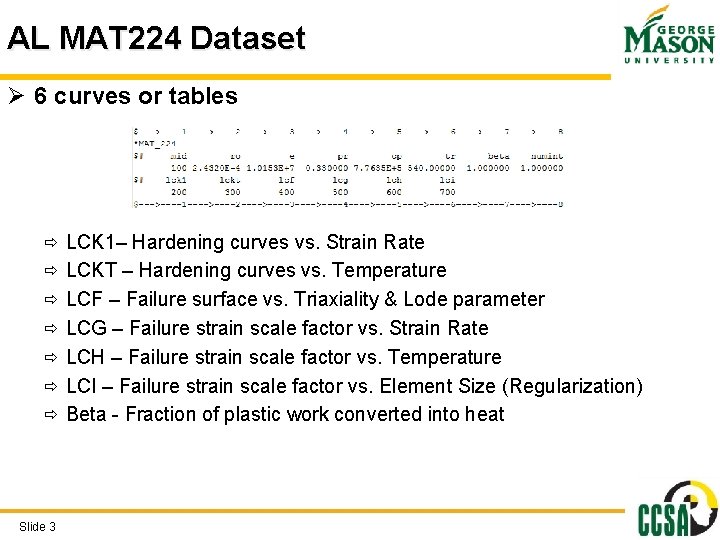
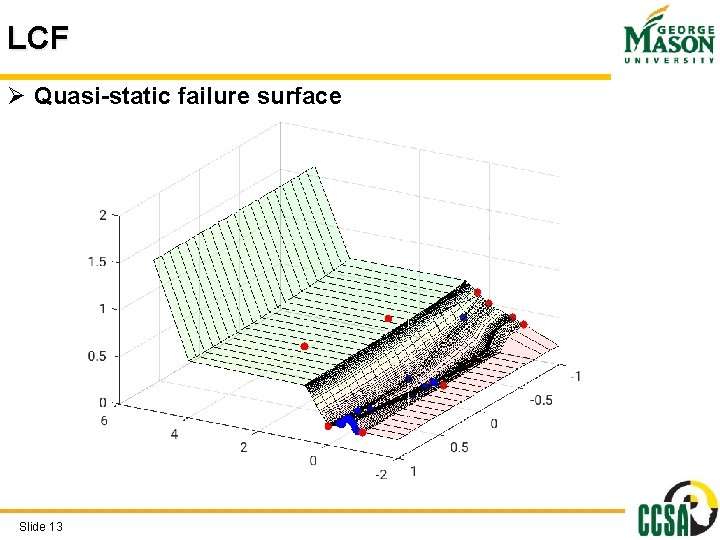
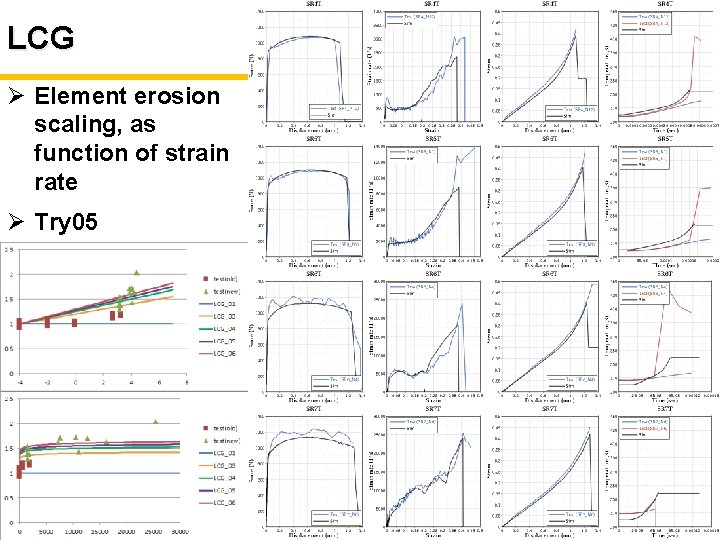
AL MAT 224 Dataset Ø 6 curves or tables ð LCK 1– Hardening curves vs. Strain Rate ð LCKT – Hardening curves vs. Temperature ð LCF – Failure surface vs. Triaxiality & Lode parameter ð LCG – Failure strain scale factor vs. Strain Rate ð LCH – Failure strain scale factor vs. Temperature ð LCI – Failure strain scale factor vs. Element Size (Regularization) ð Beta - Fraction of plastic work converted into heat Slide 3
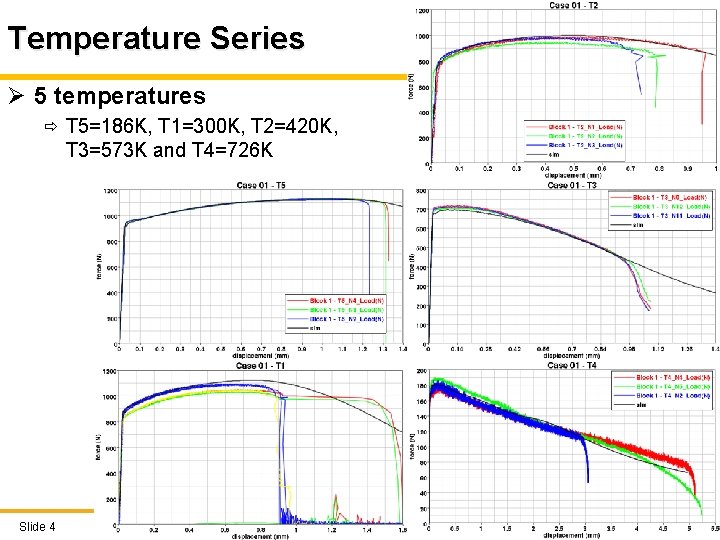
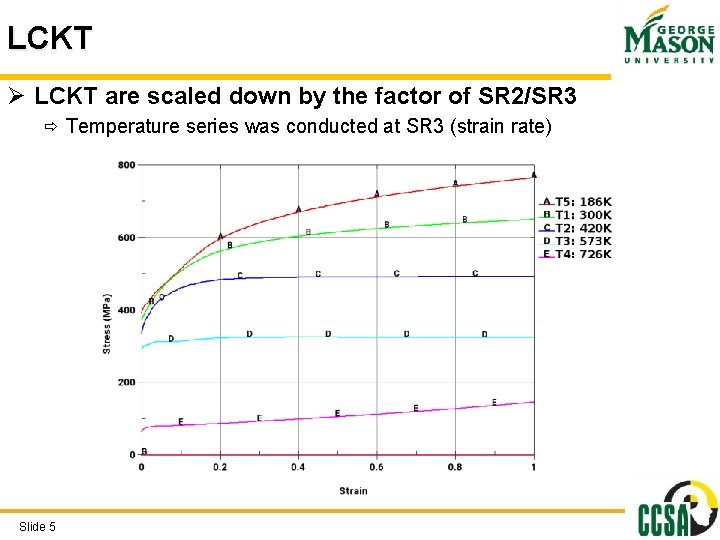
Temperature Series Ø 5 temperatures ð T 5=186 K, T 1=300 K, T 2=420 K, T 3=573 K and T 4=726 K Slide 4
LCKT Ø LCKT are scaled down by the factor of SR 2/SR 3 ð Temperature series was conducted at SR 3 (strain rate) Slide 5
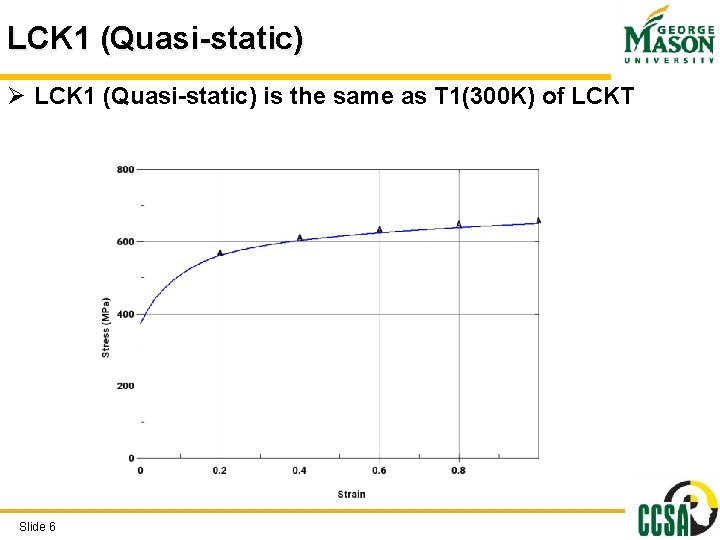
LCK 1 (Quasi-static) Ø LCK 1 (Quasi-static) is the same as T 1(300 K) of LCKT Slide 6
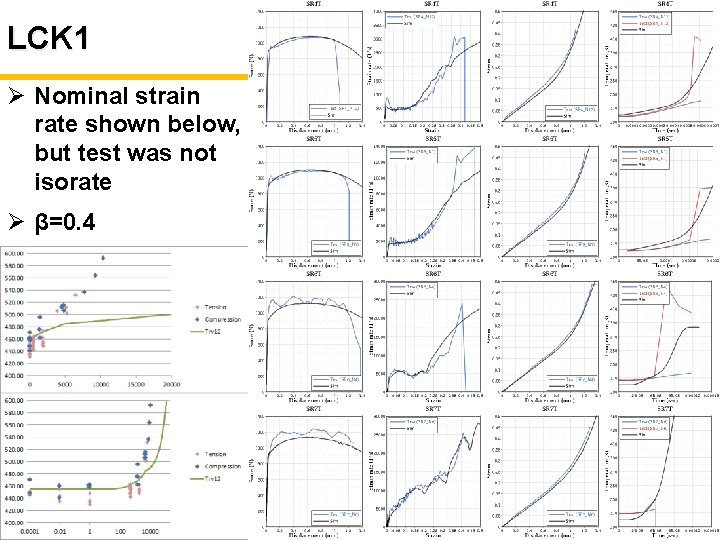
LCK 1 Ø Nominal strain rate shown below, but test was not isorate Ø β=0. 4 Slide 7
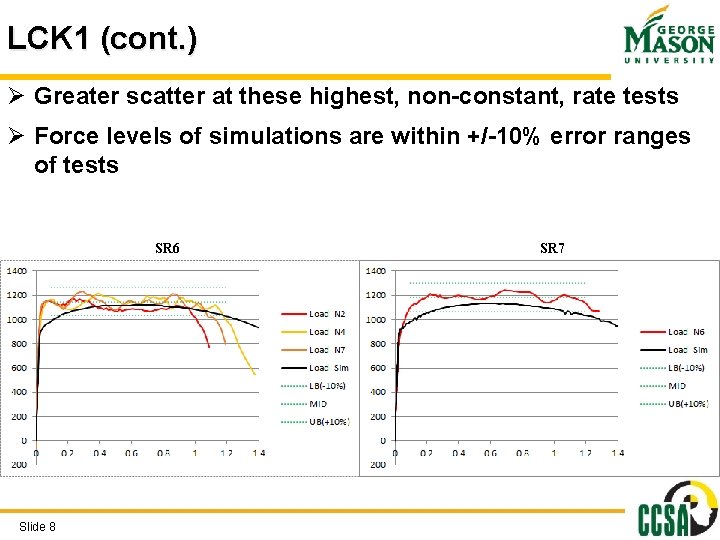
LCK 1 (cont. ) Ø Greater scatter at these highest, non-constant, rate tests Ø Force levels of simulations are within +/-10% error ranges of tests SR 6 Slide 8 SR 7
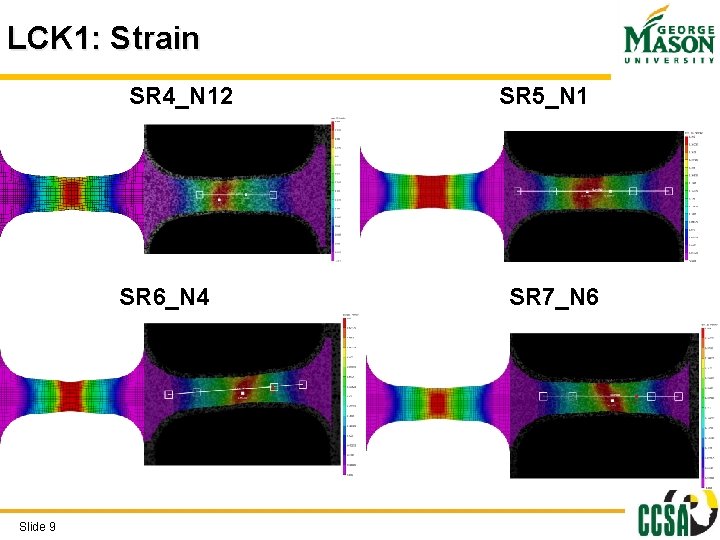
LCK 1: Strain SR 4_N 12 SR 6_N 4 Slide 9 SR 5_N 1 SR 7_N 6
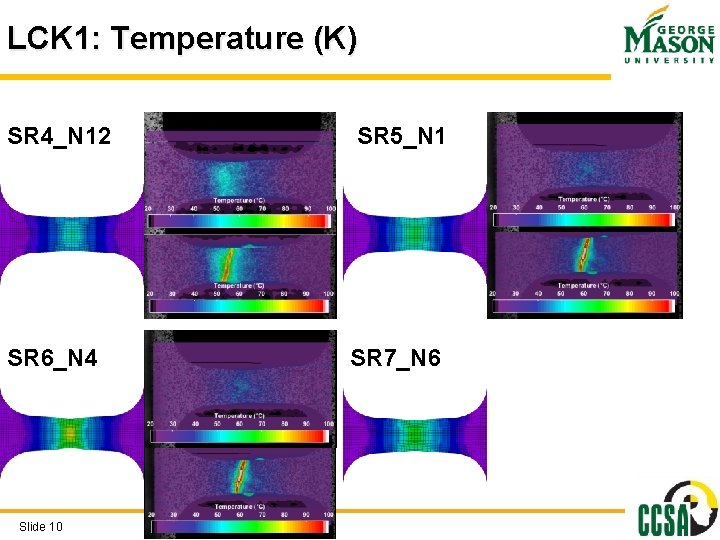
LCK 1: Temperature (K) SR 4_N 12 SR 5_N 1 SR 6_N 4 SR 7_N 6 Slide 10
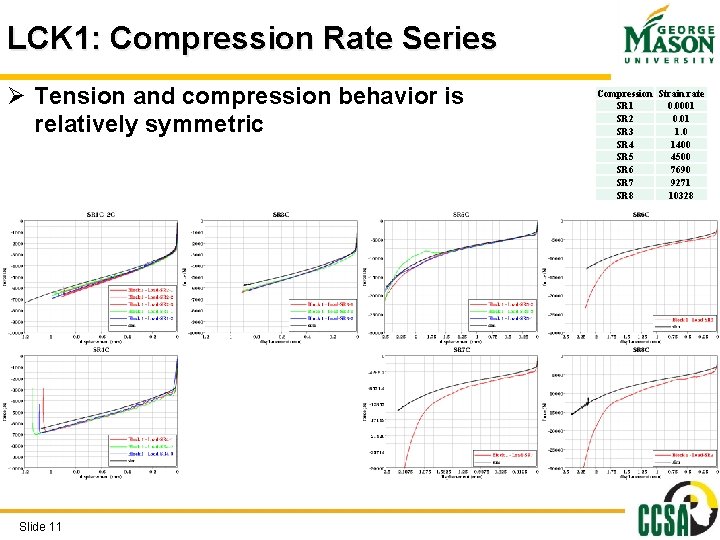
LCK 1: Compression Rate Series Ø Tension and compression behavior is relatively symmetric Slide 11 Compression Strain rate SR 1 0. 0001 SR 2 0. 01 SR 3 1. 0 SR 4 1400 SR 5 4500 SR 6 7690 SR 7 9271 SR 8 10328
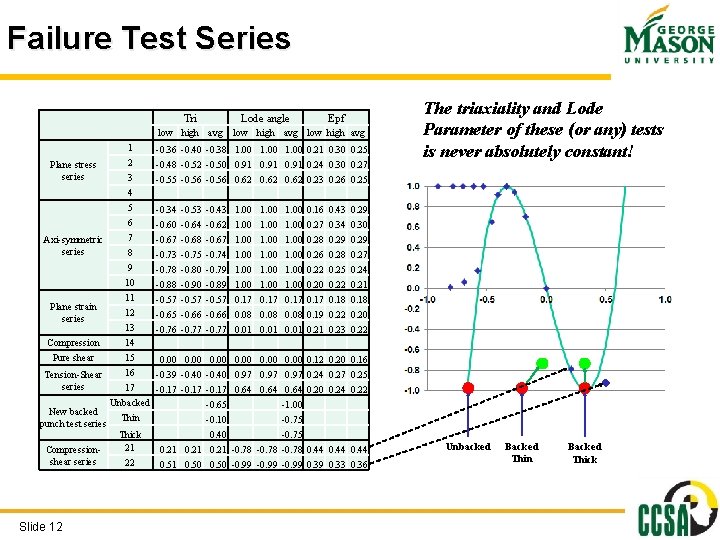
Failure Test Series Tri Lode angle low high avg Plane stress series Axi-symmetric series 1 2 3 4 5 6 7 8 9 10 11 Plane strain 12 series 13 Compression 14 Pure shear 15 16 Tension-Shear series 17 Unbacked New backed Thin punch test series Thick 21 Compressionshear series 22 Slide 12 Epf low high avg -0. 36 -0. 40 -0. 38 1. 00 -0. 48 -0. 52 -0. 50 0. 91 -0. 55 -0. 56 0. 62 -0. 34 -0. 53 -0. 43 1. 00 -0. 64 -0. 62 1. 00 -0. 67 -0. 68 -0. 67 1. 00 -0. 73 -0. 75 -0. 74 1. 00 0. 21 0. 30 0. 25 0. 91 0. 24 0. 30 0. 27 0. 62 0. 23 0. 26 0. 25 1. 00 0. 16 0. 43 0. 29 1. 00 0. 27 0. 34 0. 30 1. 00 0. 28 0. 29 1. 00 0. 26 0. 28 0. 27 -0. 78 -0. 88 -0. 57 -0. 65 -0. 76 1. 00 0. 17 0. 08 0. 01 -0. 80 -0. 90 -0. 57 -0. 66 -0. 77 -0. 79 -0. 89 -0. 57 -0. 66 -0. 77 1. 00 0. 17 0. 08 0. 01 0. 00 -0. 39 -0. 40 0. 97 -0. 17 0. 64 -0. 65 -0. 10 0. 40 0. 21 -0. 78 0. 51 0. 50 -0. 99 1. 00 0. 17 0. 08 0. 01 0. 00 0. 97 0. 64 -1. 00 -0. 75 -0. 78 -0. 99 0. 22 0. 20 0. 17 0. 19 0. 21 0. 25 0. 22 0. 18 0. 22 0. 23 The triaxiality and Lode Parameter of these (or any) tests is never absolutely constant! 0. 24 0. 21 0. 18 0. 20 0. 22 0. 12 0. 20 0. 16 0. 24 0. 27 0. 25 0. 20 0. 24 0. 22 0. 44 0. 39 0. 33 0. 36 Unbacked Backed Thin Backed Thick
LCF Ø Quasi-static failure surface Slide 13
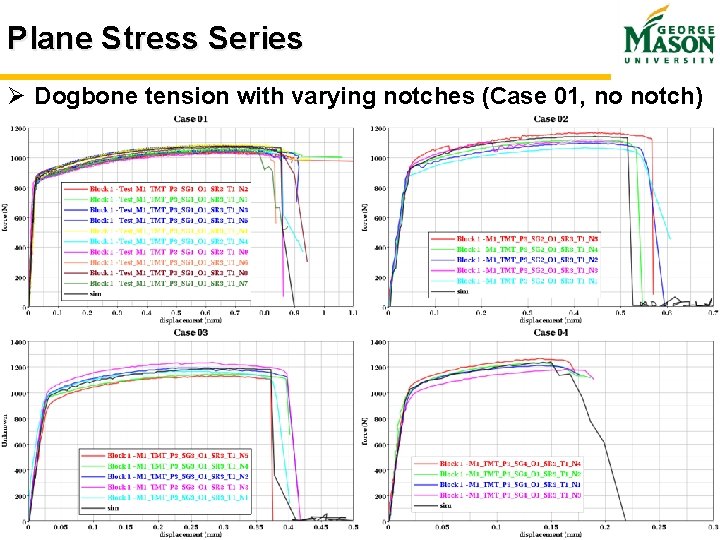
Plane Stress Series Ø Dogbone tension with varying notches (Case 01, no notch) Slide 14
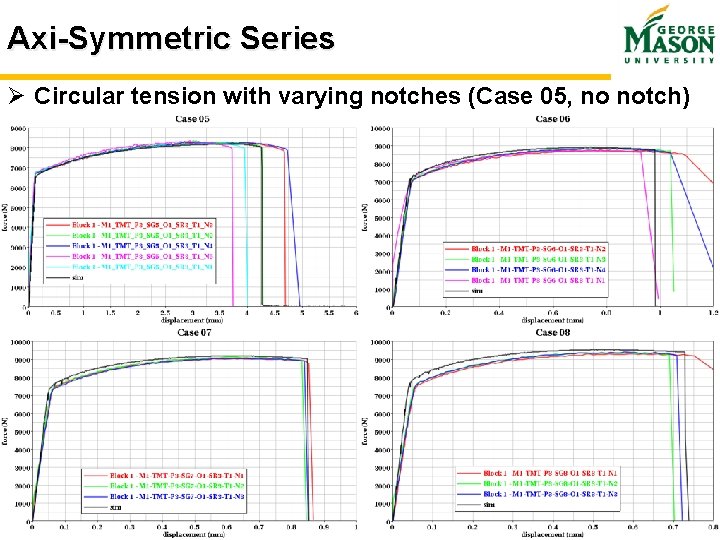
Axi-Symmetric Series Ø Circular tension with varying notches (Case 05, no notch) Slide 15
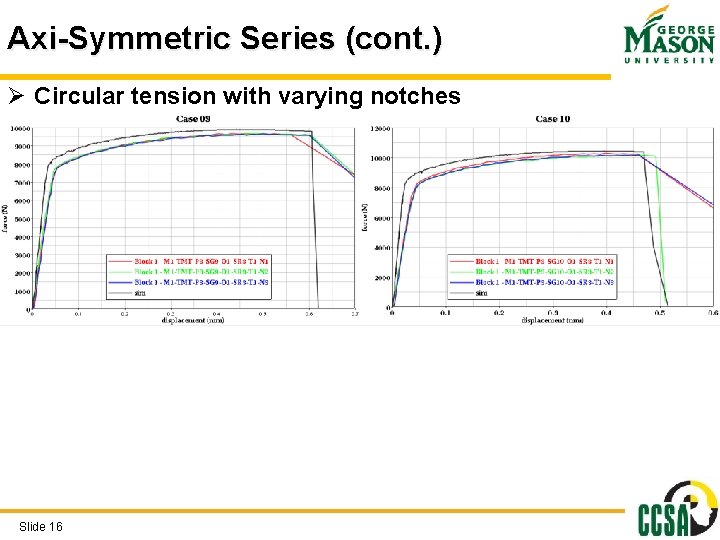
Axi-Symmetric Series (cont. ) Ø Circular tension with varying notches Slide 16
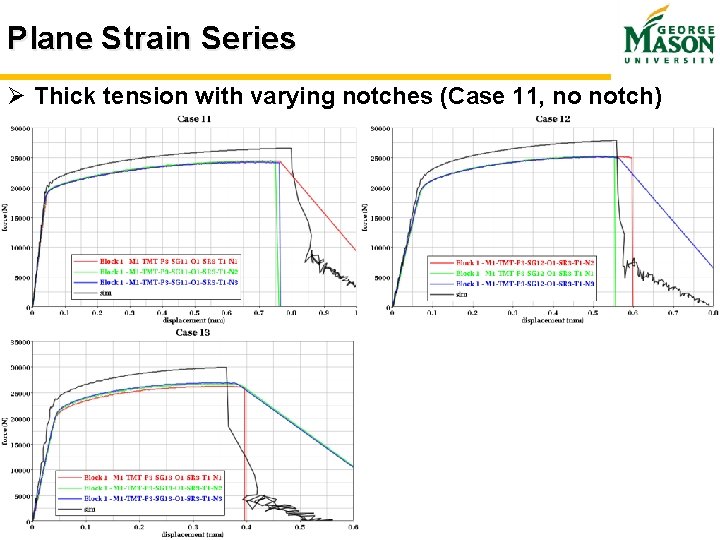
Plane Strain Series Ø Thick tension with varying notches (Case 11, no notch) Slide 17
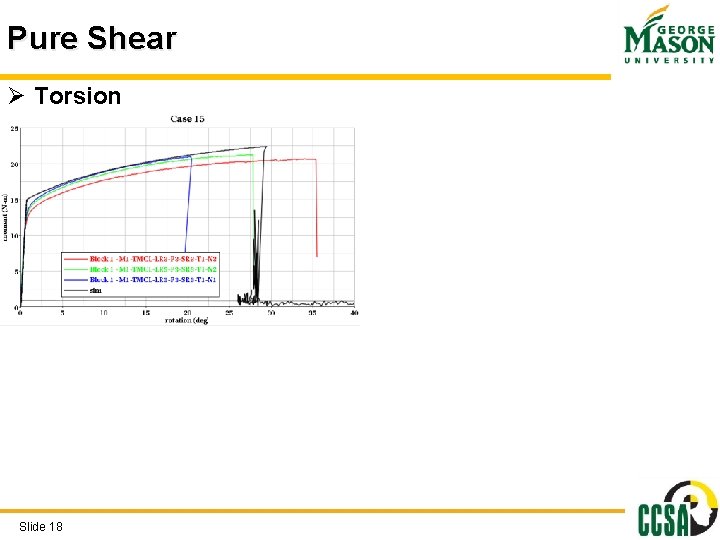
Pure Shear Ø Torsion Slide 18
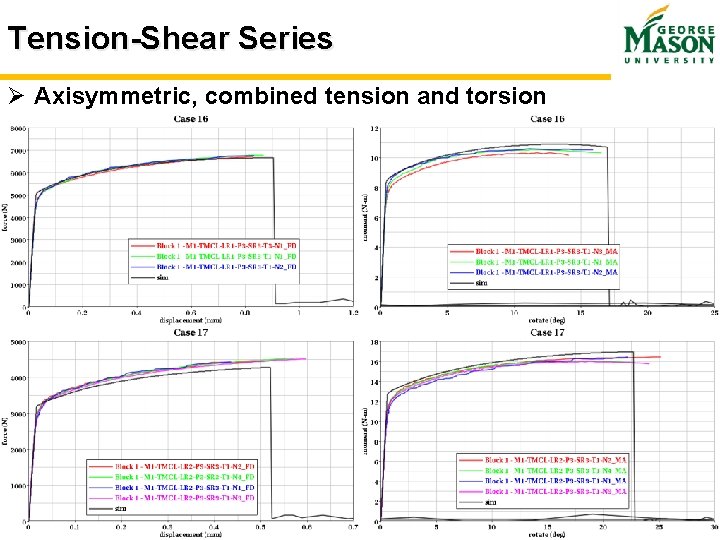
Tension-Shear Series Ø Axisymmetric, combined tension and torsion Slide 19
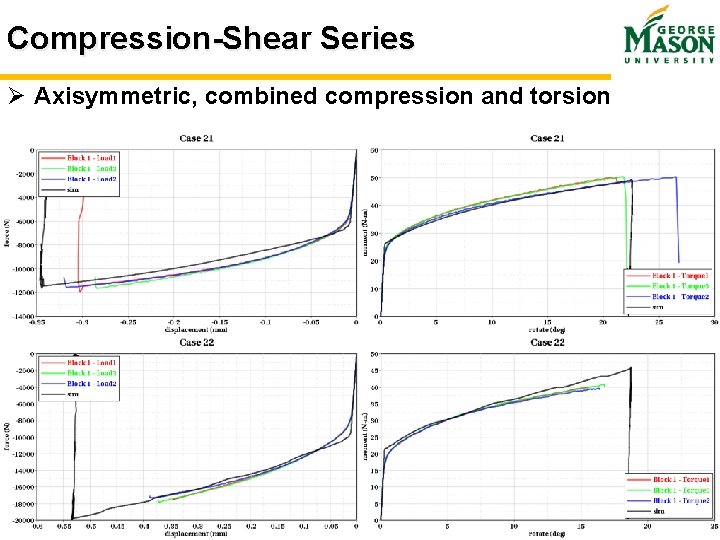
Compression-Shear Series Ø Axisymmetric, combined compression and torsion Slide 20
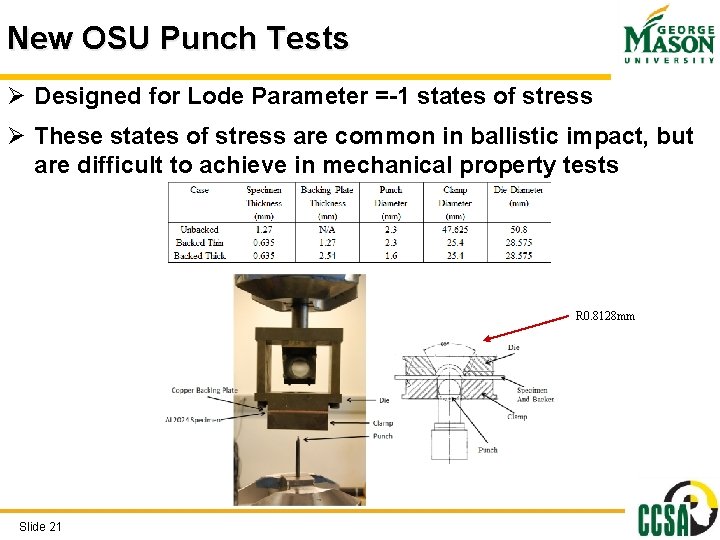
New OSU Punch Tests Ø Designed for Lode Parameter =-1 states of stress Ø These states of stress are common in ballistic impact, but are difficult to achieve in mechanical property tests R 0. 8128 mm Slide 21
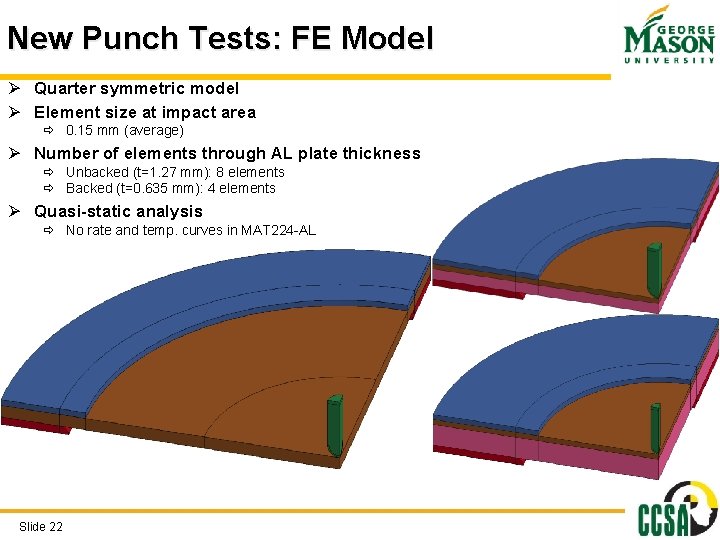
New Punch Tests: FE Model Ø Quarter symmetric model Ø Element size at impact area ð 0. 15 mm (average) Ø Number of elements through AL plate thickness ð Unbacked (t=1. 27 mm): 8 elements ð Backed (t=0. 635 mm): 4 elements Ø Quasi-static analysis ð No rate and temp. curves in MAT 224 -AL Slide 22
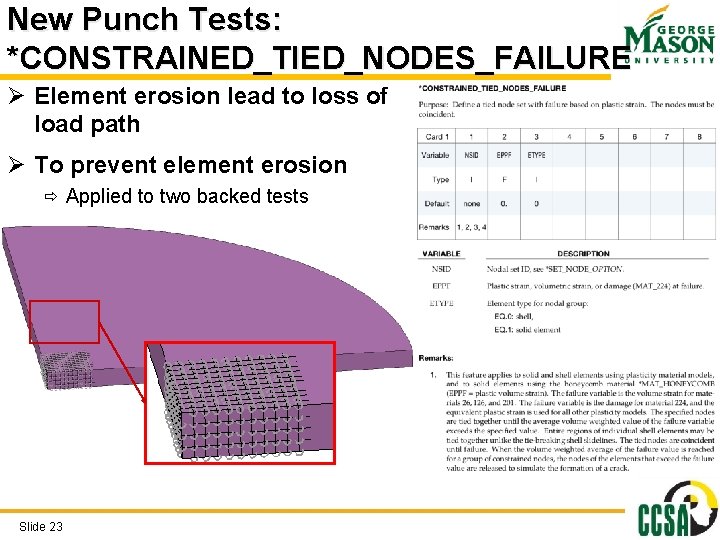
New Punch Tests: *CONSTRAINED_TIED_NODES_FAILURE Ø Element erosion lead to loss of load path Ø To prevent element erosion ð Applied to two backed tests Slide 23
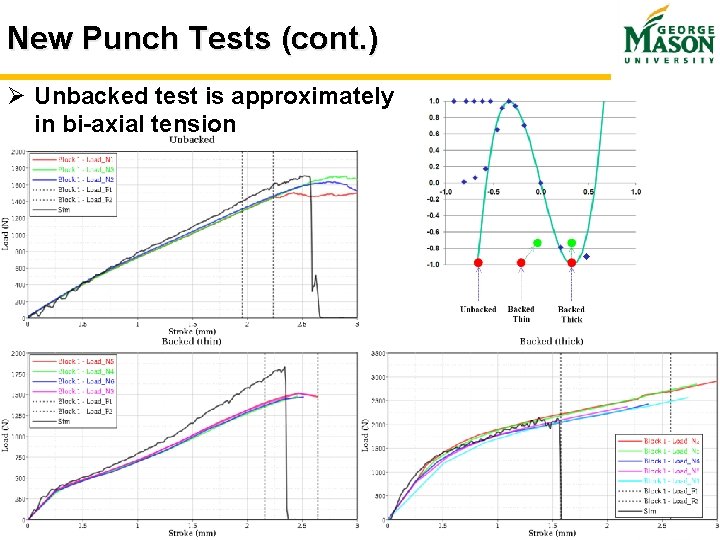
New Punch Tests (cont. ) Ø Unbacked test is approximately in bi-axial tension Slide 24
LCG Ø Element erosion scaling, as function of strain rate Ø Try 05 Slide 25
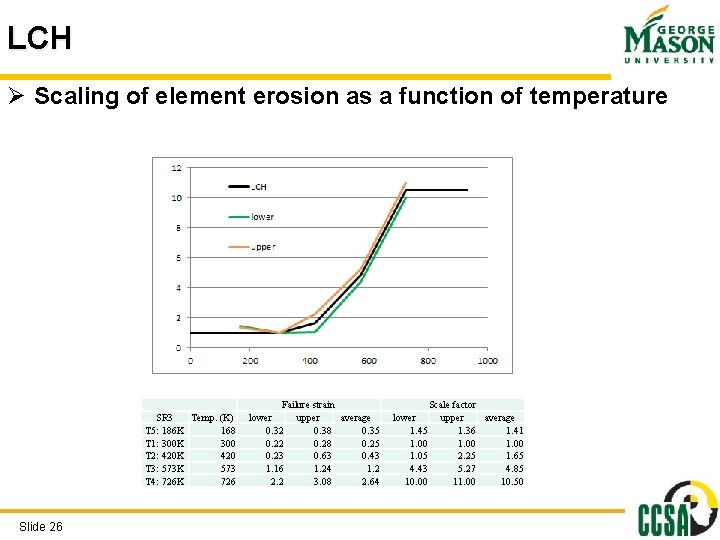
LCH Ø Scaling of element erosion as a function of temperature SR 3 Temp. (K) T 5: 186 K 168 T 1: 300 K 300 T 2: 420 K 420 T 3: 573 K 573 T 4: 726 K 726 Slide 26 Failure strain lower upper average 0. 32 0. 38 0. 35 0. 22 0. 28 0. 25 0. 23 0. 63 0. 43 1. 16 1. 24 1. 2 2. 2 3. 08 2. 64 lower 1. 45 1. 00 1. 05 4. 43 10. 00 Scale factor upper average 1. 36 1. 41 1. 00 2. 25 1. 65 5. 27 4. 85 11. 00 10. 50
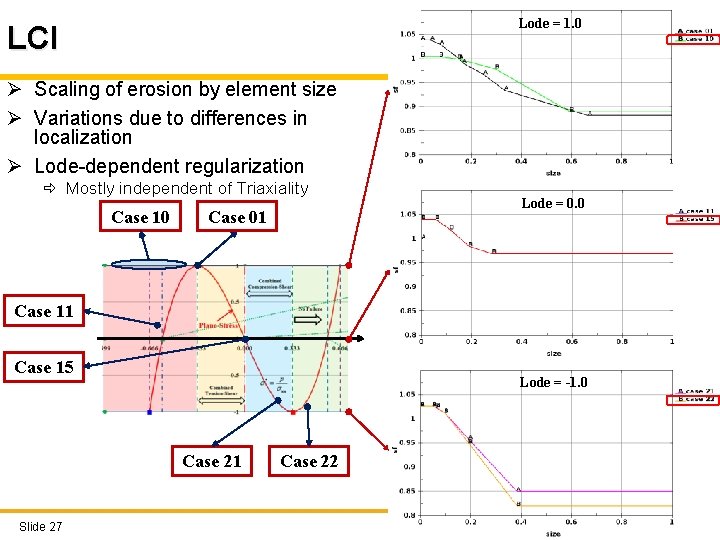
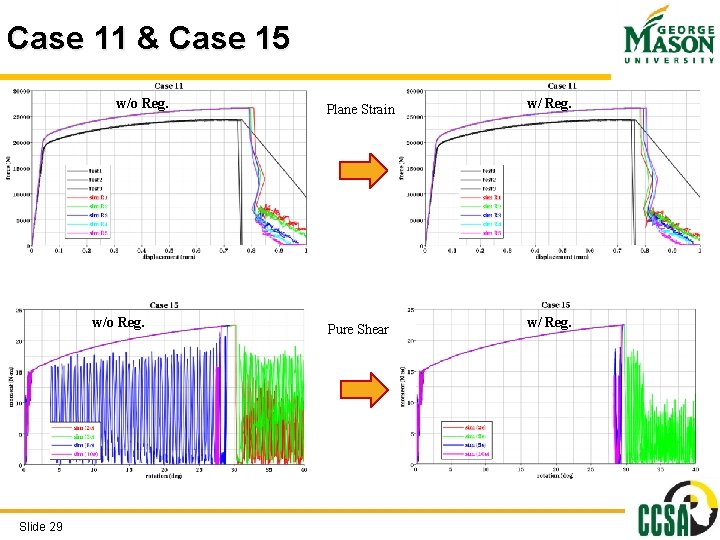
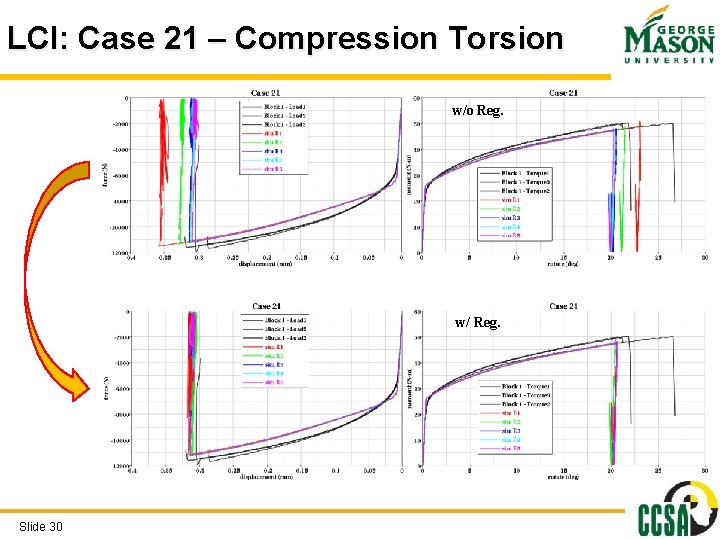
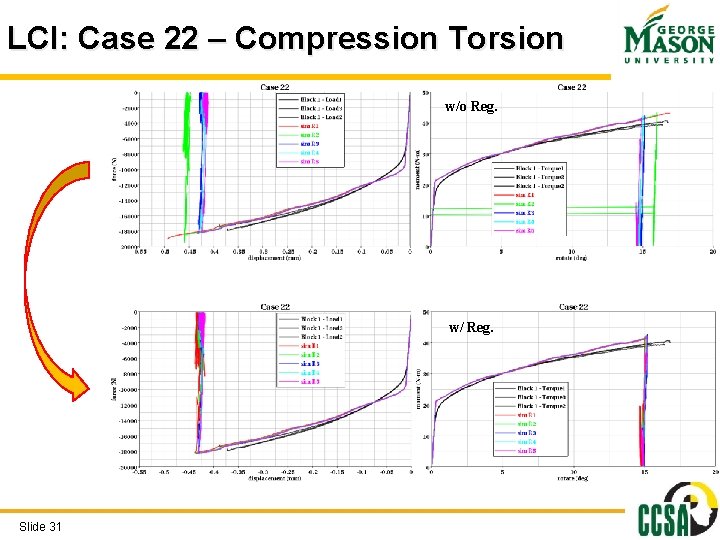
Lode = 1. 0 LCI Ø Scaling of erosion by element size Ø Variations due to differences in localization Ø Lode-dependent regularization ð Mostly independent of Triaxiality Case 10 Case 01 Lode = 0. 0 Case 11 Case 15 Lode = -1. 0 Case 21 Slide 27 Case 22
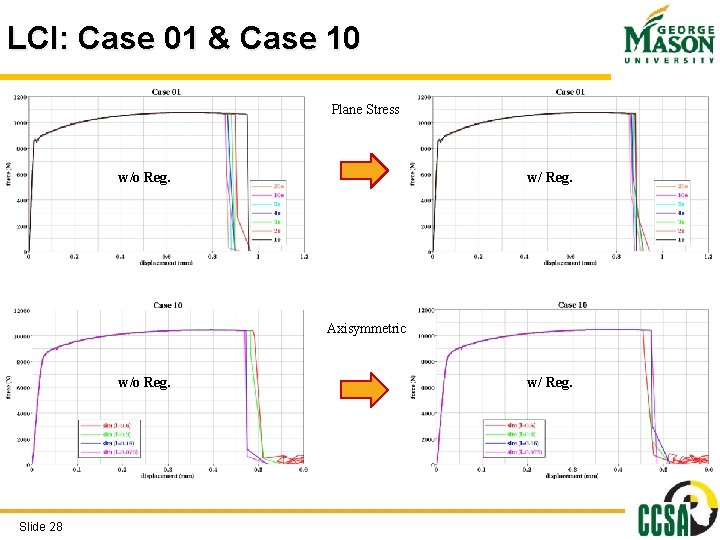
LCI: Case 01 & Case 10 Plane Stress w/ Reg. w/o Reg. Axisymmetric w/o Reg. Slide 28 w/ Reg.
Case 11 & Case 15 w/o Reg. Slide 29 Plane Strain Pure Shear w/ Reg.
LCI: Case 21 – Compression Torsion w/o Reg. w/ Reg. Slide 30
LCI: Case 22 – Compression Torsion w/o Reg. w/ Reg. Slide 31
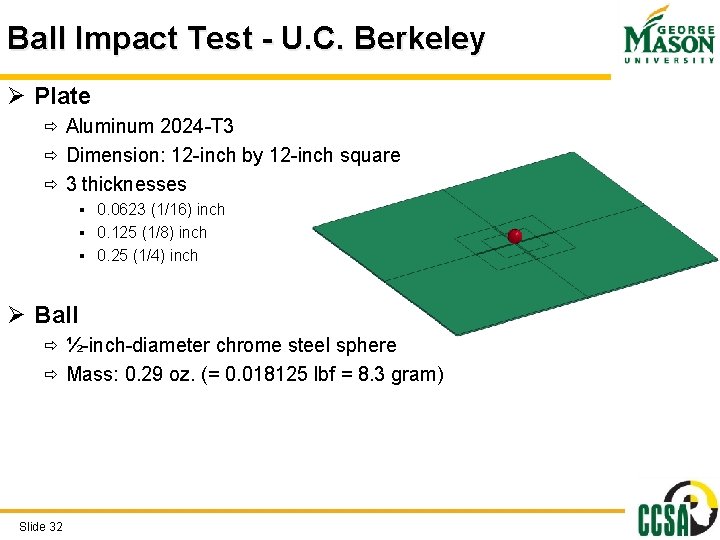
Ball Impact Test - U. C. Berkeley Ø Plate ð Aluminum 2024 -T 3 ð Dimension: 12 -inch by 12 -inch square ð 3 thicknesses § 0. 0623 (1/16) inch § 0. 125 (1/8) inch § 0. 25 (1/4) inch Ø Ball ð ½-inch-diameter chrome steel sphere ð Mass: 0. 29 oz. (= 0. 018125 lbf = 8. 3 gram) Slide 32
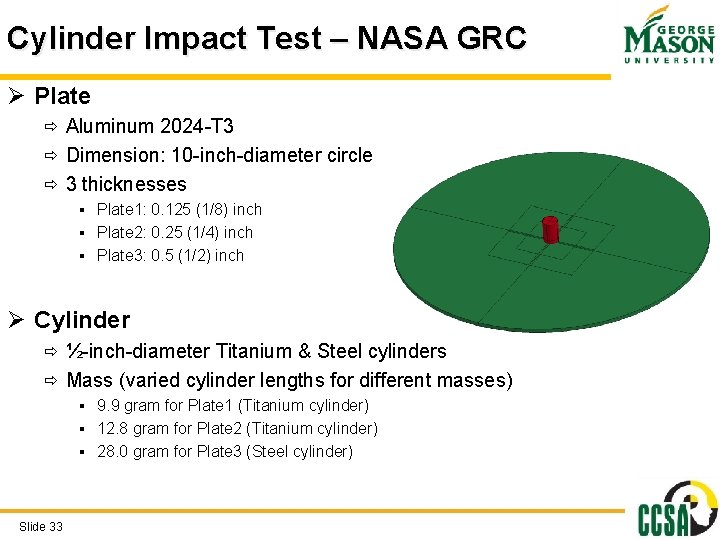
Cylinder Impact Test – NASA GRC Ø Plate ð Aluminum 2024 -T 3 ð Dimension: 10 -inch-diameter circle ð 3 thicknesses § Plate 1: 0. 125 (1/8) inch § Plate 2: 0. 25 (1/4) inch § Plate 3: 0. 5 (1/2) inch Ø Cylinder ð ½-inch-diameter Titanium & Steel cylinders ð Mass (varied cylinder lengths for different masses) § 9. 9 gram for Plate 1 (Titanium cylinder) § 12. 8 gram for Plate 2 (Titanium cylinder) § 28. 0 gram for Plate 3 (Steel cylinder) Slide 33
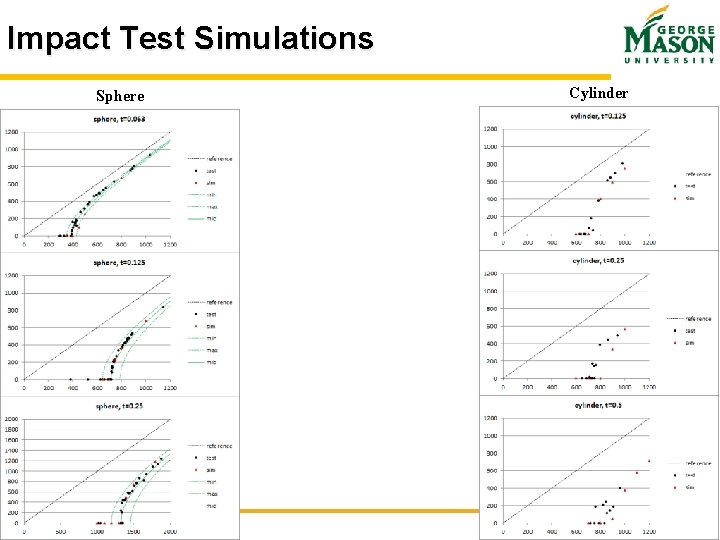
Impact Test Simulations Sphere Slide 34 Cylinder
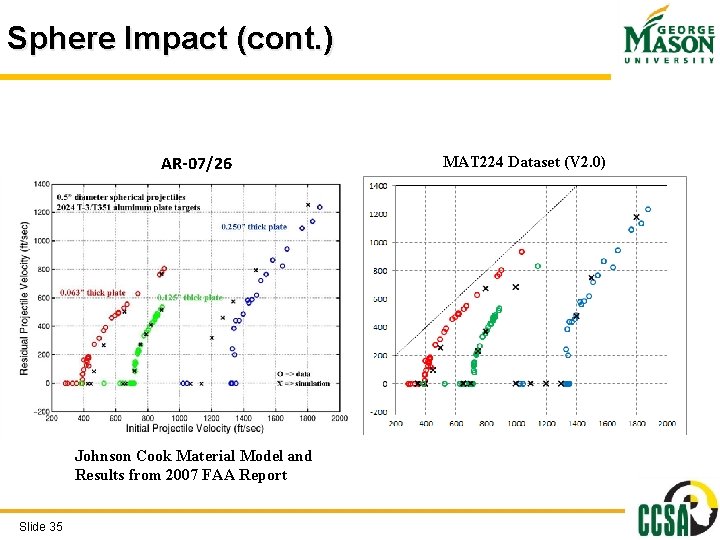
Sphere Impact (cont. ) AR-07/26 Johnson Cook Material Model and Results from 2007 FAA Report Slide 35 MAT 224 Dataset (V 2. 0)
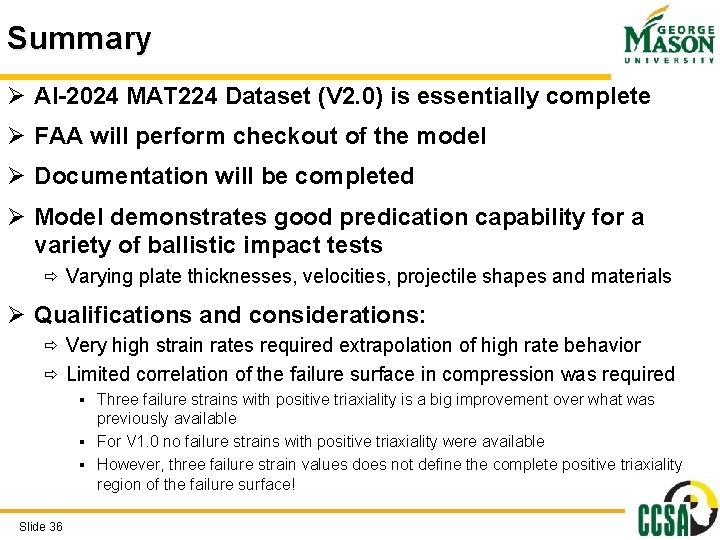
Summary Ø Al-2024 MAT 224 Dataset (V 2. 0) is essentially complete Ø FAA will perform checkout of the model Ø Documentation will be completed Ø Model demonstrates good predication capability for a variety of ballistic impact tests ð Varying plate thicknesses, velocities, projectile shapes and materials Ø Qualifications and considerations: ð Very high strain rates required extrapolation of high rate behavior ð Limited correlation of the failure surface in compression was required § Three failure strains with positive triaxiality is a big improvement over what was previously available § For V 1. 0 no failure strains with positive triaxiality were available § However, three failure strain values does not define the complete positive triaxiality region of the failure surface! Slide 36
Thanks Slide 37