Extreme inequality evidence from Brazil India the Middle

Extreme inequality: evidence from Brazil, India, the Middle East and South Africa Lydia Assouad Lucas Chancel Marc Morgan American Economic Association Annual Meeting | Global Inequality and Policy January 6, 2018 | Philadelphia, PA

Introduction: re-examining extreme inequality with more systematic data § Long run income inequality dynamics in high income countries has been relatively well documented. However, up to very recently in many emerging countries, lack of data to systematically track income inequality. § Recent release of new administrative tax data in these countries. Systematic combination of this novel data with survey data and national accounts allows us to re-examine the structure and dynamics of income inequality. § Focus on Brazil, India, the Middle East and South Africa: regions characterized by extreme inequality levels today. 2

PART I Dealing with data limitations to measure inequality in emerging countries § Official data based on self reported household surveys tend to underestimate top income levels. (Cf. « Arab inequality puzzle » for example. ) § Reconstructing more reliable estimates based on additional sources is fraught with methodological difficulties (gap between survey and national accounts, inconsistencies between micro and macro concepts). § Systematic reconstructions based on fiscal data, surveys and national accounts (in line with « Distributional National Accounts » ) are however possible and stand out as robust to a wide range of alternative assumptions. 3

Survey data often miss a large part of the picture: in Brazil, recent decrease in inequality according to household surveys, not in corrected estimates. 4

The missing income challenge in emerging countries § Survey income represents around 30 -50% of national income in emerging countries. Ratios sometimes higher (60% Brazil in recent years) but can be as low as 20 -30% (eg. Gulf countries). § How is missing income distributed? Some argue that all of it goes to the top (Lakner and Milanovic, 2013) method likely to overestimate of inequality. 5

Distributional National Accounts framework: systematic combination of fiscal data, household surveys and nat. accounts we seek to distribute National Income § We prefer to use Generalized pareto interpolation (Blanchet et al. 2017) to merge survey data and fiscal data. § We assume that surveys are accurate from percentile p 0, up to a given percentile of the distribution (p 1) and that tax data is accurate from percentile p 2 up to the top. § p 2 is given by number of income tax payers, we test different values for p 1 and different junction profiles between p 1 and p 2. § We then upgrade proportionally all groups so that total income matches national income to facilitate international comparisons (this modifies income levels but no impact on shares). 6

Combining fiscal and survey data bridges part of the gap to national income, not all of it. Remaining missing income distributed to all groups (no impact on shares). 7

Impact of alternative scenarios on inequality estimates: the case of India (benchmark on the lower bound) Source: Chancel & Piketty (2017) 8

PART II The world inequality frontier and the structure of extreme inequality § Income inequality in Brazil, India, the Middle East and South Africa is characterized by very high top 10% share and remarkably low middle 40%. § Question: these four countries/regions set a world inequality frontier? § At the top, income levels in extreme inequality countries similar to highincome countries, but extremely low income levels at the bottom. 10

Brazil, India, the Middle East, South Africa: the world inequality frontier ? 11 11

Brazil, India, the Middle East and South Africa: top 10% income share above 50% and particularly low middle 40% income share (around 30%, vs. 40% in Europe / US) 12

The top groups in extreme inequality regions have income levels broadly similar to high-income countries. 14

PART III The multifaceted origins of extreme inequality § Extreme income inequality generally associated with historical legacy of racial discrimination and rigid inequality status (S. Africa, Brazil, India). § There are exceptions though. Middle East: geographical concentration of oil resources, arbitrary frontiers drawn by the West. India: combination of historical social segregation and post-1980 s unequal growth. 16

Brazil: slightly better-off bottom 50%, elite maintained, squeezed middle class. ↑ transfers and ↓ labour inequality but lack of major land fiscal land reform Top 10%, Middle 40% and Bottom 50% national income shares in Brazil, 2001 -2015 17

South Africa: despite end of the Apartheid in 1994, no major land or fiscal reform. Top 10% and top 1% income share in S. Africa, Middle East, Brazil 18

The Middle-East: enormous between-country inequality due to the geography of oil ownership. 19

…along with large within-country inequality in Gulf countries, dual society of migrants vs. natives 20

India: a very unequalizing liberalization and deregulation process initiated in the 1980 s. The top 0. 1% captured more growth than the bottom 50% since 1980. 21
")
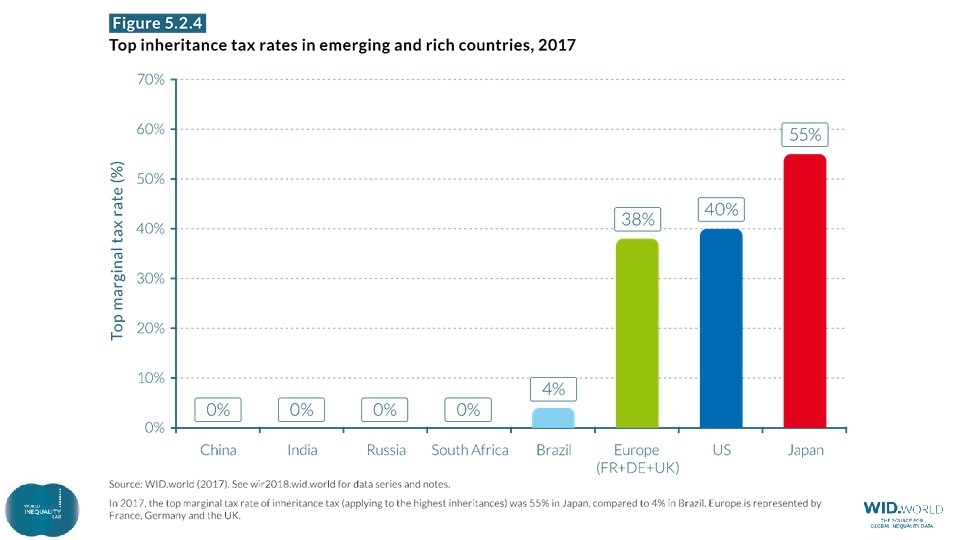
Concluding remarks § Different origins of extreme inequality. Oil, frontiers and finance (Middle East) as well as liberalization & deregulation (India) can be at least as powerful income inequality generating mechanisms as slavery and racial discrimination (Brazil, SA). § Striking similarities: presence of regressive tax systems in all the five countries, high indirect taxation and (near) absence of inheritance taxes. § More and better data is critical to assess to address extreme inequality levels. In certain countries, there is an issue with data transparency and quality per se, quite independent of the levels of inequality observed. Need for reconciliation of surveys and national accounts, making tax data more transparent. 22

- Slides: 21