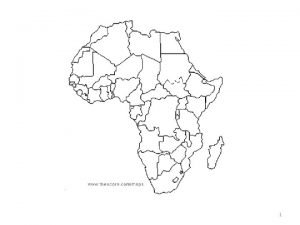
Export Performance of Africa LOGO 1 Africa continent


- Slides: 39

Export Performance of Africa LOGO 1

Africa… continent of diversity u 54 countries u 1. 1 billion people (2013) u u Ethnic diversity Languages Geography Climate 2

Africa… common features u Colonial history u Aid recipients u Economic crisis in 1980 s u Regional agreements in place u … 3

u Sub-Saharan Africa: country groupings 4

u Sub-Saharan Africa: regional groupings 5

Economic Performance of Africa u by the early 1960 s n n two-way relationship between African countries and their former colonial powers exported primary commodities and imported manufactured products u from the 1960 s to the 1980 s n n n import-substitution industrialization significant trade restrictions both in import and export exchange rate overvalued u in the late 1970 s and early 1980 s n large scale economic crisis in sub-Saharan Africa n n externally, global economic crisis following the two oil crises of 1973 and 1979 domestically, failure of import-substitution industrialization and low competitiveness 6

Economic Growth in Africa (Source: World Bank) 7

Reorientation of trade u Historic reorientation of trade and investment towards new partners since mid 2000 s n n n decreased dependence on DAC countries more with non-traditional (emerging) partners, including those within the region n accounting about 50% of SSA’s exports and almost 60% of its imports n driven mostly by the large economics of BICs (Brazil, India and China) through trade creation rather than trade diversion 8

Trade Reform in the past u Trade policies in 1960~1980 s n n import-substitution industrialization with significant trade restriction n n NTMs: quantitative import restrictions, import licenses high and complex tariff excessive export taxes and strict regulations, especially on agricultural exports highly overvalued exchange rates continued deterioration of economic performance u Structural adjustment program in early 1980 s n n n market-oriented policy package wide trade liberalization by the mid-1990 s, most African countries had undertaken these programs designed by/with IMF/WB 9

Effects of Trade Reform? u Expected positive effects of trade liberalization n n greater production in tradable sector and improved export performances by shifting the incentive structure greater investment greater specialization and “learning by doing” improved total factor productivity with more efficient technology also leading trade diversification 10

Tariff and NTM Reform u As to NTMs, Africa is one of the world’s lowest. u Tariffs, on average, were reduced by 40 % (1995 -2006) but still remain comparatively high, with considerable heterogeneity among countries. By mid- to late -1990 s, most African countries had liberalized their trade policies. 11

After Trade Liberalization u Trade liberalization tends to stimulate imports as well as export, with the former effects dominating, thereby worsening the balance of trade. n In Africa, the limited export response was responsible for the increased trade deficit. 12

After Trade Liberalization u Africa’s disappointing export performance n n not because trade liberalization has no effects but because of weak export momentum and domestic policies 13

After Trade Liberalization: Export Structure u Composition of merchandise exports in developing regions, 1995– 2006 n n Sub-Saharan Africa is the region with the highest dependence on primary product exports, especially fuel However, a large majority of African countries are not fuel exporters African countries’ export structure, 1995– 2006 averages 14

After Trade Liberalization: Export Structure u African exports by type, as a percentage of GDP, 1995– 2006 n Little changes in manufacturing or primary product exports when fuels are excluded. 15

After Trade Liberalization: Export Structure u Export concentration index, 2006 n African countries have become increasingly dependent on a limited number of commodities. 16

After Trade Liberalization: Export Destination u African export destinations in 1960 and 2006 n n African countries have diversified their export markets away from Europe, and the importance of North America, especially the United States, has grown considerably However, the export destination didn’t change greatly. 17

Overall Evaluation u Export performance in African countries following trade liberalization has been disappointing. n n n Overall trade balance in African countries has deteriorated since liberalization. African exports continued to grow at a lower rate than in other regions in volume terms and it is only the rising prices of fuels, minerals and other primary commodities Export diversification is very low in Africa. 18

Reorientation toward new markets u After a long history of reliance on trade with and investment from Europe and North America, sub-Saharan African countries are increasingly engaging with other partners, including those in their region. n n Fast-paced Faster than in other regions Driven mostly by large emerging economies Associated with expanding intraregional trade Regional Economic Outlook: Sub-Saharan Africa (IMF, 2011) 19

Total Exports and Imports by Partners u with BCIs u intra-regional u Partly resulted from increasing oil-related trade with emerging economies 20

Total Exports and Imports by Partners u Sub-Saharan Africa Non-Oil-Exporting Countries n n Excludes Angola, Cameroon, Chad, Republic of Congo, Equatorial Guinea, Gabon, and Nigeria Similar reorientation in non-oil exporting countries 21

Total Exports and Imports by Partners u Export of Sub-Saharan African Countries by group n Largely homogeneous across the region 22

Higher than predicted? 23

Sector Composition of Reorientation u What kinds of products are driving the reorientation of sub-Saharan Africa export to BICs? n SSA export to BICs are heavily concentrated in primary products, mainly oil (about 70% or more than 80% excluding South Africa). (Sub-Saharan Africa excludes South Africa) 24

Sector Composition of Reorientation u Exports to the Group of Five and Intraregional Exports by Product Composition n n Group of Five: Indonesia, Malaysia, Saudi Arabia, Thailand, United Arab Emirates Higher share of products with higher local value added (Sub-Saharan Africa excludes South Africa) 25

Sector Composition of Reorientation u What products are the main drivers of the reorientation of import from BICs? 26

Sector Composition of Reorientation u What products are the main drivers of the reorientation of import from BICs? 27

Sector Composition of Reorientation u What products are the main drivers of the reorientation of import from BICs? 28

Sophistication of SSA Exports? u Export sophistication over time for goods and services § Static in goods exports § Services exports are increasingly more sophisticated 29

Sophistication of SSA Exports? u Some SSA countries are moving up the value chain or entering new, more sophisticated markets n n Kenya and Ethiopia’s exports of cut flowers and other horticultural products require sophisticated technology and modern services Rwanda has successfully moved up the value chain by exporting branded coffee and has also broken into the U. S. handicrafts market. Mali (fresh mango exports to Europe), Lesotho (apparel exports), and Uganda (frozen fish) managed to break into these areas despite being landlocked. In services, Kenya and Ghana have been leading exporters of business-processing outsourcing, including call center services. n Kenya’s M-PESA: an electronic payment and store-of-value system accessible by mobile phone 30

China’s Investment in SSA u Chinese FDI to sub-Saharan Africa, as a share of total FDI to the region, increased from less than 1 percent in 2003 to 16 percent by 2008. n n in most SSA countries in oil and mining, also in manufacturing sectors by establishing SEZs 31

China’s Investment in SSA u China’s FDI flows to SSA and Low-income Countries 32

China’s Investment in SSA u China’s FDI in selected SSA countries 33

China’s Investment in SSA u China’s Economic and Trade Cooperation Zones in SSA 34

Impact of the trade reorientation u First, sub-Saharan Africa’s trade reorientation is the result of an increase in its trade with emerging partners, not trade diversion, and therefore the region experiences the benefits commonly associated with any expansion in international trade. u Second, trading with a larger number of partners appears to be reducing the region’s historically high export volatility, which could foster its long-term economic growth. u Third, emerging partners’ financing of sub-Saharan Africa’s economic activities can help boost economic growth. u Fourth, growth of emerging partners has an indirect economic benefit for sub-Saharan Africa because it has strengthened commodity prices, thus improving the terms of sub-Saharan Africa’s trade with traditional and nontraditional partners 35

Impact of the trade reorientation Sub-Saharan Africa’s exports to non-DAC partners have become a major engine of export growth for the region. 36

Opportunities u Outsourcing of economic activities to SSA n Especially manufacturing u Low-cost inputs and consumption goods n Imports at a much less costs u Access to more appropriate technologies n Cheaper and less-sophisticated technologies that may be more appropriate for their level of development u Economic benefits from intraregional integration n Promoting horizontal FDI, creating economies of scale and improving production factor allocation within the region 37

Challenges u Natural resources curse n Inadequate management of natural resources wealth can lead to many economic problems u Transitional costs n Failing business and higher unemployment u Rapid structural change n n Substantial changes to the supply of and demand for SSA products Difficult to anticipate 38

LOGO 39
 Continental continental convergent boundary
 Divergent plate boundary
 Second largest continent in the world
 Continental plateau
 Performance challenge fund logo
 Behaviorally anchored rating scale
 Disadvantages of bell curve in performance appraisal
 Jcids process
 Routed export transaction
 катетер export advance
 The coca cola export corporation mexico
 Tsd export files
 Workday export org chart
 Export cartel
 Jira export to pdf
 What is letter of credit in export
 Finland oats
 Indirect export
 How to export data from rapidminer to excel
 Ck import export
 Export financing
 What is export management
 Routed export transaction
 Wine export certification
 Ffsap
Ffsap What is deemed export
 Export animation mathematica
 Export control countries
 Fce export fruit s a c
 Export bill negotiation
 Wine export by country
 Free ipam software
 Pakistan agriculture coalition
 Import and export meaning
 Export marketing and investment assistance
 Export development bank of iran
 Epi info 7
 Damex siemens
 Vrf import export cisco
 Tsg export sa


