Exponential Model Logistic Model Compertz Model Bass Model


목차 Exponential Model Logistic Model Compertz Model Bass Model Technology Adoption Life Cycle

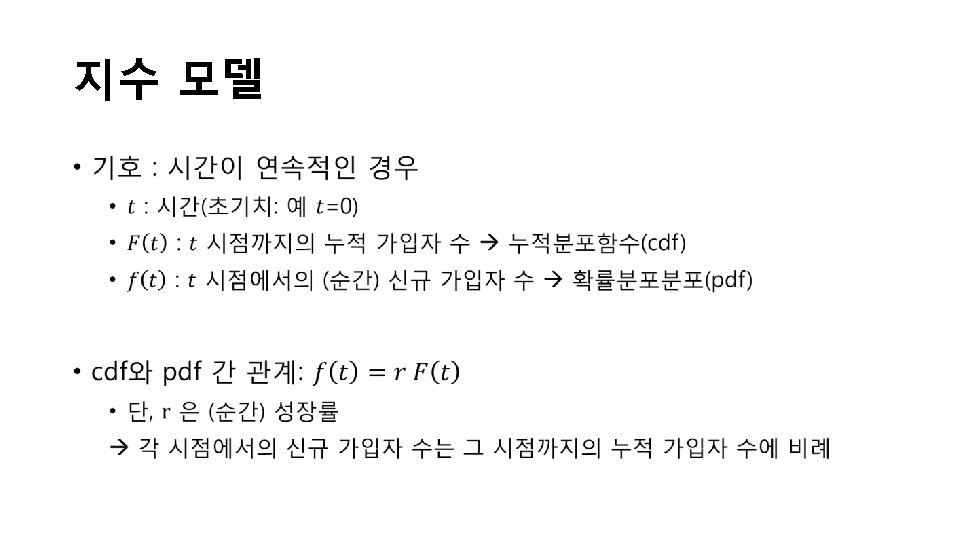
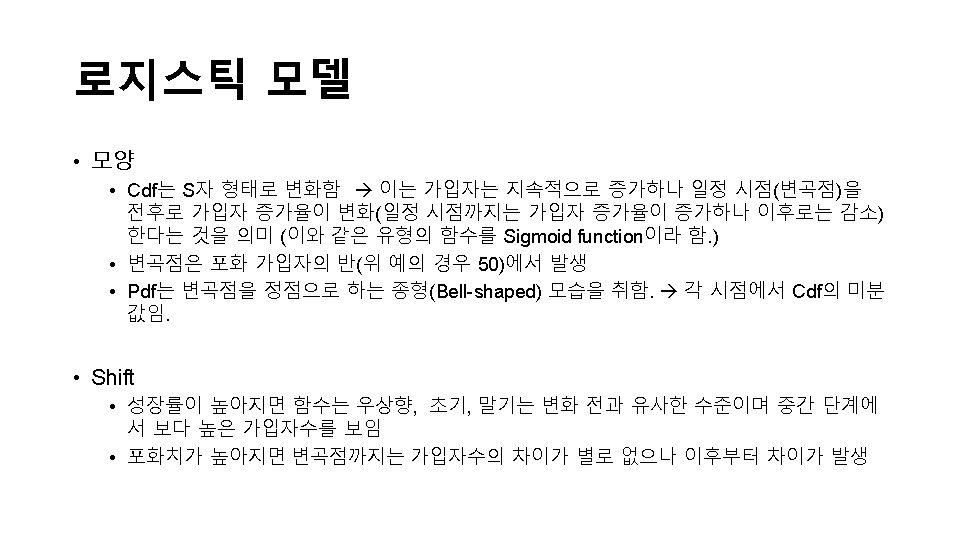
Mobile Subscription: S-Shaped • Question –How can we effectively model the growth of a population over time? – 이들의 형상은 확률밀도함수(pdf)와 확률분포함수(cdf) 간 관계를 어떻게 설정하느냐에 의존

Malthus의 인구론 • It is an evident truth that, whatever may be the rate of increase in the means of subsistence, the increase in population must be limited by it, at least after the food has been divided into the smallest shares that will support life. All the children born, beyond what would be required to keep up the population to this level, must necessarily perish, unless room be made for them by the deaths of grown persons. . To act consistently, therefore, we should facilitate, instead of foolishly and vainly endeavouring to impede, the operation of nature in producing this mortality, and if we dread the too frequent visitation of the horrid form of famine, we should sedulously encourage the other forms of destruction, which we compel nature to use. • Excerpt from ‘An Essay on the Principle of Population’(1798), Thomas Malthus(1766~1834)

Malthus의 인구론 • According to Malthus, population tends to increase faster than the supply of food available for its needs. Whenever a relative gain occurs in food production over population growth, a higher rate of population increase is stimulated; on the other hand, if population grows too much faster than food production, the growth is checked by famine, disease, and war. • Malthus's theory contradicted the optimistic belief prevailing in the early 19 th century, that a society's fertility would lead to economic progress. Malthus's theory won supporters and was often used as an argument against efforts to better the condition of the poor. (MSN Encarta)

Bass Model • The Bass diffusion model was developed by Frank Bass and describes the process of how new products get adopted as an interaction between users and potential users. It has been described as one of the most famous empirical generalisations in marketing, along with the Dirichlet model of repeat buying and brand choice. [1] The model is widely used in forecasting, especially product forecasting and technology forecasting. Mathematically, the basic Bass diffusion is a Riccati equation with constant coefficients. • Frank Bass published his paper "A new product growth model for consumer durables" in 1969. [2] Prior to this, Everett Rogers published Diffusion of Innovations, a highly influential work that described the different stages of product adoption. Bass contributed some mathematical ideas to the concept. [3] • This model has been widely influential in marketing and management science. In 2004 it was selected as one of the ten most frequently cited papers in the 50 -year history of Management Science [4]. It was ranked number five, and the only marketing paper in the list. It was subsequently reprinted in the December 2004 issue of Management Science. [4]

Bass Model •

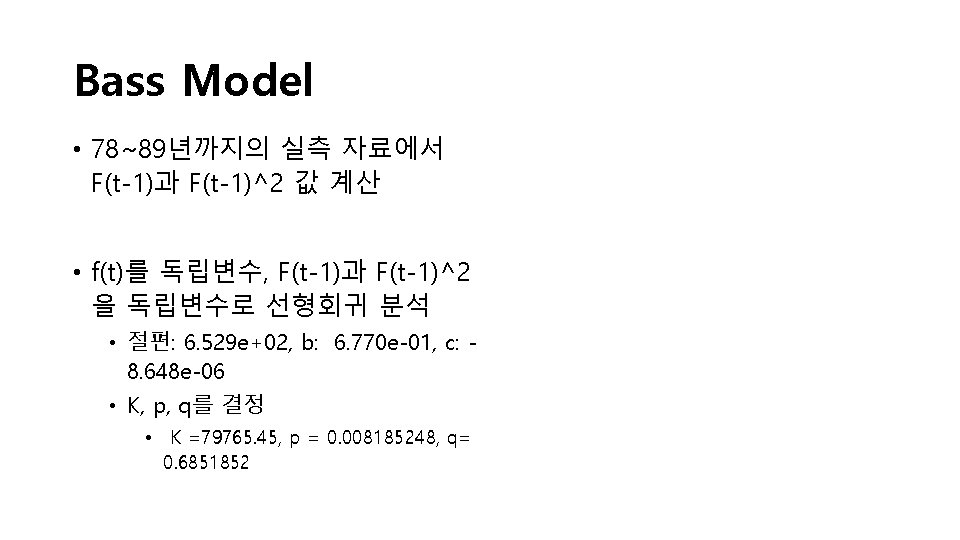
Bass Model Year ft Ft Ftp. 2 78 402 0 0 79 478 880 402 161604 80 804 1684 880 774400 81 1330 3014 1684 2835856 82 2030 5044 3014 9084196 83 4020 9064 5044 25441936 84 7143 16207 9064 82156096 85 11912 28119 16207 2. 63 E+08 86 12685 40804 28119 7. 91 E+08 87 12304 53108 40804 1. 66 E+09 88 10988 64096 53108 2. 82 E+09 89 9843 73, 939 64096 4. 11 E+09
 b names(b)")
Bass Model 준비물: R, Excel, Bass. txt b<-read. table("c: \Users\Hannah\Desktop\Bass. txt", header=T) b names(b) [1] "Year" "ft" "Ftp" "Ftp. 2" plot(b$Year, b$ft, pch=16, col=rainbow(20)) B <- lm(b$ft~b$Ftp+I(b$Ftp^2)) summary(B) bass <- predict(B) lines(b$Year, bass) a <- 652. 9 b <- 0. 677 c <- -0. 00000859 K <- (-b + sqrt(b^2 - 4*a*c))/2*c K K <- (-b+sqrt(b^2 - 4*a*c))/2*c p <- a/K q <- -c*K
")
Parameters of the Bass Model in Several Product Categories Product/ Technology Innovation parameter (p) B&W TV 0. 108 Color TV 0. 059 Room Air conditioner 0. 006 Clothes dryers 0. 009 Ultrasound Imaging 0. 000 CD Player 0. 055 Cellular telephones 0. 008 Steam iron 0. 031 Oxygen Steel Furnace (US)0. 002 Microwave Oven 0. 002 Hybrid corn 0. 000 Home PC 0. 121 Imitation parameter (q) 0. 231 0. 146 0. 185 0. 143 0. 534 0. 378 0. 421 0. 128 0. 435 0. 357 0. 797 0. 281 A study by Sultan, Farley, and Lehmann in 1990 suggests an average value of 0. 03 for p and an average value of 0. 38 for q.
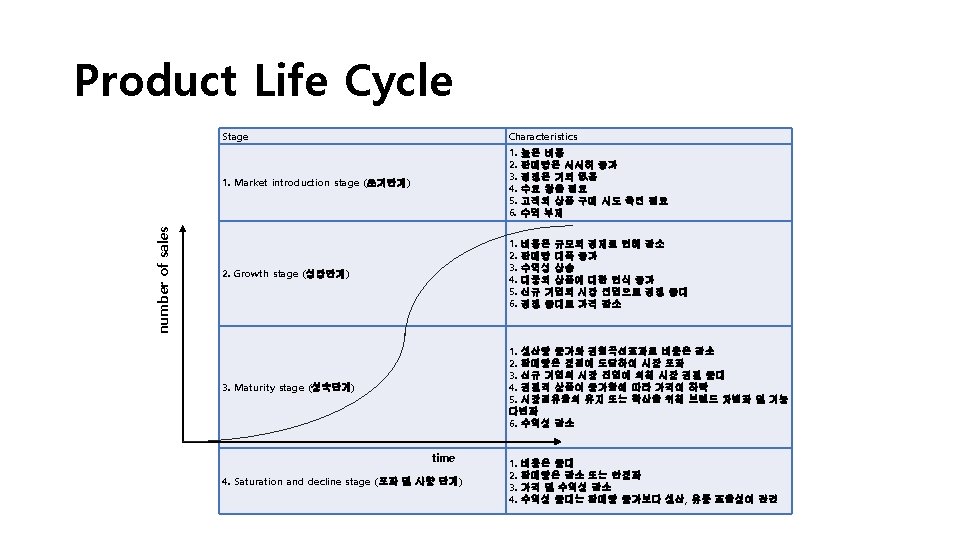

Product Life Cycle: Sales & Profit Maturity Growth Sales Decline Introduction Profit Loss

Technology Adoption Life Cycle • Diffusion of innovations theory was formalized by Everett Rogers in a 1962 book called Diffusion of Innovations. • Rogers stated that adopters of any new innovation or idea could be categorized as innovators (2. 5%), early adopters (13. 5%), early majority (34%), late majority (34%) and laggards (16%), based on a bell curve. 34% 2. 5% Innovators 34% 13. 5% 16% Early Late Early adopters majority Laggards Time of adoption of innovations
- Slides: 22