Exponential and Logarithmic Functions Section 4 2 Exponential


 Compounded quarterly c) Compounded continuously")

. The half-life of")
 b)")


- Slides: 26
Exponential and Logarithmic Functions Section 4. 2 Exponential Functions
Concepts 1. Graph Exponential Functions 2. Evaluate the Exponential Function Base e 3. Use Exponential Functions to Compute Compound Interest 4. Use Exponential Functions in Applications
Graph Exponential Functions Previously: Now:
Graph Exponential Functions Exponential Function: Let b be a constant real number such that b > 0 and b ≠ 1. Then for any real number x, a function of the form is called an exponential function of base b.
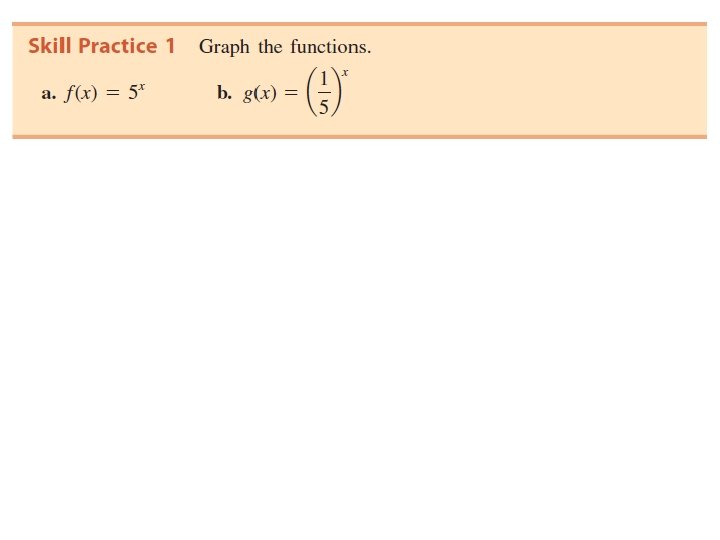
Example 1: Graph the function.
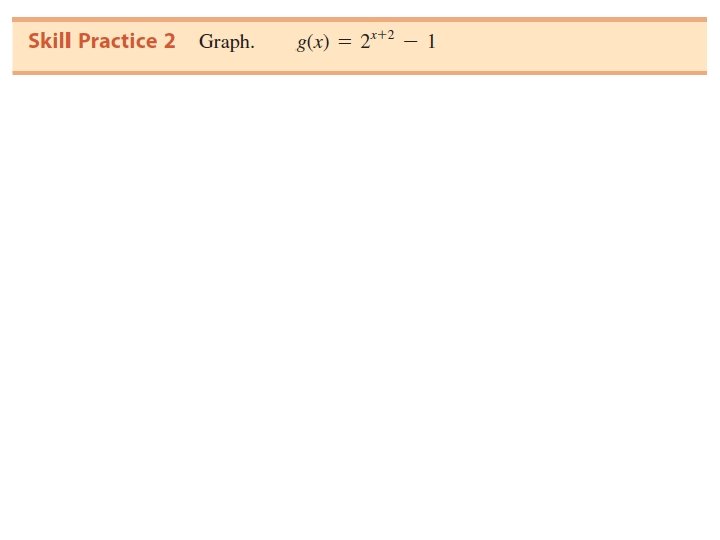
Example 2: Graph the function.
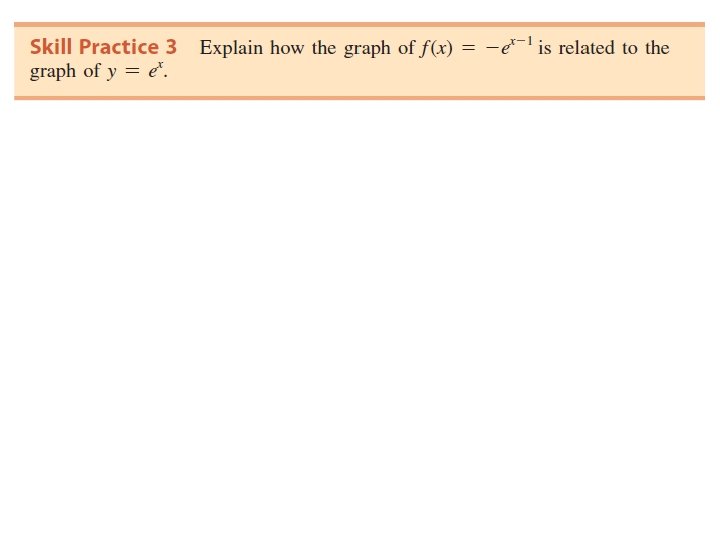
Example 3: Graph the function.
Example 3 continued: If h > 0, shift to the right. If h < 0, shift to the left. Parent function: If a < 0 reflect across the x-axis. Shrink vertically if 0 < |a| < 1. Stretch vertically if |a| > 1. If k > 0, shift upward. If k < 0, shift downward.
Concepts 1. Graph Exponential Functions 2. Evaluate the Exponential Function Base e 3. Use Exponential Functions to Compute Compound Interest 4. Use Exponential Functions in Applications
Evaluate the Exponential Function Base e e is a universal constant (like the number ) and an irrational number. e ≈ 2. 71828
Examples 4 – 7: Evaluate. Round to 4 decimal places. 4. 5. 6. 7.
Example 8: Graph the function.
Concepts 1. Graph Exponential Functions 2. Evaluate the Exponential Function Base e 3. Use Exponential Functions to Compute Compound Interest 4. Use Exponential Functions in Applications
Use Exponential Functions to Compute Compound Interest Suppose that P dollars in principle is invested (or borrowed) at an annual interest rate r for t years. Then: Amount of simple interest I (in $) Amount A (in $) in the account after t years and n compounding periods per year. Amount A (in $) in the account after t years under continuous compounding.
Example 9: Suppose that $15, 000 is invested with 2. 5% interest under the following compounding options. Determine the amount in the account at the end of 7 years for each option. a) Compounded annually
Example 9 continued: b) Compounded quarterly c) Compounded continuously
Concepts 1. Graph Exponential Functions 2. Evaluate the Exponential Function Base e 3. Use Exponential Functions to Compute Compound Interest 4. Use Exponential Functions in Applications
Example 10: Weapon-grade plutonium is composed of approximately 93% plutonium-239 (Pu-239). The half-life of Pu-239 is 24, 000 years. In a sample originally containing 0. 5 kilograms, the amount left after t years is given by Evaluate the function for the given values of t and interpret the meaning in context.
Example 10 continued: a) b)
Example 11: A 2010 estimate of the population of Mexico is 111 million people with a projected growth rate of 0. 994% per year. At this rate, the population P(t) (in millions) can be approximated by where t is the time in years since 2010.
Example 11 continued: