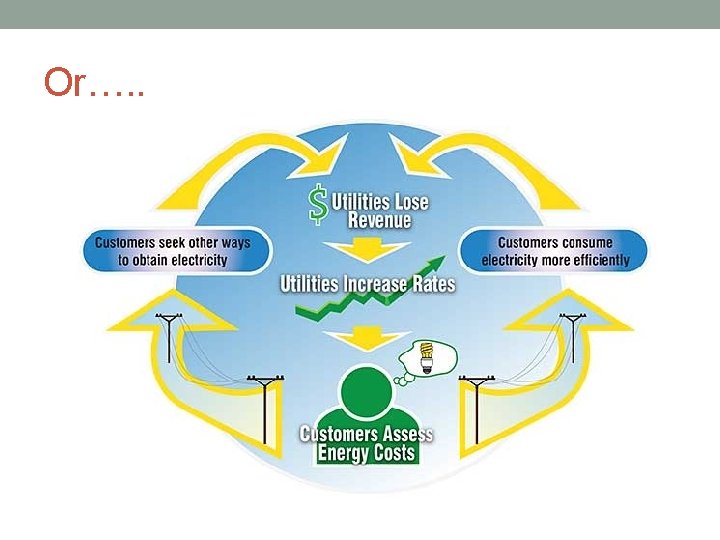
EXPLORING THE DEATH SPIRAL A system dynamics model


 Storage cost curve Take-up")
 costs and other characteristics")


 Maximum hourly network loads")
 Duck curve")


- Slides: 37
EXPLORING THE DEATH SPIRAL A system dynamics model of the SWIS Bill Grace March 2015
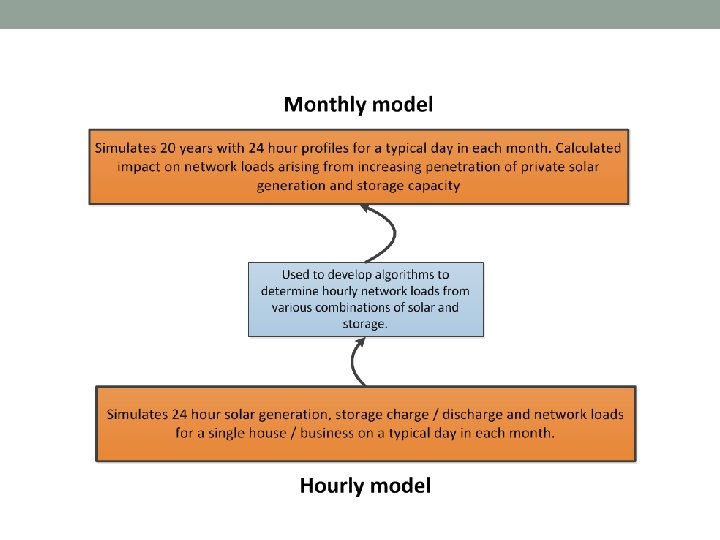
A systems dynamics model of the SWIS
The problem with models! The system dynamics mantra: ‘All models are wrong – some are useful’ The system behaviour (shape of the curves) is important – the magnitude of the numbers and the timing is indicative only
Model assumptions – initial conditions
Existing situation • Both peak demands and average network load have plateaued in recent years • System capacity is around 50% higher than peak demand • Energy prices have been, and will continue to rise • Electricity use per $ of Gross State Product is dropping at around 1% pa • There is now about 340 MW of private solar (18% of houses) [now 430 MW] • The unit cost of installed solar systems continues to drop • Private storage is on the horizon
Recent Energy Demand Gross State Product and Energy Intensity
Initial demand
Initial household solar 2. 4 k. W solar – no storage Model assumes no business solar initially
Uptake of solar and storage Solar cost curve (excl STCs) Storage cost curve Take-up rate
Network capacity Information on the capital and operating (including fuel) costs and other characteristics of each type of generation derived from the Australian Energy Technology Assessment (AETA) by the Australian government’s Bureau of Resources and Energy Economics (BREE 2012).
Base case • Economic growth of 3% pa; • Population growth (represented by housing growth) of 2. 1% pa; • The penetration of private residential solar remains at the present • • • value of 15. 5%; The average size of arrays remain at 2. 4 MW; There is no residential storage; There is no business solar PV or storage. The recent reductions in energy intensity (approximately 1% pa) continue; and The network thermal capacity is reduced by 20 MW pa from 2016.
Limitations The purpose of the model is to explore the underlying dynamics of the SWIS over the medium term. It does not seek to precisely simulate the short term dynamics such as the backlog of works like pole replacements and undergrounding works. It assumes that the essential nature of the existing system (including transmission and distribution costs) is sufficiently representative to explore systemic changes over the 20 year time horizon of the model.
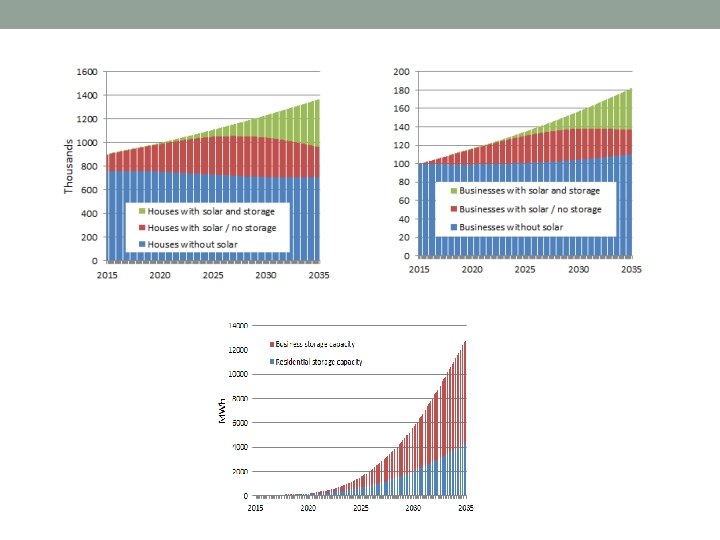
Model results – solar growth without storage
50% 40%
Network impacts – solar only Average hourly network loads (2025) Maximum hourly network loads (2025)
Network impacts – solar only Solar exports (March 2030) Duck curve
Model results – solar growth with storage
Network impacts – solar + storage Maximum hourly network loads January day network loads (2034)
Implications
Solar growth IMO forecast Model result
Network loads Solar only Solar + storage Minimum hourly network loads Percentage of hours in each month that network loads reach over-generation and zero generation points
Limited benefit to network from storage By the end of the simulation period there is only around 1. 5 hours of storage (at nameplate) Typical day over-generation
Network energy & system costs Annual network energy Annual system costs Coal $35. 10 / MWh Gas CC $98. 22 / MWh Gas CT $143. 15 / MWh System unit costs
Economic costs Private investment in solar / storage 20 year public and private expenditures on energy
Greenhouse gas emissions
Policy response
• The current WEM review does not address the dependence of the SWIS on fossil fuel generation • Industry investments are made for decades – action required now • The inevitable increase in the take up of private solar PV will merely hasten a transformation of the electricity network during the coming decade that is needed anyway • The growth solar PV is being driven by global forces Western Australia cannot escape that reality • The electricity industry is now competing with their customers • Policy must drive the most efficient economic outcome, not seek to “protect” the existing industry players • The future energy system must effectively and efficiently integrate private and network generation
• Excess solar generation in daytime hours will create an over • • • generation problem This will require either network baseload generation to be intermittently reduced and / or private solar generation to be “floated” Although private storage will ameliorate this situation somewhat, the capacity of private storage will not be sufficient to eliminate it The only way to avoid the steep ramping evident in the “duck curve” is to introduce network storage into the SWIS. This could potentially occur at existing substation sites which dispatch and receive electricity from the private systems in homes and businesses , and “head off” the growth in private storage Storage at this “downstream” scale would logically be complemented by larger scale storage “upstream” aimed at smoothing supply and demand from network-scale renewables generation, e. g. wind.
Electric vehicles • Not modelled but easily added • Growing load on the network – when will they be charged? • Daytime charging will reduce over-generation problem – where are the cars during the day?
www. audrc. org