
Exploring 3 D Power Distribution Network Physics Xiang
Exploring 3 D Power Distribution Network Physics Xiang Hu 1, Peng Du 2, and Chung-Kuan Cheng 2 1 ECE Dept. , 2 CSE Dept. , University of California, San Diego 10/25/2011
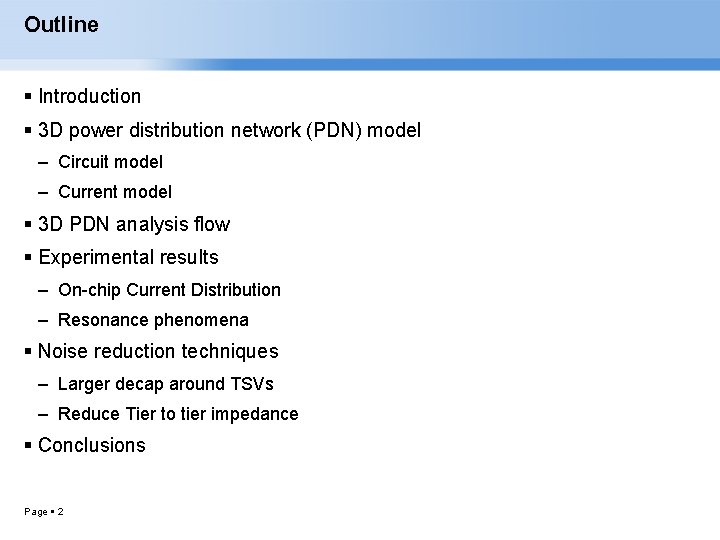
Outline Introduction 3 D power distribution network (PDN) model – Circuit model – Current model 3 D PDN analysis flow Experimental results – On-chip Current Distribution – Resonance phenomena Noise reduction techniques – Larger decap around TSVs – Reduce Tier to tier impedance Conclusions Page 2
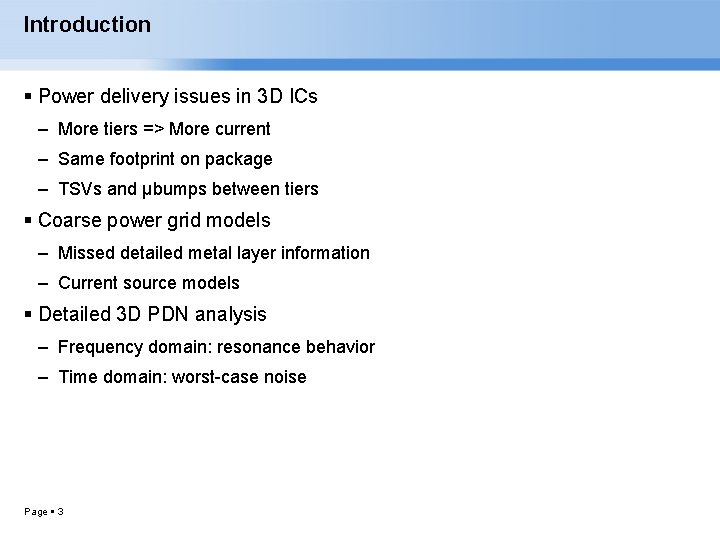
Introduction Power delivery issues in 3 D ICs – More tiers => More current – Same footprint on package – TSVs and µbumps between tiers Coarse power grid models – Missed detailed metal layer information – Current source models Detailed 3 D PDN analysis – Frequency domain: resonance behavior – Time domain: worst-case noise Page 3
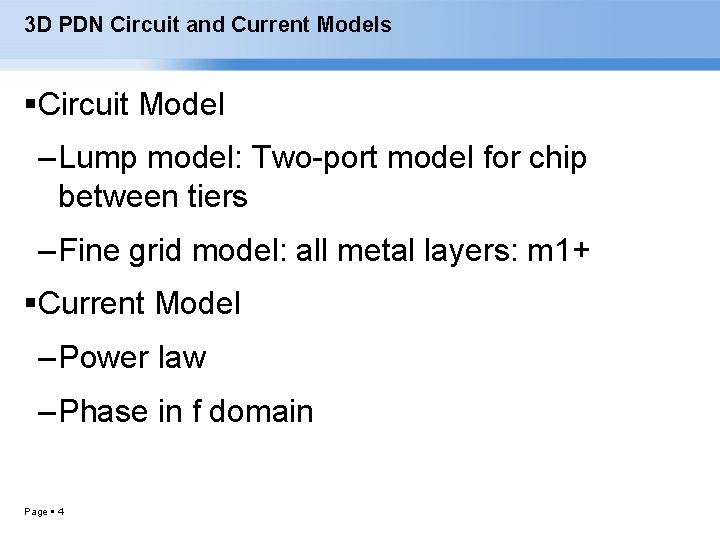
3 D PDN Circuit and Current Models Circuit Model – Lump model: Two-port model for chip between tiers – Fine grid model: all metal layers: m 1+ Current Model – Power law – Phase in f domain Page 4
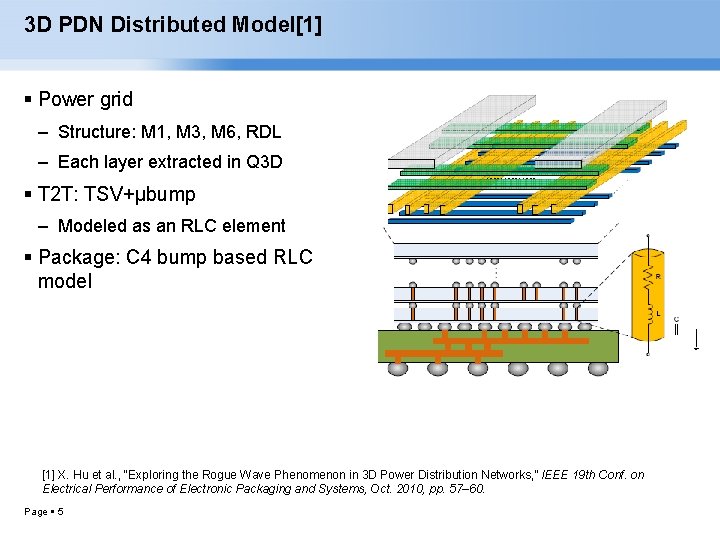
3 D PDN Distributed Model[1] Power grid – Structure: M 1, M 3, M 6, RDL – Each layer extracted in Q 3 D T 2 T: TSV+μbump – Modeled as an RLC element Package: C 4 bump based RLC model [1] X. Hu et al. , “Exploring the Rogue Wave Phenomenon in 3 D Power Distribution Networks, ” IEEE 19 th Conf. on Electrical Performance of Electronic Packaging and Systems, Oct. 2010, pp. 57– 60. Page 5
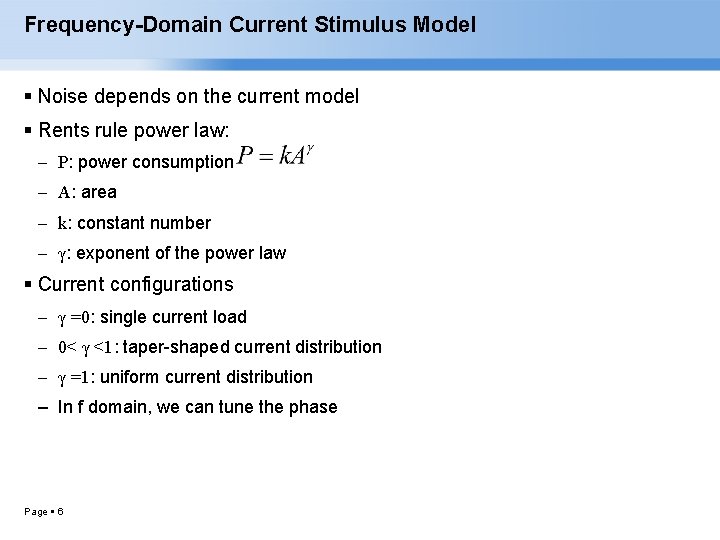
Frequency-Domain Current Stimulus Model Noise depends on the current model Rents rule power law: – P: power consumption – A: area – k: constant number – γ: exponent of the power law Current configurations – γ =0: single current load – 0< γ <1: taper-shaped current distribution – γ =1: uniform current distribution – In f domain, we can tune the phase Page 6
3 D PDN Analysis Flow Page 7
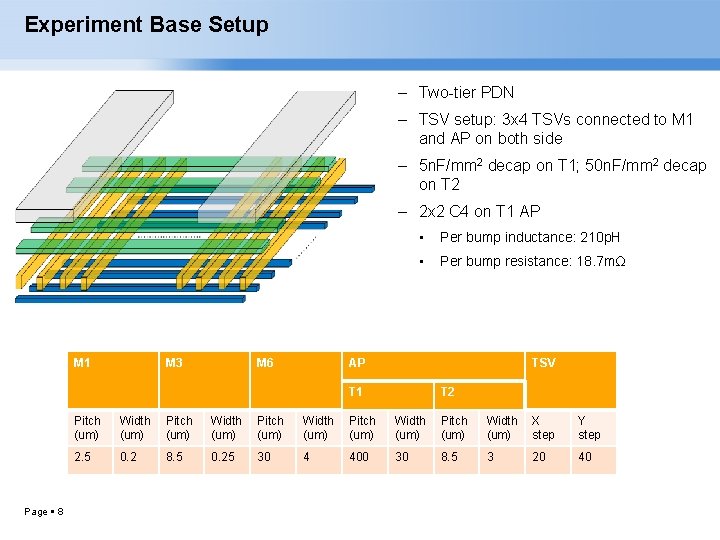
Experiment Base Setup – Two-tier PDN – TSV setup: 3 x 4 TSVs connected to M 1 and AP on both side – 5 n. F/mm 2 decap on T 1; 50 n. F/mm 2 decap on T 2 – 2 x 2 C 4 on T 1 AP M 1 M 3 M 6 • Per bump inductance: 210 p. H • Per bump resistance: 18. 7 mΩ AP TSV T 1 Page 8 T 2 Pitch (um) Width (um) Pitch (um) Width (um) X step Y step 2. 5 0. 2 8. 5 0. 25 30 4 400 30 8. 5 3 20 40
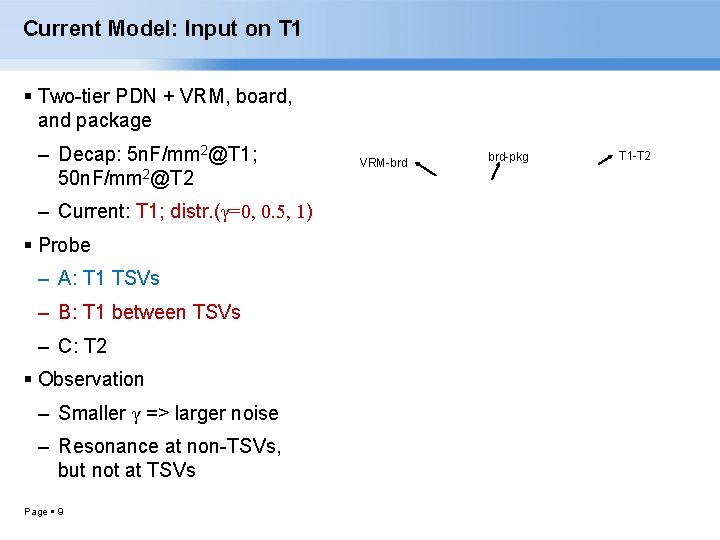
Current Model: Input on T 1 Two-tier PDN + VRM, board, and package – Decap: 5 n. F/mm 2@T 1; 50 n. F/mm 2@T 2 – Current: T 1; distr. (γ=0, 0. 5, 1) Probe – A: T 1 TSVs – B: T 1 between TSVs – C: T 2 Observation – Smaller γ => larger noise – Resonance at non-TSVs, but not at TSVs Page 9 VRM-brd brd-pkg T 1 -T 2
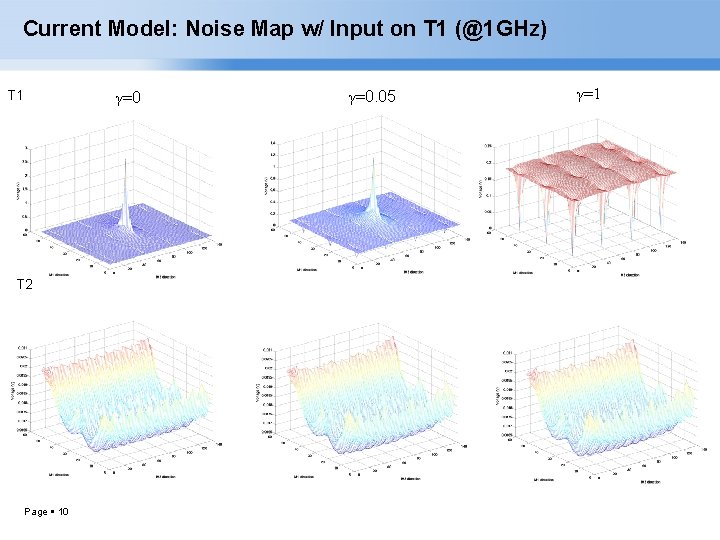
Current Model: Noise Map w/ Input on T 1 (@1 GHz) T 1 γ=0 T 2 Page 10 γ=0. 05 γ=1
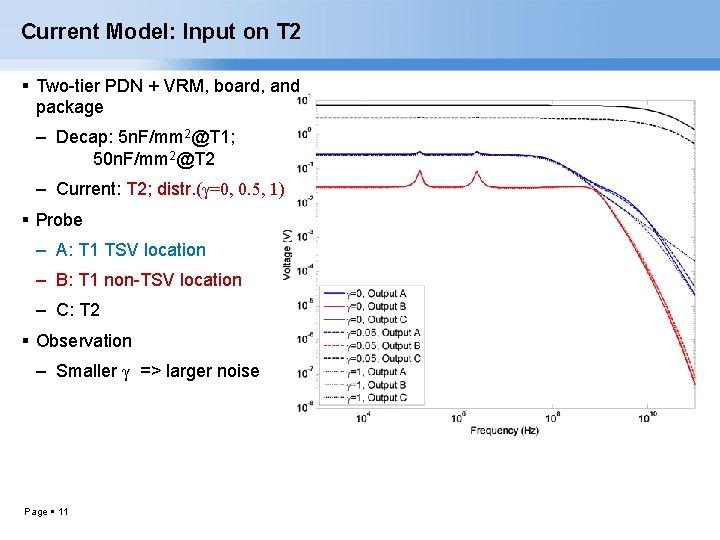
Current Model: Input on T 2 Two-tier PDN + VRM, board, and package – Decap: 5 n. F/mm 2@T 1; 50 n. F/mm 2@T 2 – Current: T 2; distr. (γ=0, 0. 5, 1) Probe – A: T 1 TSV location – B: T 1 non-TSV location – C: T 2 Observation – Smaller γ => larger noise Page 11
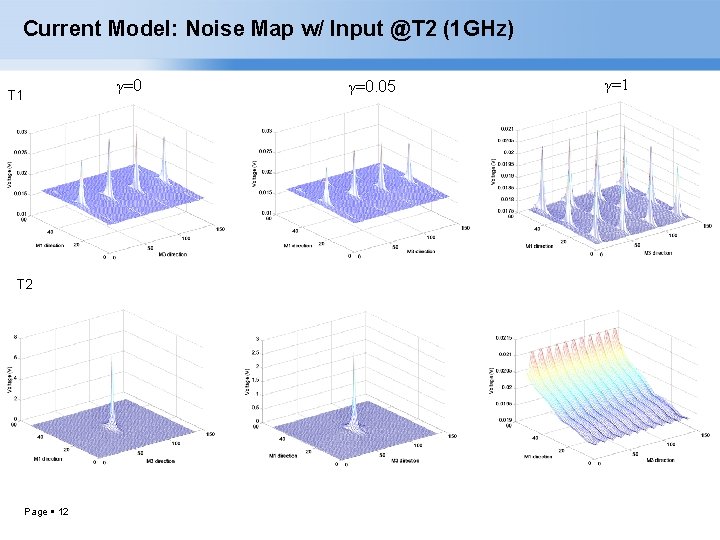
Current Model: Noise Map w/ Input @T 2 (1 GHz) γ=0 T 1 T 2 Page 12 γ=0. 05 γ=1
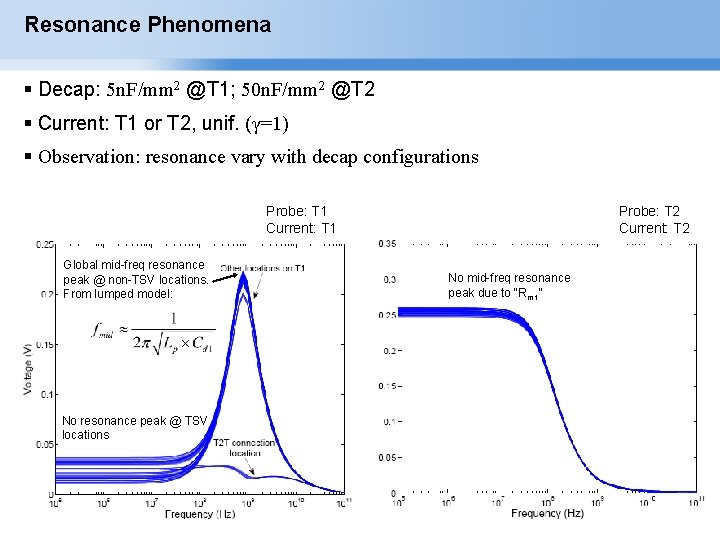
Resonance Phenomena Decap: 5 n. F/mm 2 @T 1; 50 n. F/mm 2 @T 2 Current: T 1 or T 2, unif. (γ=1) Observation: resonance vary with decap configurations Probe: T 1 Current: T 1 Global mid-freq resonance peak @ non-TSV locations. From lumped model: No resonance peak @ TSV locations Page 13 Probe: T 2 Current: T 2 No mid-freq resonance peak due to “Rm 1”
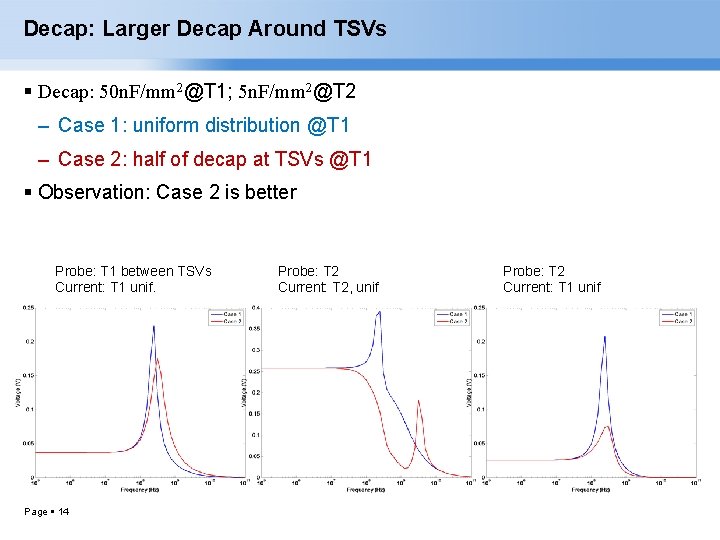
Decap: Larger Decap Around TSVs Decap: 50 n. F/mm 2@T 1; 5 n. F/mm 2@T 2 – Case 1: uniform distribution @T 1 – Case 2: half of decap at TSVs @T 1 Observation: Case 2 is better Probe: T 1 between TSVs Current: T 1 unif. Page 14 Probe: T 2 Current: T 2, unif Probe: T 2 Current: T 1 unif
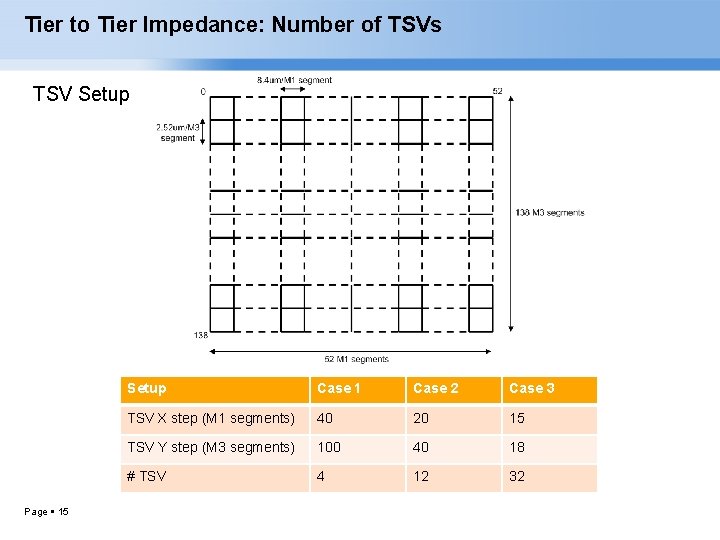
Tier to Tier Impedance: Number of TSVs TSV Setup Page 15 Setup Case 1 Case 2 Case 3 TSV X step (M 1 segments) 40 20 15 TSV Y step (M 3 segments) 100 40 18 # TSV 4 12 32
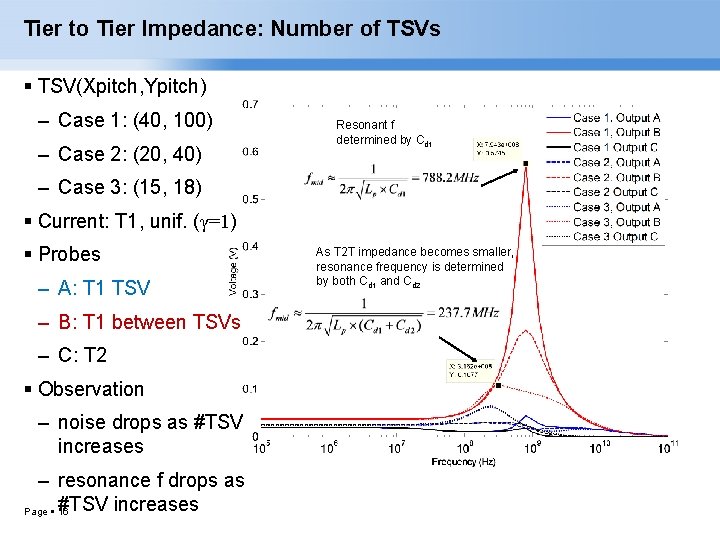
Tier to Tier Impedance: Number of TSVs TSV(Xpitch, Ypitch) – Case 1: (40, 100) – Case 2: (20, 40) Resonant f determined by Cd 1 – Case 3: (15, 18) Current: T 1, unif. (γ=1) Probes – A: T 1 TSV – B: T 1 between TSVs – C: T 2 Observation – noise drops as #TSV increases – resonance f drops as #TSV increases Page 16 As T 2 T impedance becomes smaller, resonance frequency is determined by both Cd 1 and Cd 2
Conclusion On-chip power network model Current distribution model – Power law current distribution model reflects the current-area relation Decap: Various on-chip resonances Techniques of reducing 3 D PDN noise – Larger decap around TSV area – Small tier to tier impedance Page 17

Thank You! Q&A Page 18
- Slides: 18