Exploratory Factor Analysis By Ahlam Lee Contents Concepts

Exploratory Factor Analysis By Ahlam Lee
")
Contents • • • Concepts of Exploratory Factor Analysis Assumptions SPSS demonstration (Factor Analysis) Reliability Test (Get Cronbach Alpha) SPSS demonstration (Reliability Test)

Concepts of Exploratory Factor Analysis <When to Use> • It is used to explore the underlying (theoretical) structure of a relatively large set of variables. • Technically speaking, it is a method of data reduction.

Hypothetical Example Work Satisfaction If you just asked a single question like “How happy are you with your work? ” it would be difficult for you to know what your participants mean with their response. Namely, participant responses from the single question could not represent multifaceted dimensions of “Work Satisfaction”.

Hypothetical Example – Cont. Work Satisfaction Quest ion 1 Question 2 Question 3 on i t s Question 1: How happy are you with your SALARY? Question 2: How happy are you with your CO-WOKERS? Question 3: How happy are you with your WORKPLACE CLIMATE? Question 4: How happy are you with your WORKLOAD? 4

Q 2: How happy are you with your co-workers? Q 3: How happy are you with your workplace climate? Q 4: How happy are you with your workload? Q 5: …. . Q 6: …. Q 7: How happy are you with your neighborhood? Q 8: How happy are you with your family? Q 9: How happy are you with your friends? Q 10: … Q 28: To what extent does your mentor support your career growth? Q 29: To what extent do your colleagues in your field appreciate your work? Q 30: How satisfied are you with your current status in your field? Extract factor(s) that exist in the survey instrument based on exploratory factor analysis (EFA) : How many factors are extracted from the survey instrument? Q 1: How happy are you with your salary?

Question 1 Question 2 Work Satisfaction Question 3 Question 4 Question 7 Personal Satisfaction Question 8 Question 9 Question 28 Career Goal Achievement Question 29 Question 30
 (cited as Tabachnick")
Assumptions • Enough sample size: Criteria by Comrey & Lee (1992) (cited as Tabachnick & Fidell, 2001, page 588) 50 cases very poor; 100 cases poor; 200 cases fair 300 cases good; 500 cases very good; 1000 or more excellent Note: As a rule of thumb, a bare minimum of 10 observations per variable is necessary to avoid computational difficulties. <SPSS> Kaiser-Meyer-Olkin (KMO-test) measure sampling adequacy. The sample is adequate if the value of KMO is greater than 0. 5. • All of the variables in the analysis are assumed to be normally distributed and treated as continuous variables.

Steps in a Factor Analysis? Yes Principal Factor Axis No Principal Component Analysis Factor Rotation* 1) Orthogonal rotation (varimax, quartimax, equamax) 2) Oblique rotaion (direct oblimin and promax) Note. *The goal of rotation is to simplify and clarify the data structure.

Principal Component Analysis vs. Principal Factor Axis Principal Component Analysis Principal Factor Axis It is assumed that the communalities are It is assumed that there is error variance. initially 1, suggesting that there is no error As such, initial communalities are variance. estimated in principal factor axis. The initial communalities represent the relation between the variable and all other variables before rotation.

Orthogonal Rotation vs. Oblique Rotation Orthogonal Rotation Goal Oblique Rotation To simplify and clarify the data structure Assumption If you assume the (underlying) factors to be independent (unrelated), you would choose one of the orthogonal rotations. If there are theoretical grounds for supposing that underlying factors might correlated then, you would choose an oblique rotation. Type of rotation Varimax*, quartimax, equamax Direct oblimin, promax Note* Varimax rotation is by far the most common choice.

Factor Analysis
 should be moved into “Variables”")
Factor Analysis All of the items (Q 1~Q 12) should be moved into “Variables” section.

Factor Analysis 1. Click on “Descriptive”.

Factor Analysis 2. Check off “KMO and Bartlett’s test of sphericity. 3. Click on “Continue”.

Factor Analysis 1. Click on “Extraction”.

Factor Analysis Choose “Principal axis factoring”.

Factor Analysis 1. Check off “Scree plot”. 2. Click on “Continue”.

Factor Analysis 1. Click on “Rotation”.

Factor Analysis 1. Check off “Varimax”. 2. Click on “Continue”.

Factor Analysis Click on “OK”.
 measures whether the sample is big enough. The sample is adequate if")
Kaiser-Meyer-Olkin (KMO-test) measures whether the sample is big enough. The sample is adequate if the value of KMO is greater than 0. 5. For the data, the value is 0. 934, so we are confident that factor analysis is appropriate for the data. Note: Kaiser (1974) recommends a bare minimum of 0. 5. The values in KMO-test between 0. 5 and 0. 7 are mediocre; values between 0. 7 and 0. 8 are good, values between 0. 8 and 0. 9 are great, and values above 0. 9 are superb (see Hutcheson & Sofroniou, 1999, pp. 224 -225 for more detail). Bartlett’s Test of Sphericity: The result of this test should be significant, because the null hypothesis of this test is that the original correlation matrix is an identity matrix (which means there would be no correlations between the variables). As such, rejecting the null hypothesis suggests that there are significant correlations between the variables. In the data, the significant result (p <. 001) of Bartlett’s Test of Sphericity tells us that there are some relationships between the variables, and thus factor analysis is appropriate.

Communalities refer to the proportion of each variable’s variance that can be explained by the factors. Initial: With principal factor axis factoring, the initial values are determined by the squared multiple correlation of the variable with the other variables. Note: if you choose principal components analysis, you will find the initial values of all of the variables indicate “ 1” because principal component analysis assumes that there is no error variance. Extraction: The values in this column indicates the proportion of each variable’s variance that can be explained by the retained factors. High values are well represented in the common factor, while low values are not well represented.

“The number of positive eigenvalues determines the number of dimensions needed to represent a set of scores without any loss of information”. (Rietveld & Van Hout, 1993, p. 259). <Number of Factors to be Retained> • Retain only factors with an eigenvalue larger than 1 (Guttman-Kaiser rule) In the data set, two factors should be retained because as the above table suggests, Factor 1 and 2’s eigenvalues are greater than 1.

6. 429 1. 229 The scree plot graphs the eigenvalue against the factor number. You can see these values in the first two columns of the table immediately above. From the third factor on, you can see that the line is almost flat, meaning the each successive factor is accounting for smaller and smaller amounts of the total variance.

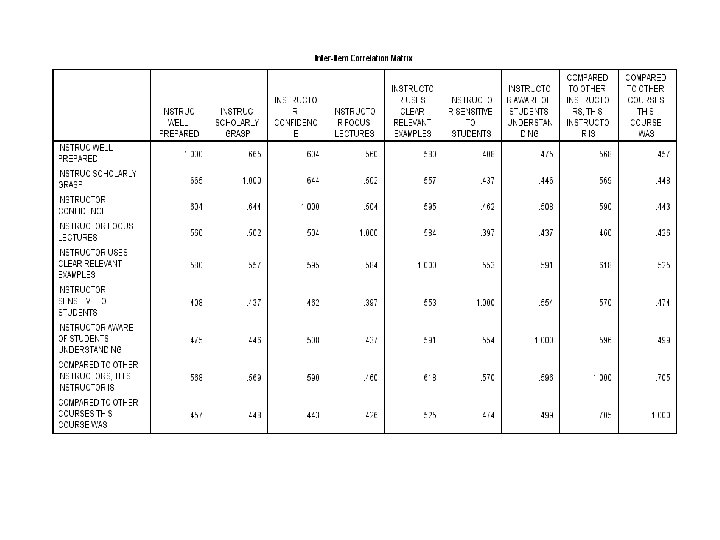
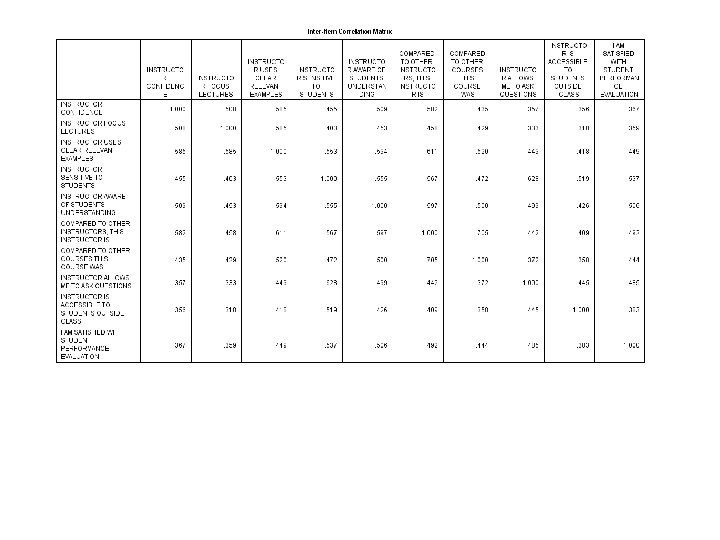
This table shows the unrotated factor loadings, which are the correlations between the variable and the factor. Since these are correlations, possible values range from -1 to +1.

Q 1 Q 2 Q 3 Q 4 Q 5 Q 6 Q 7 Q 8 Q 9 Q 10 Q 11 Q 12 Factor loadings above 0. 3 were typically reported; this cutoff is conventionally considered a “meaningful loading” (Butts & Shenoi, 2013) Based on the items that represent Factor 1 and 2, I would name Factor 1 and 2 as follows: Factor 1: Instructor Pedagogical Skills and Knowledge Factor 2: Instructor-Teacher Relationship

0. 48 7 cto tru Ins tive nsi 0. 615 0. 552 0. 712 Instructor-Teacher Relationship I am s a ti s fi e d w ith student pe r fo r m a n c e evaluation Instructor is acce ssible to students outside class Instructor allows me to ask questions res levant s Lectu u tor Foc re s clear tor use les examp r se Instruc nfidence Instructor Co rly Grasp Instructor Schola Instructor well prepared 0. 4 85 07 0. 3 17 tru Ins 23 2 0. 794 0. 746 0. 693 0. 60 0. 6 0. 30 0. 4 0. 3 is 0. 476 , th se ur 3 0. 53 co er , th s. . tor oo ei uc s 90 r str dt u 0. 5 r in …. are co the r is mp o o cto Co 56 nts d t tru 0. 7 de are ins stu of mp this re ng Co i d wa ts r a tan den cto ers d stu un to 0. 59 54 6 1 Instructor Pedagogical Skills and Knowledge

<SPSS> Reliability Test for Factor 1

<SPSS> Reliability Test for Factor 1 Q 1, Q 2, Q 3, Q 4, Q 5, Q 6, Q 9, Q 11, and Q 12 represent Factor 1 and they should be moved into “Items” section.

Reliability Test for Factor 1 Q 1, Q 2, Q 3, Q 4, Q 5, Q 6, Q 9, Q 11, and Q 12 representing Factor 1 are moved into “Items” section.

Reliability Test for Factor 1 Click on “Continue”.

Reliability Test for Factor 1 Click on “OK”.

Reliability Test Cronbach’s Alpha Internal consistency α >= 0. 9 Excellent 0. 9 > α >= 0. 8 Good 0. 8 > α >= 0. 7 Acceptable 0. 7 > α >= 0. 6 Questionable 0. 6 > α >= 0. 5 Poor 0. 5 > α Unacceptable Reference: George & Mallery (2003). Cronbach’s Alpha, 0. 906 suggests excellent internal consistency on the items that represent “Instructor Pedagogical Knowledge and Skills ”.

Reliability Test for Factor 2

Reliability Test for Factor 2 You find that the items for Factor 1 are remained here. Thus, those items should be moved into the original place. Then, items representing Factor 2 should be moved into “Items” section.

Reliability Test for Factor 2 Q 3~Q 12 representing Factor 2 should be moved into “Items” section.

Reliability Test for Factor 2 Q 3~Q 12 representing Factor 2 are moved into “Items” section.

Reliability Test for Factor 2 1. Click on “Statistics”. 2. Click on “Continue”.

Reliability Test for Factor 2 Click on “OK”.

Reliability Test Cronbach’s Alpha Internal consistency α >= 0. 9 Excellent 0. 9 > α >= 0. 8 Good 0. 8 > α >= 0. 7 Acceptable 0. 7 > α >= 0. 6 Questionable 0. 6 > α >= 0. 5 Poor 0. 5 > α Unacceptable Cronbach’s Alpha, 0. 900 suggests excellent internal consistency on the items that represent “Instructor-Teacher Relationship”. Reference: George & Mallery (2003).

Cronbach’s α = 0. 906 0. 48 7 cto tru Ins tive nsi 0. 615 0. 552 0. 712 Cronbach’s α = 0. 900 Instructor-Teacher Relationship I am s a ti s fi e d w ith student pe r fo r m a n c e evaluation Instructor is acce ssible to students outside class Instructor allows me to ask questions res levant s Lectu u tor Foc re s clear tor use les examp r se Instruc nfidence Instructor Co rly Grasp Instructor Schola Instructor well prepared 0. 4 85 07 0. 3 17 tru Ins 23 2 0. 794 0. 746 0. 693 0. 60 0. 6 0. 30 0. 4 0. 3 is 0. 476 , th se ur 3 0. 53 co er , th s. . tor oo ei uc s 90 r str dt u 0. 5 r in …. are co the r is mp o o cto Co 56 nts d t tru 0. 7 de are ins stu of mp this re ng Co i d wa ts r a tan den cto ers d stu un to 0. 59 54 6 1 Instructor Pedagogical Skills and Knowledge
. Critical infrastructure protection VII (Eds.")
References • Butts, J. , & Shenoi, S. (2013). Critical infrastructure protection VII (Eds. ). Springer. • George, D. , & Mallery, P. (2003). SPSS for Windows step by step: A simple guide and reference. 11. 0 update (4 th ed. ). Boston: Allyn & Bacon. • Hutcheson, G. & Sofroniou, N. (1999). The multivariate social scientist. London: Sage.
- Slides: 45