Explaining Terciles a brief illustration Imagine two places

Explaining Terciles a brief illustration

Imagine two places that are near each other and receive amounts of rainfall that are roughly correlated, even though in any given year Place 2 is usually wetter than Place 1.

Below Normal Near Normal Above Normal

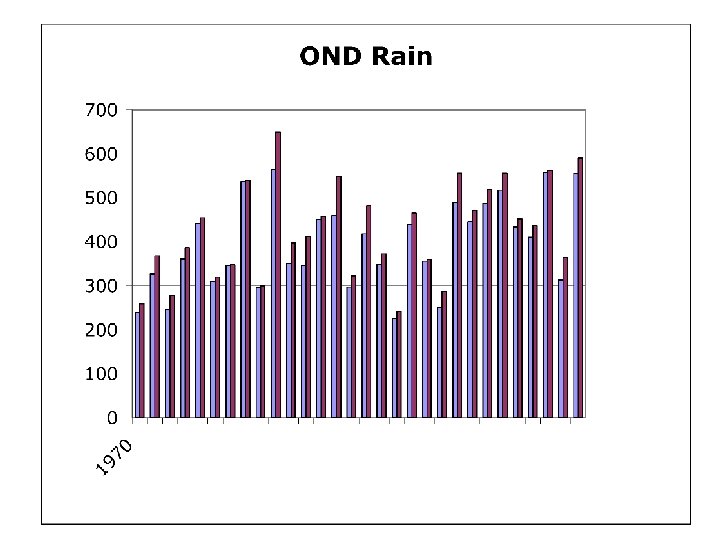
mm of Rain

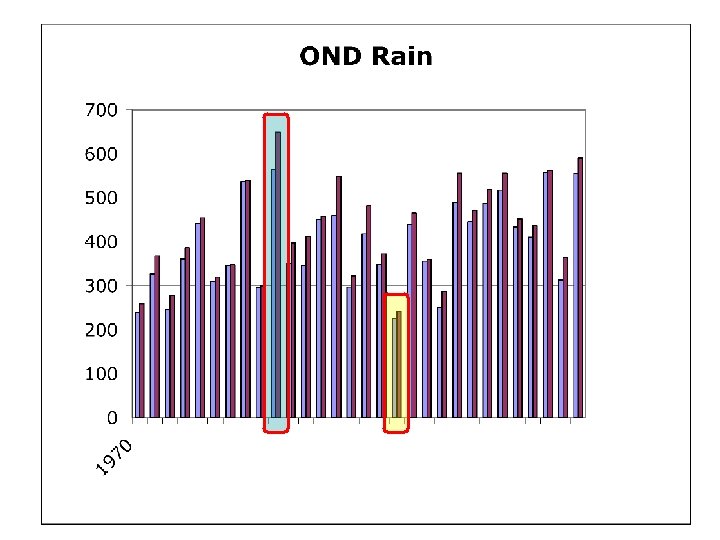
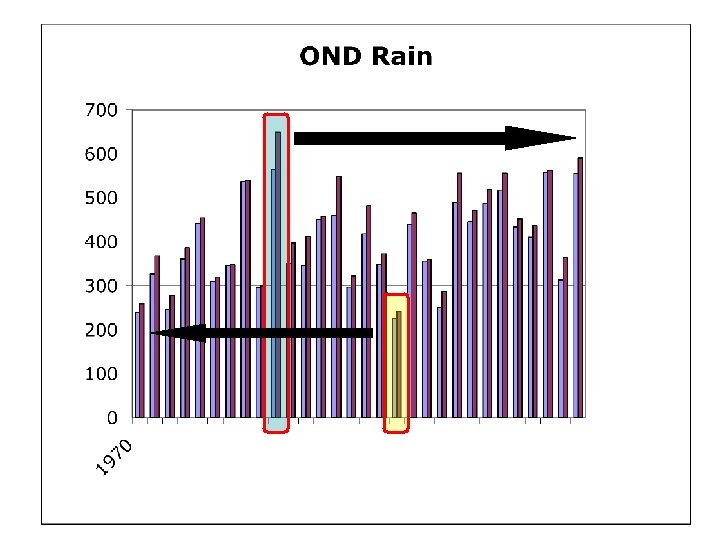
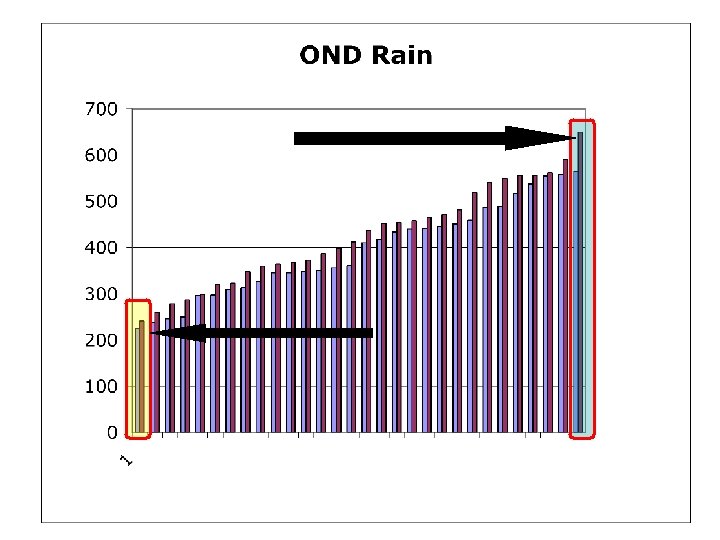
mm of Rain The wettest ten years from the data fall in the above normal tercile.

mm of Rain The wettest ten years from the data fall in the above normal tercile. The driest ten years from the data fall in the below normal tercile.

mm of Rain The wettest ten years from the data fall in the above normal tercile. The middle ten years from the data fall in the near normal tercile. The driest ten years from the data fall in the below normal tercile.

mm of Rain For each place we can see a range of rainfall amounts corresponding to each tercile.

mm of Rain For each place we can see a range of rainfall amounts corresponding to each tercile.

mm of Rain For each place we can see a range of rainfall amounts corresponding to each tercile.

mm of Rain For each place we can see a range of rainfall amounts corresponding to each tercile. 35 percent chance of receiving >445 mm in place 1, and >470 mm in place 2. 40 percent chance of receiving 346 -445 mm in place 1, and 368 -469 mm in place 2. 25 percent chance of receiving <346 mm in place 1, and <368 in place 2.
- Slides: 15