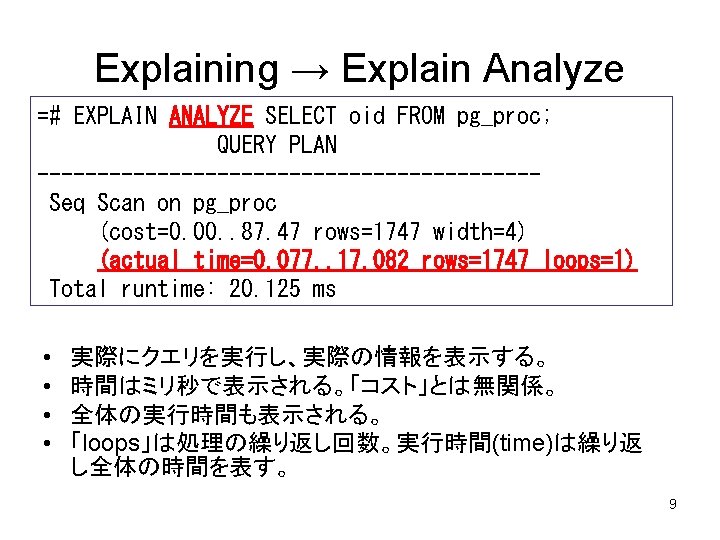
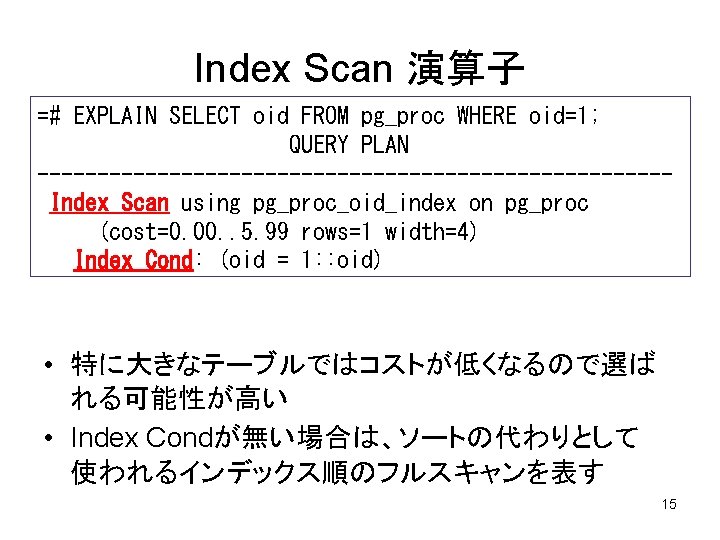
Explaining Explain Postgre SQL 2009 03 17 8
")


 random_page_cost")


 FROM pg_proc; QUERY PLAN -------------------------------Aggregate (cost=91. 84. .")
 FROM pg_foo GROUP BY oid; QUERY PLAN")

;")


';")
 RETURNS SETOF integer AS $$ select $1;")


 : ANALYZE前 =# EXPLAIN ANALYZE SELECT exception_id FROM exception JOIN exception_notice_map USING (exception_id)")
 : ANALYZE後 =# ANALYZE exception; =# EXPLAIN ANALYZE SELECT exception_id FROM exception JOIN")
 : ANALYZE前 =# EXPLAIN ANALYZE SELECT exception_id FROM exception JOIN exception_notice_map USING (exception_id)")
 : ANALYZE 1回目 =# ANALYZE exception_notice_map; =# EXPLAIN ANALYZE SELECT exception_id FROM exception")
 : ANALYZE 2回目 =# ANALYZE exception; =# EXPLAIN ANALYZE SELECT exception_id FROM exception")
 : Seq Scanが遅い =# EXPLAIN ANALYZE SELECT s. site_id, s. name, i. image_name")
 : 肥大化の回復 =# VACUUM FULL VERBOSE host; INFO: --Relation public. host-INFO: Pages 4785:")
 : 結合 =# EXPLAIN ANALYZE SELECT count(*) FROM advertiser_contact JOIN advertiser USING (advertiser_id)")
 : IN =# EXPLAIN ANALYZE SELECT count(*) FROM advertiser_contact WHERE advertiser_id IN (SELECT")
 : EXISTS =# EXPLAIN ANALYZE SELECT count(*) FROM advertiser_contact WHERE EXISTS (SELECT 1")


- Slides: 47
Explaining Explain ~ Postgre. SQLの実行計画を読む ~ (2009 -03 -17 更新 / バージョン 8. 3対応) by Robert Treat (Inspired by Greg Sabino Mullane) 翻訳:日本Postgre. SQLユーザ会 1
Explain Planの例 =# EXPLAIN SELECT * FROM pg_proc ORDER BY proname; QUERY PLAN --------------------------Sort (cost=181. 55. . 185. 92 rows=1747 width=322) Sort Key: proname -> Seq Scan on pg_proc (cost=0. 00. . 87. 47 rows=1747 width=322) 3
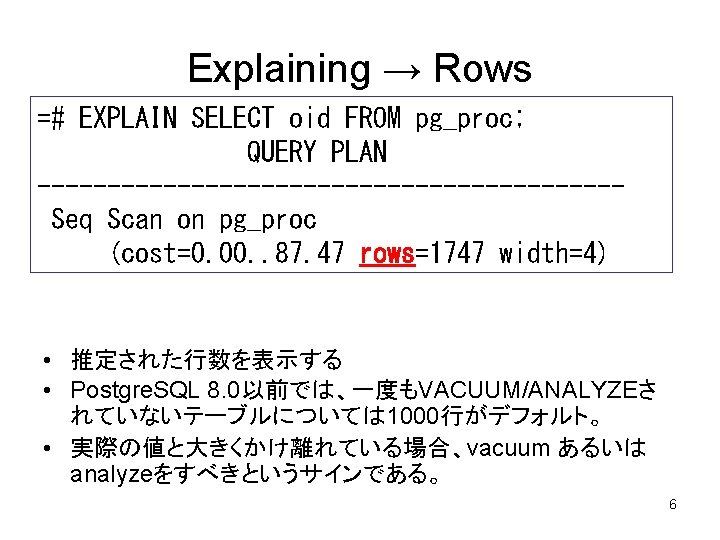
Explaining → Widths =# EXPLAIN SELECT oid FROM pg_proc; QUERY PLAN ---------------------Seq Scan on pg_proc (cost=0. 00. . 87. 47 rows=1747 width=4) 一般的なデータ型のサイズについて • このレベルにおける推定さ れた入力サイズを表示する。 • それほど重要ではない smallint integer bigint boolean char(n) varchar(n) text [ n文字 ] 2 4 8 1 n+1 ~ n+4 5
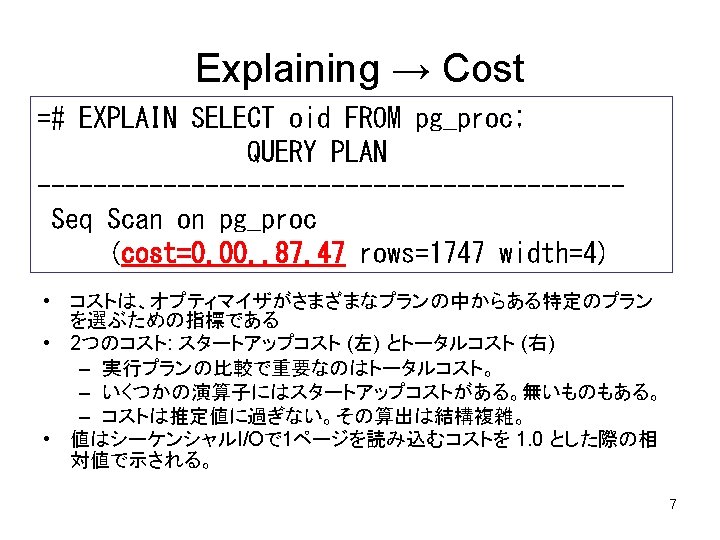
Explaining → Cost パラメータ 説明 規定値 相対速度 seq_page_cost シーケンシャル読み込み 1回 1. 00 (基準) random_page_cost ランダム読み込み 1回 4. 00 4倍遅い cpu_tuple_cost 行の処理1回 0. 01 100倍速い cpu_index_tuple_cost 索引の処理1回 0. 005 200倍速い cpu_operator_cost 計算 1回 0. 0025 400倍速い effective_cache_size ページキャッシュサイズ 128 MB N/A 8
Explaining → プラン演算子 Seq Scan Index Scan Bitmap Heap Scan Subquery Scan Tid Scan 関連処理 表スキャン 索引スキャ ン 副問合せ ctid =. . . 始動 コス ト 無 無 有 有 無 無 演算子 Result Unique 関連処理 関数スキャン DISTINCT UNION 有 Aggregate count, sum, avg, stddev 有 Group GROUP BY 有 UNION 無 無 Append Nested Loop 結合 無 Merge Join 結合 有 Hash Join 結合 ORDER BY 有 Materialize 副問合せ INTERCECT Set. Op EXCEPT Hash 有 有 LIMIT OFFSET Function Scan 有 無 Limit 関数スキャ ン Sort 始動 コスト 有 有 10
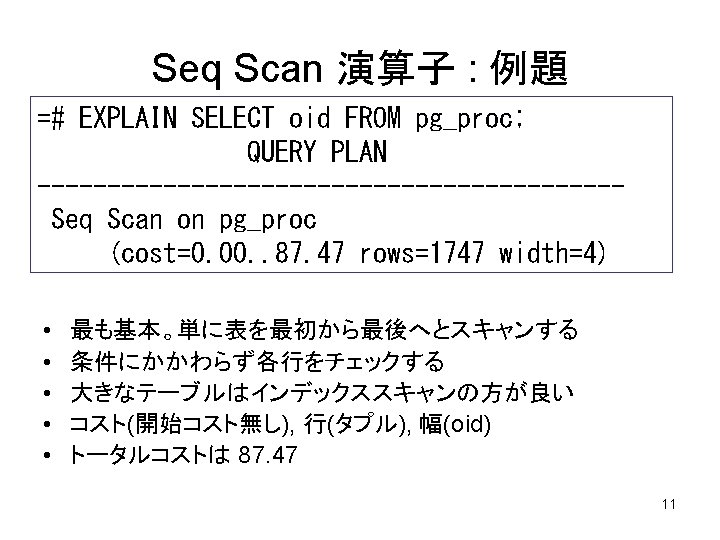
Seq Scan 演算子 : 説明 =# SELECT relpages, reltuples FROM pg_class WHERE relname = 'pg_proc'; relpages | reltuples -----+-----70 | 1747 ページの読み取り 行ごとの計算 (70 × 1. 0) + (1747 * 0. 01) = 87. 47 12
WHERE句のコスト =# EXPLAIN SELECT oid FROM pg_proc WHERE oid > 0; QUERY PLAN -------------------Seq Scan on pg_proc (cost=0. 00. . 91. 84 rows=583 width=4) Filter: (oid > 0: : oid) 行ごとの演算子のコスト (cpu_operator_cost) 87. 47 + (1747 * 0. 0025) 絞り込み前の = 91. 84 行数で計算する 13
Sort 演算子 =# EXPLAIN SELECT oid FROM pg_proc ORDER BY oid; QUERY PLAN ----------------------Sort (cost=181. 55. . 185. 92 rows=1747 width=4) Sort Key: oid -> Seq Scan on pg_proc (cost=0. 00. . 87. 47 rows=1747 width=4) • 明示的なソート : ORDER BY句 • 暗黙的なソート : Unique, Sort-Merge Join など • 開始コストを持っている: 最初の値はすぐには返却 されない 14
Bitmap Scan 演算子 test=# EXPLAIN SELECT * FROM q 3 c, q 3 c as q 3 cs WHERE (q 3 c. ipix>=q 3 cs. ipix-3 AND q 3 c. ipix<=q 3 cs. ipix+3) OR (q 3 c. ipix>=q 3 cs. ipix-1000 AND q 3 c. ipix<=q 3 cs. ipix-993); QUERY PLAN ------------------------Nested Loop -> Seq Scan on q 3 cs -> Bitmap Heap Scan on q 3 c -> Bitmap. Or -> Bitmap Index Scan on ipix_idx • 8. 1で追加された • Bitmap. Or, Bitmap. And で複数のビットマップを合体 • リレーションの”ビットマップ“をメモリ内で作成する 16
Result 演算子 =# EXPLAIN SELECT oid FROM pg_proc WHERE 1+1=3; QUERY PLAN ----------------------Result (cost=0. 00. . 87. 47 rows=1747 width=4) One-Time Filter: false -> Seq Scan on pg_proc (cost=0. 00. . 87. 47 rows=1747 width=4) • 非テーブル問い合わせ • テーブルを参照せずに結果が得られる場合 17
Unique 演算子 =# EXPLAIN SELECT distinct oid FROM pg_proc; QUERY PLAN -------------------------Unique (cost=181. 55. . 190. 29 rows=1747 width=4) -> Sort (cost=181. 55. . 185. 92 rows=1747 width=4) Sort Key: oid -> Seq Scan on pg_proc (cost=0. 00. . 87. 47 rows=1747 width=4) • • • 入力セットから重複する値を削除 行の並べ替えはせず、単に重複する行を取り除く 入力セットは予めソート済み (Sort演算子の後に行う) タプルコストごとに「CPU演算」× 2 DISTINCT と UNION で使用される 18
Limit 演算子 =# EXPLAIN SELECT oid FROM pg_proc LIMIT 5; QUERY PLAN ---------------------Limit (cost=0. 00. . 0. 25 rows=5 width=4) -> Seq Scan on pg_proc (cost=0. 00. . 87. 47 rows=1747 width=4) • 行は指定された数に等しい • 最初の行を即時に返す • 少量の開始コスト追加でオフセットの扱いも可 =# EXPLAIN SELECT oid FROM pg_proc LIMIT 5 OFFSET 5; QUERY PLAN ---------------------Limit (cost=0. 25. . 0. 50 rows=5 width=4) -> Seq Scan on pg_proc (cost=0. 00. . 87. 47 rows=1747 width=4) 19
Aggregate 演算子 =# EXPLAIN SELECT count(*) FROM pg_proc; QUERY PLAN -------------------------------Aggregate (cost=91. 84. . 91. 84 rows=1 width=0) -> Seq Scan on pg_proc (cost=0. 00. . 87. 47 rows=1747 width=0) • count, sum, min, max, avg, sttdev, varianceを使用 • GROUP BY 使用の場合差異が認められることがあり =# EXPLAIN SELECT count(oid), oid FROM pg_proc GROUP BY oid; QUERY PLAN ------------------------------Hash. Aggregate (cost=96. 20. . 100. 57 rows=1747 width=4) -> Seq Scan on pg_proc (cost=0. 00. . 87. 47 rows=1747 width=4) 20
Group. Aggregate 演算子 =# EXPLAIN SELECT count(*) FROM pg_foo GROUP BY oid; QUERY PLAN --------------------------------Group. Aggregate (cost=37442. 53. . 39789. 07 rows=234654 width=4) -> Sort (cost=37442. 53. . 38029. 16 rows=234654 width=4) Sort Key: oid -> Seq Scan on pg_foo (cost=0. 00. . 13520. 54 rows=234654 width=4) • GROUP BYを使用し、より大きな結果セット上に 集約を行う 21
Append 演算子 =# EXPLAIN SELECT oid FROM pg_proc UNION ALL SELECT oid ORDER BY pg_proc; QUERY PLAN -------------------------------Append (cost=0. 00. . 209. 88 rows=3494 width=4) -> Seq Scan on pg_proc (cost=0. 00. . 87. 47 rows=1747 width=4) • UNION (ALL) によるトリガー, 継承 • 開始コスト無し • コストは単に全ての入力の合計 22
Nested Loop 演算子 =# SELECT * FROM pg_foo JOIN pg_namespace ON (pg_foo. pronamespace=pg_namespace. oid); QUERY PLAN -----------------------------------Nested Loop (cost=1. 05. . 39920. 17 rows=5867 width=68) Join Filter: ("outer". pronamespace = "inner". oid) -> Seq Scan on pg_foo (cost=0. 00. . 13520. 54 rows=234654 width=68) -> Materialize (cost=1. 05. . 1. 10 rows=5 width=4) -> Seq Scan on pg_namespace (cost=0. 00. . 1. 05 rows=5 width=4) • • • 2つのテ=ブルの結合(2つの入力セット) INNER JOIN と LEFT OUTER JOIN の使用 「外部」テーブルをスキャンし、「内部」テーブルにマッチするものの発見 開始コスト無し インデックスが無い場合遅い問い合わせになる可能性、特にselect句に関 数がある場合 23
Merge Join 演算子 =# EXPLAIN SELECT relname, nspname FROM pg_class left join pg_namespace ON (pg_class. relnamespace = pg_namespace. oid); QUERY PLAN ------------------------------------Merge Right Join (cost=14. 98. . 17. 79 rows=186 width=128) Merge Cond: ("outer". oid = "inner". relnamespace) -> Sort (cost=1. 11. . 1. 12 rows=5 width=68) Sort Key: pg_namespace. oid -> Seq Scan on pg_namespace (cost=0. 00. . 1. 05 rows=5 width=68) -> Sort (cost=13. 87. . 14. 34 rows=186 width=68) Sort Key: pg_class. relnamespace -> Seq Scan on pg_class (cost=0. 00. . 6. 86 rows=186 width=68) • 二つのデータセットをJOINする:outerとinner • Merge Right JoinとMerge In Joinがある • データセットはあらかじめソートされていなければならず、また両方同 時に走査される。 24
Hash & Hash Join 演算子 =# EXPLAIN SELECT relname, nspname FROM pg_class JOIN pg_namespace ON (pg_class. relnamespace=pg_namespace. oid); QUERY PLAN ------------------------------------Hash Join (cost=1. 06. . 10. 71 rows=186 width=128) Hash Cond: ("outer". relnamespace = "inner". oid) -> Seq Scan on pg_class (cost=0. 00. . 6. 86 rows=186 width=68) -> Hash (cost=1. 05. . 1. 05 rows=5 width=68) -> Seq Scan on pg_namespace (cost=0. 00. . 1. 05 rows=5 width=68) • Hashは、異なる Hash Join演算子で使用されるハッシュテーブルを作 成する • 一方の入力からハッシュテーブルを作成し、二つの入力を比較する • INNER JOIN、OUTER JOINと同時に使われる • ハッシュの作成にはスタートアップコストが伴う 25
Tid Scan 演算子 =# EXPLAIN SELECT oid FROM pg_proc WHERE ctid = '(0, 1)'; QUERY PLAN ---------------------------Tid Scan on pg_proc (cost=0. 00. . 4. 01 rows=1 width=4) Filter: (ctid = '(0, 1)': : tid) • カラムタプルID • “ctid=”がクエリに指定された場合のみ使われる • 滅多に使わない、非常に速い 26
Function Scan 演算子 =# CREATE FUNCTION foo(integer) RETURNS SETOF integer AS $$ select $1; $$ LANGUAGE sql; =# EXPLAIN SELECT * FROM foo(12); QUERY PLAN ------------------------------Function Scan on foo (cost=0. 00. . 12. 50 rows=1000 width=4) • 関数がデータをgatherするときに出てくる • トラブルシューティングの観点からは若干ミステリアス • 関数の中で使われているクエリについてexplainを走らせるべき 27
Set. Op 演算子 =# EXPLAIN SELECT oid FROM pg_proc INTERSECT SELECT oid FROM pg_proc; QUERY PLAN ------------------------------------Set. Op Intersect (cost=415. 51. . 432. 98 rows=349 width=4) -> Sort (cost=415. 51. . 424. 25 rows=3494 width=4) Sort Key: oid -> Append (cost=0. 00. . 209. 88 rows=3494 width=4) -> Subquery Scan "*SELECT* 1" (cost=0. 00. . 104. 94 rows=1747) -> Seq Scan on pg_proc (cost=0. 00. . 87. 47 rows=1747) -> Subquery Scan "*SELECT* 2" (cost=0. 00. . 104. 94 rows=1747) -> Seq Scan on pg_proc (cost=0. 00. . 87. 47 rows=1747) • INTERSECT, INTERSECT ALL, EXCEPT ALL句のために使用される – Set. Op Intersect, Intersect All, Except All 28
実行プランの強制 • SET enable_演算子 = off; – プランナーがある演算子を使おうとするのを「強く思いとどまらせる」こ とができる – SETを行ったセッションのみに影響する • Planner Method Configuration (on/off) – – – – – enable_bitmapscan enable_hashagg enable_hashjoin enable_indexscan enable_mergejoin enable_nestloop enable_seqscan enable_sort enable_tidscan 29
Seq Scan の強制 =# EXPLAIN SELECT * FROM pg_class; QUERY PLAN ---------------------------Seq Scan on pg_class (cost=10000. 00. . 100000006. 86 rows=186 width=164) • 始動コストに 10000. 0 を足すだけ – /src/backend/optimizer/path/costsize. c 30
スキャン強制, プランを変える =# EXPLAIN ANALYZE SELECT * FROM pg_class WHERE oid > 2112; QUERY PLAN ------------------------Seq Scan on pg_class (cost=0. 00. . 7. 33 rows=62 width=164) (actual time=0. 087. . 1. 700 rows=174 loops=1) Filter: (oid > 2112: : oid) Total runtime: 2. 413 ms =# SET enable_seqscan = off; =# EXPLAIN ANALYZE SELECT * ORDER BY pg_class WHERE oid > 2112; QUERY PLAN ------------------------Index Scan using pg_class_oid_index on pg_class (cost=0. 00. . 22. 84 rows=62 width=164) (actual time=0. 144. . 1. 802 rows=174 loops=1) Index Cond: (oid > 2112: : oid) Total runtime: 2. 653 ms 31
実際のデバッグ(例1) : ANALYZE前 =# EXPLAIN ANALYZE SELECT exception_id FROM exception JOIN exception_notice_map USING (exception_id) WHERE complete IS FALSE AND notice_id = 3; QUERY PLAN ----------------------------------Nested Loop (cost=0. 00. . 2654. 65 rows=199 width=8) (actual time=151. 16. . 538. 45 rows=124 loops=1) -> Seq Scan on exception_notice_map (cost=0. 00. . 250. 50 rows=399 width=4) (actual time=0. 101. 61 rows=15181 loops=1) Filter: (notice_id = 3) -> Index Scan using exception_pkey on exception (cost=0. 00. . 6. 01 rows=1 width=4) (actual time=0. 03. . 0. 03 rows=0 loops=15181) Index Cond: (exception_id = "outer". exception_id) Filter: (complete IS FALSE) Total runtime: 538. 76 msec exception表に“WHERE complete IS False”という条件の部分インデックスが あり、条件を満たす行は 251行だけな 34 のに使ってくれない
実際のデバッグ(例1) : ANALYZE後 =# ANALYZE exception; =# EXPLAIN ANALYZE SELECT exception_id FROM exception JOIN exception_notice_map USING (exception_id) WHERE complete IS FALSE AND notice_id = 3; QUERY PLAN -------------------------------Hash Join (cost=28. 48. . 280. 98 rows=1 width=8) (actual time=31. 45. . 97. 78 rows=124 loops=1) Hash Cond: ("outer". exception_id = "inner". exception_id) -> Seq Scan on exception_notice_map (cost=0. 00. . 250. 50 rows=399 width=4) (actual time=0. 12. . 77. 12 rows=15181 loops=1) Filter: (notice_id = 3) 部分インデックスを -> Hash (cost=26. 31. . 26. 31 rows=251 width=4) 使ってくれた (actual time=2. 96. . 2. 96 rows=0 loops=1) -> Index Scan using active_exceptions on exception (cost=0. 00. . 26. 31 rows=251 width=4) (actual time=0. 24. . 2. 55 rows=251 loops=1) Filter: (complete IS FALSE) Total runtime: 97. 99 msec 35
実際のデバッグ(例2) : ANALYZE前 =# EXPLAIN ANALYZE SELECT exception_id FROM exception JOIN exception_notice_map USING (exception_id) WHERE complete IS FALSE AND notice_id = 3; QUERY PLAN -------------------------------Hash Join (cost=22. 51. . 45. 04 rows=2 width=8) (actual time=9961. 14. . 11385. 11 rows=105 loops=1) Hash Cond: ("outer". exception_id = "inner". exception_id) -> Seq Scan on exception (cost=0. 00. . 20. 00 rows=500 width=4) (actual time=365. 12. . 10659. 11 rows=228 loops=1) Filter: (complete IS FALSE) -> Hash (cost=22. 50. . 22. 50 rows=5 width=4) (actual time=723. 39. . 723. 39 rows=0 loops=1) -> Seq Scan on exception_notice_map (cost=0. 00. . 22. 50 rows=5 width=4) (actual time=10. 12. . 694. 57 rows=15271 loops=1) Filter: (notice_id = 3) 推定値と結果 (actual) の Total runtime: 11513. 78 msec 行数 (rows) の違いに注目。 36 まずはANALYZEしてみる。
実際のデバッグ(例2) : ANALYZE 1回目 =# ANALYZE exception_notice_map; =# EXPLAIN ANALYZE SELECT exception_id FROM exception JOIN exception_notice_map USING (exception_id) WHERE complete IS FALSE AND notice_id = 3; QUERY PLAN ------------------------------Merge Join (cost=42. 41. . 802. 93 rows=390 width=8) (actual time=10268. 79. . 10898. 29 rows=105 loops=1) Merge Cond: ("outer". exception_id = "inner". exception_id) -> Index Scan using exception_id on exception_notice_map (cost=0. 00. . 714. 22 rows=15562 width=4) (actual time=50. 80. . 1063. 05 rows=15271 loops=1) Filter: (notice_id = 3) 行数の推定は正しくなった -> Sort (cost=42. 41. . 43. 66 rows=500 width=4) (actual time=9800. 32. . 9800. 65 rows=222 loops=1) Sort Key: exception_id 妙にキリが良い数値を疑う -> Seq Scan on exception (cost=0. 00. . 20. 00 rows=500 width=4) (actual time=357. 18. . 9799. 63 rows=228 loops=1) Filter: (complete IS FALSE) 37 Total runtime: 10898. 57 msec
実際のデバッグ(例2) : ANALYZE 2回目 =# ANALYZE exception; =# EXPLAIN ANALYZE SELECT exception_id FROM exception JOIN exception_notice_map USING (exception_id) キリが良い数値が WHERE complete IS FALSE AND notice_id = 3; 無くなり速度が改善。 QUERY PLAN ただし、見積の誤差が ------------------------------増加した理由は謎… Merge Join (cost=0. 00. . 796. 57 rows=31 width=8) (actual time=425. 41. . 971. 81 rows=105 loops=1) Merge Cond: ("outer". exception_id = "inner". exception_id) -> Index Scan using active_exceptions on exception (cost=0. 00. . 41. 86 rows=651 width=4) (actual time=54. 04. . 84. 22 rows=222 loops=1) Filter: (complete IS FALSE) -> Index Scan using exception_id on exception_notice_map (cost=0. 00. . 714. 22 rows=15562 width=4) (actual time=34. 42. . 843. 10 rows=15271 loops=1) Filter: (notice_id = 3) Total runtime: 972. 05 msec 38
実際のデバッグ(例3) : Seq Scanが遅い =# EXPLAIN ANALYZE SELECT s. site_id, s. name, i. image_name FROM images i JOIN host h USING (host_id) JOIN site s USING (site_id) WHERE images_id > 2112; QUERY PLAN ------------------------------------------Hash Join (cost=113. 88. . 253. 51 rows=534 width=53) (actual time=610. 52. . 627. 11 rows=534 loops=1) Hash Cond: ("outer". site_id = "inner". site_id) -> Seq Scan on site s (cost=0. 00. . 73. 74 rows=1974 width=34) (actual time=5. 25. . 17. 43 rows=1974 loops=1) host表のSeq -> Hash (cost=112. 54. . 112. 54 rows=534 width=19) Scan時間が (actual time=605. 15. . 605. 15 rows=0 loops=1) -> Hash Join (cost=15. 01. . 112. 54 rows=534 width=19) 他表と比べて (actual time=590. 89. . 604. 06 rows=534 loops=1) 長すぎる Hash Cond: ("outer". host_id = "inner". host_id) -> Seq Scan on host h (cost=0. 00. . 77. 24 rows=2724 width=8) (actual time=567. 99. . 581. 30 rows=2724 loops=1) -> Hash (cost=13. 68. . 13. 68 rows=534 width=11) (actual time=17. 30. . 17. 30 rows=0 loops=1) -> Seq Scan on images i (cost=0. 00. . 13. 68 rows=534 width=11) (actual time=14. 55. . 16. 47 rows=534 loops=1) Filter: (images_id > 2112) 39
実際のデバッグ(例3) : 肥大化の回復 =# VACUUM FULL VERBOSE host; INFO: --Relation public. host-INFO: Pages 4785: Changed 0, reaped 4761, Empty 0, New 0; Tup 2724: Vac 0, Keep/VTL 0/0, Un. Used 267553, Min. Len 100, Max. Len 229; Re-using: Free/Avail. Space 37629760/37627880; End. Empty/Avail. Pages 0/4751. VACUUM FULL で CPU 0. 30 s/0. 03 u sec elapsed 0. 32 sec. 肥大化から回復させる。 INFO: Index host_pkey: Pages 1214; Tuples 2724: Deleted 0. 多くのUn. Usedを回収し CPU 0. 07 s/0. 01 u sec elapsed 0. 08 sec. ページ数が大幅に減少。 INFO: Rel host: Pages: 4785 --> 50; Tuple(s) moved: 2724. CPU 0. 52 s/1. 09 u sec elapsed 1. 66 sec. INFO: Index host_pkey: Pages 1214; Tuples 2724: Deleted 2724. CPU 0. 14 s/0. 00 u sec elapsed 0. 14 sec. INFO: --Relation pg_toast_2124348104 -INFO: Pages 0: Changed 0, reaped 0, Empty 0, New 0; Tup 0: Vac 0, Keep/VTL 0/0, Un. Used 0, Min. Len 0, Max. Len 0; Re-using: Free/Avail. Space 0/0; End. Empty/Avail. Pages 0/0. CPU 0. 00 s/0. 00 u sec elapsed 0. 00 sec. INFO: Index pg_toast_2124348104_index: Pages 1; Tuples 0. CPU 0. 00 s/0. 00 u sec elapsed 0. 00 sec. VACUUM 40
実際のデバッグ(例4) : 結合 =# EXPLAIN ANALYZE SELECT count(*) FROM advertiser_contact JOIN advertiser USING (advertiser_id) WHERE type=1; QUERY PLAN ---------------------------------Aggregate (cost=1. 87. . 1. 87 rows=1 width=0) (actual time=8. 790. . 8. 791 rows=1 loops=1) -> Merge Join (cost=1. 03. . 1. 86 rows=2 width=0) (actual time=8. 752. . 8. 766 rows=2 loops=1) Merge Cond: ("outer". advertiser_id = "inner". advertiser_id) -> Index Scan using advertiser_id_pkey on advertiser 単純に結合を使うと (cost=0. 00. . 2. 11 rows=8 width=4) (actual time=8. 627. . 8. 650 rows=4 loops=1) 8. 978 ms。 Filter: ("type" = 1) もっと速くできないか? -> Sort (cost=1. 03. . 1. 03 rows=2 width=4) (actual time=0. 073. . 0. 075 rows=2 loops=1) Sort Key: advertiser_contact. advertiser_id -> Seq Scan on advertiser_contact (cost=0. 00. . 1. 02 rows=2 width=4) (actual time=0. 021. . 0. 027 rows=2 loops=1) Total runtime: 8. 978 ms 41
実際のデバッグ(例4) : IN =# EXPLAIN ANALYZE SELECT count(*) FROM advertiser_contact WHERE advertiser_id IN (SELECT advertiser_id FROM advertiser WHERE type = 1); QUERY PLAN ------------------------------------------Aggregate (cost=2. 23. . 2. 23 rows=1 width=0) (actual time=0. 261. . 0. 261 rows=1 loops=1) -> Hash Join (cost=2. 15. . 2. 23 rows=2 width=0) (actual time=0. 231. . 0. 246 rows=2 loops=1) Hash Cond: ("outer". advertiser_id = "inner". advertiser_id) -> Hash. Aggregate (cost=1. 12. . 1. 12 rows=8 width=4) (actual time=0. 091. . 0. 112 rows=8 loops=1) -> Seq Scan on advertiser (cost=0. 00. . 1. 10 rows=8 width=4) (actual time=0. 051. . 0. 068 rows=8 loops=1) Filter: ("type" = 1) -> Hash (cost=1. 02. . 1. 02 rows=2 width=4) (actual time=0. 101. . 0. 101 rows=0 loops=1) -> Seq Scan on advertiser_contact (cost=0. 00. . 1. 02 rows=2 width=4) (actual time=0. 088. . 0. 094 rows=2 loops=1) INにしたら速くなった! Total runtime: 0. 422 ms 8. 978 → 0. 422 ms 42
実際のデバッグ(例4) : EXISTS =# EXPLAIN ANALYZE SELECT count(*) FROM advertiser_contact WHERE EXISTS (SELECT 1 FROM advertiser WHERE advertiser_id=advertiser_contact. advertiser_id AND type = 1); QUERY PLAN ------------------------------Aggregate (cost=3. 27. . 3. 27 rows=1 width=0) (actual time=0. 200. . 0. 201 rows=1 loops=1) -> Seq Scan on advertiser_contact (cost=0. 00. . 3. 26 rows=1 width=0) (actual time=0. 162. . 0. 179 rows=2 loops=1) Filter: (subplan) Sub. Plan -> Seq Scan on advertiser (cost=0. 00. . 1. 12 rows=1 width=0) (actual time=0. 034. . 0. 034 rows=1 loops=2) Filter: ((advertiser_id = $0) AND ("type" = 1)) EXISTSはさらに速い! Total runtime: 0. 333 ms 0. 422 → 0. 333 ms • 1つのクエリに対して何通りのもアプローチがある • 実際のデータシナリオに対してもテストすること 43
ありがとうございました • • Greg Sabino Mullane Andrew. SN@#postgresql Magnifikus@#postgresql Bryan Encina 46
外部リンク • オリジナルのスライド資料 – http: //redivi. com/~bob/oscon 2005_pgsql_pdf/OSCON_Explaining _Explain_Public. pdf • Postgre. SQL文書 – EXPLAINの利用 • http: //www. postgresql. jp/document/current/html/using-explain. html – 行推定の例 • http: //www. postgresql. jp/document/current/html/row-estimationexamples. html • Reading Pg. Admin Graphical Explain Plans – http: //www. postgresonline. com/journal/index. php? /archives/27 Reading-Pg. Admin-Graphical-Explain-Plans. html 47