Experimental Designs Between vs Within Subjects Research Design

Experimental Designs Between vs. Within Subjects

Research Design n The way that you select and assign participants to groups and control for extraneous variables.
 Assignment to groups")
Two Group Design n Simplest Experimental Design One IV (two levels) Assignment to groups is either: – Between – Within

Assignment to Groups Random vs. Correlated

1. Random Assignment Equal chance of being assigned to one of all possible groups. i. e. , Independent Groups i. e. , Between-Subjects Comparison n

2. Correlated Assignment Participants are related in some way n n i. e. , Dependent Groups i. e. , Within-Subjects Comparison

Types of Correlated Assignment

1. Matched Pairs Type of correlated assignment in which subjects are first measured on some variable and then are paired with someone who scored the same or similarly on that variable. Then the members of the pair are randomly assigned to one of the two levels.

2. Natural Pairs Type of correlated assignment in which naturally occurring pairs are used. e. g. , Twins, married couples, roommates, etc.

3. Repeated Measures Type of correlated assignment in which the same participants are used in all conditions.

Why Use Correlated Assignment? n n n If you only have a small number of participants random assignment may yield unequal groups on important variables. Allows us to control for major extraneous variables. In the case of repeated measures we control for all individual differences. Statistical Advantage (more on this later)

Why Use Random Assignment? n n Controls for lots of individual and external EV if you have lots of subjects. Controls for unknown EVs. Easier to do. May be no choice due to the nature of the study or participants.

Comparing Groups Understanding and Using the t-test

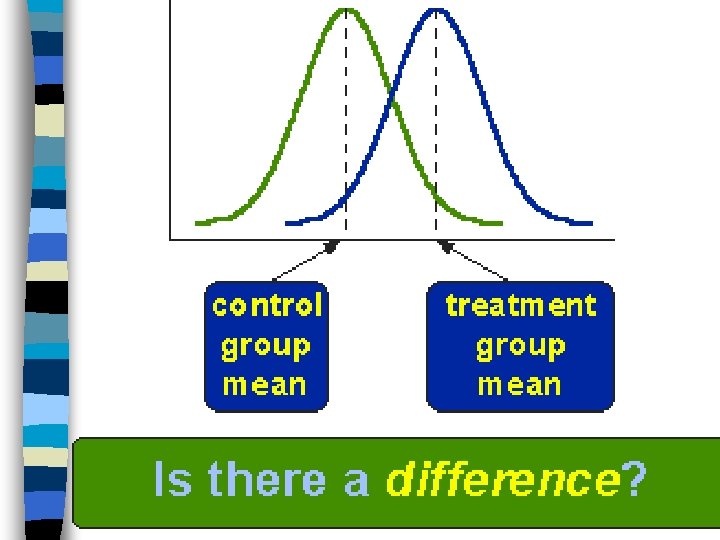
t-test Evaluates the difference between two means. Null hypothesis: The groups means are equal. t = Difference Between Groups (i. e. , IV) Differences Within Groups (i. e. , Error)

What is required. n You have a “grouping variable”, also known as your IV in the case of an experiment. – Group A vs. Group B – Pretest vs. Posttest – Male vs. Female n You have a measured variable (DV) for both groups for which it is possible to determine the mean and sd.
 t-test n n Use when two randomly assigned group means are")
Independent Samples (Unpaired) t-test n n Use when two randomly assigned group means are being compared. Or, to compare two groups defined by membership categories, as long as they are still independent of one another. • • • Men vs. Women Married vs. Unmarried College vs. no college Over 65 vs. Under 65 Caucasians vs. Minorities

“Statistics are stupid” reminder n Critical thinking question: Does the fact that someone used a t-test to analyze their results mean they conducted an experiment?

T-tests can show us relationships n If you use a t-test for a non-experiment (male vs. female test scores) then you are using it to show a relationship between two variables. – Significant differences do not mean you have established cause and effect. – Establishing cause and effect relies on research design; not the statistic.

Components of a t-test n n n n N Means and Standard deviations Standard Error of the difference 95% Confidence interval DF t-value p-value

A Demonstration n DV: Scores on the Survey of Recent Life Experiences (measure of hassles) – “Dislike daily activities” – “Conflicts at work” – “Having your trust betrayed” n Scores can range from 41 -164

Independent Groups n Grouping variable – Capital Citizens – District 12 Citizens

Enter data into Graphpad. com District 12 12 150 72 142 81 160 69 149 44 130 61 146 55 152 43 148 60 121 52 136
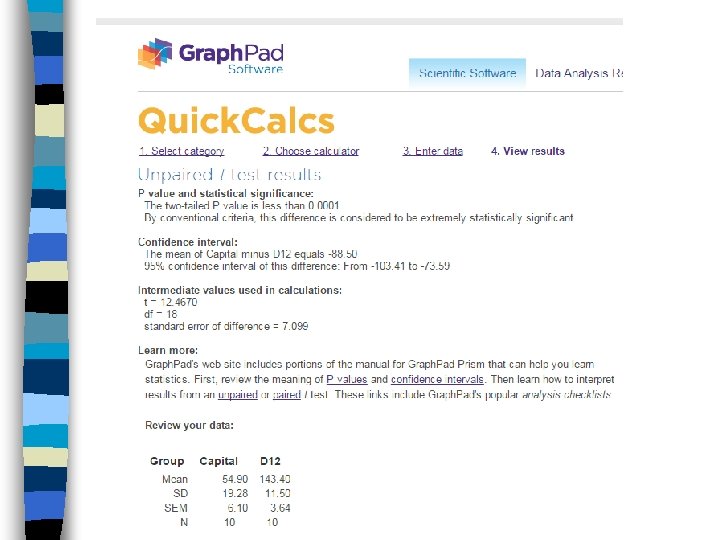

Writing up the independent samples t-test in APA style. There was a significant difference between citizens from the Capital and citizens from D 12 in the amount of hassles experienced on a regular basis, t(18) = 12. 47, p <. 001, d = 5. 5. Those from D 12( m = 143. 4, sd = 11. 5) had significantly more hassles than those from the Capital (m = 54. 9 , sd = 19. 2). Enter the df here. Enter the t-value here.
")
Writing Non-Significant results While Group A scored higher (m = 4, sd = 2) than Group B (m = 3. 5, sd = 1. 4) on their memory test, the difference was not statistically significant, t(14) =. 96, p =. 35, d =. 02.

Effect Size for t-tests Cohen’s D

Cohen’s D Formula http: //www. socscistatistics. com/effectsize/ Default 3. aspx

Interpreting n Equivalent to a Z-score. n e. g. , An effect size of. 80 means that the score of the average person in the experimental group exceeds the scores of 79% of the control group.
 –")
Interpreting d n Conventional “rules of thumb” – d =. 20 (small, trivial) – d =. 50 (medium) – d =. 80 (large) Useful Demonstration However, …it depends on the subject matter. If you could save just 5 more lives it might have huge practical significance!

In-Class Work n Practice conducting and interpreting a ttest. n Exercise 39 – Skip #12 but calculate effect sizes and add those to the table as another column. Homework: Exercises 37 and 38 in Canvas
 group")
Paired Samples t-test n Use when two correlated (i. e. , paired, dependent) group means are being compared. – Repeated measures – Matched pairs – Natural pairs

Components of the Paired Samples t-test n Same as the Independent Groups t-test – In some calculators, results include a correlation coefficient as well.

Example Paired Sample The correlation between scores on trial 1 and trial 2 is not significant. (probably due to small sample) Here is the t-test and it is significant. There is a difference in the trial means.

Why include a correlation? n Tells you whether the DV scores for each pair were significantly correlated. – If sig. level (p-value) is less than. 05, then the pairs of scores were related. – Tells you whether or not you reduced error by eliminating EV(s).
 – This")
Statistical Advantage? Depends. n Correlated Assignment reduces error variability (within groups differences) – This causes the calculated t-value to be larger (which is good) n However, the degrees of freedom is smaller (based on pairs rather than N). – This makes the critical t-value larger (not good)

Online Effect Size Calculator n http: //www. cognitiveflexibility. org/effectsi ze/

Writing up in APA style n There was a significant difference between the trial 1 and trial 2 anxiety levels, t(11) = 7. 5, p <. 001, d = 2. 2. The anxiety levels of participants was higher in trial 1 (m = 16. 5, sd = 2. 0) as compared to their anxiety in trial 2 (m = 11. 5, sd = 2. 4).

Another Example: Paired

What if we compared the same data as a between subjects design? Notice: All this is the same. Not Significant now! Big increase in error.

Conclusion n If you have a significant correlation you know that you reduced error and gained a statistical advantage. If it is not significant, you wasted your time and lost statistical power.

In-Class Practice n Exercise 41 Homework: Exercise 40
- Slides: 42