Experimental Design in Business Studies Correlation vs Causality

Experimental Design in Business Studies Correlation vs. Causality

Research Design • Correlation • Causality

Correlational Research • investigates whether changes in one variable are related to changes in another variable – What is the relationship between being from the South and aggressive behavior?
 • correlation coefficients – range from +1. 00 to -1.")
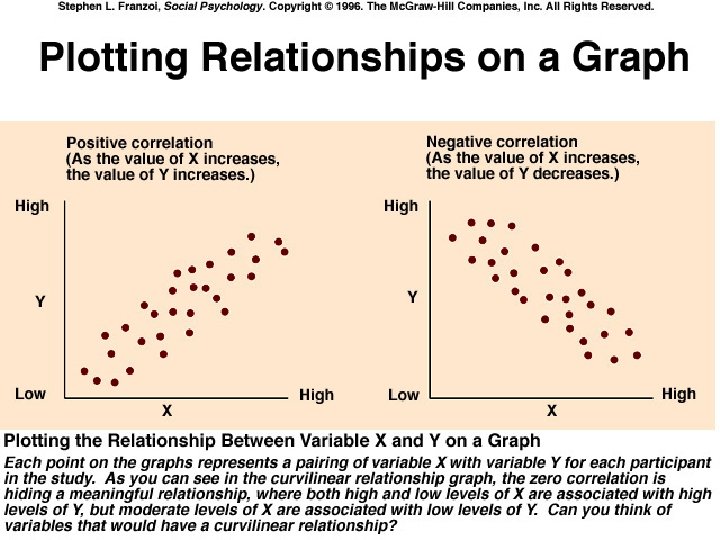
Correlational Research (Cont. ) • correlation coefficients – range from +1. 00 to -1. 00 – positive correlation: increase/decrease in the same direction
")
Correlational Research (Cont. )
 • correlation coefficients – range from +1. 00 to -1.")
Correlational Research (Cont. ) • correlation coefficients – range from +1. 00 to -1. 00 – negative correlation: increase/decrease in opposite directions
")
Correlational Research (Cont. )
 • correlation coefficients – range from +1. 00 to -1.")
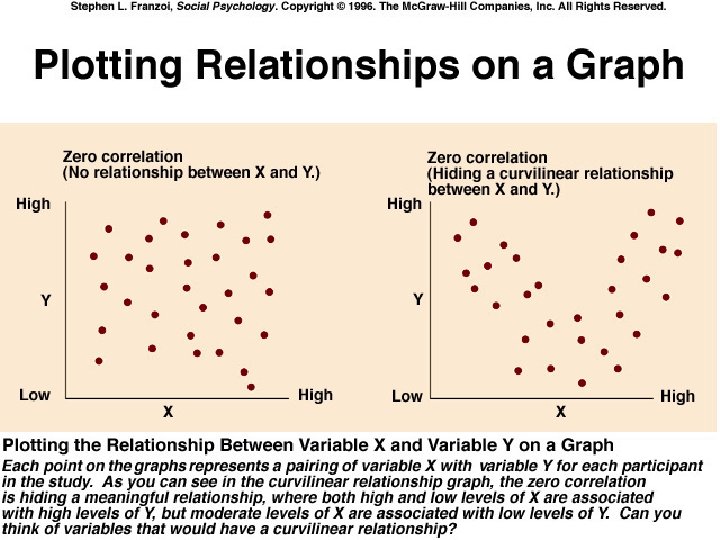
Correlational Research (Cont. ) • correlation coefficients – range from +1. 00 to -1. 00 – strength of the relationship: closeness to +1. 00/ -1. 00, not by the valence (+/-) – Which indicates a stronger correlation: -. 74 or +. 21?
")
Correlational Research (Cont. )
 • What is the relationship between being from the South")
Correlational Research (Cont. ) • What is the relationship between being from the South and aggressive behavior? – Nisbett (1993) • homicide rate and “southernness”: rs =. 37 &. 52 – in the social sciences (Cohen, 1992) • r =. 50 (strong) • r =. 30 (moderate) • r =. 10 (small)
 • strengths of this approach – can be a random")
Correlational Research (Cont. ) • strengths of this approach – can be a random sample – actual behavior – has good generalizability (i. e. , external validity) – potential for numerous variables
 • weakness of this approach – cannot infer a cause-effect")
Correlational Research (Cont. ) • weakness of this approach – cannot infer a cause-effect relationship • factors for inferring causality – association -- yes – temporal priority -- no – rule out a spurious relationship -- no

Correlational Research • Positive = “same direction” • Negative = “opposite direction” • The positive or negative relationship between two variables is called a correlation (positive or negative). – Correlation is represented by the coefficient r • Conveys magnitude (value of r) and direction (- or +) Ex: correlation between hours of sleep and energy level is r=. 60 (0 < r < 1) – Correlations do not imply a causal relationship
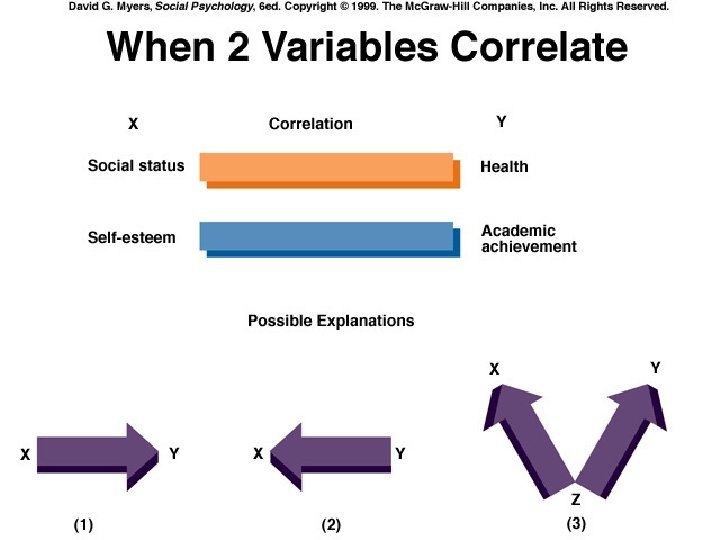

Summary of Correlational Research • strengths – potential for numerous variables – good generalizability • weaknesses – cannot make causal conclusions • direction of causality • 3 rd variable problem

Experimental Design • characteristics – manipulation of a variable • solves the direction of causality problem – randomly assign to conditions • solves the 3 rd variable problem
 • language of experiments – independent variable – operational variable")
Experimental Design (Cont. ) • language of experiments – independent variable – operational variable – random assignment
 • testing theory – Does the independent variable cause changes")
Experimental Design (Cont. ) • testing theory – Does the independent variable cause changes in the dependent variable? southernness cause aggression
")
Experimental Design • the Southern culture of honor hypothesis – Cohen et al. (1996) – 2 (Southern/Northern) X 2 (insult/no insult)
 Experimental Results Insult No Insult")
Distance at which participants gave way to confederate (inches) Experimental Results Insult No Insult
 Experimental Results (Cont. ) Insult")
Distance at which participants gave way to confederate (inches) Experimental Results (Cont. ) Insult No Insult
 Insult No Insult")
Percentage Change in Cortisol Level Experimental Results (Cont. ) Insult No Insult
 Insult No Insult")
Percentage Change in Cortisol Level Experimental Results (Cont. ) Insult No Insult
 Insult No Insult")
Percentage Change in Testosterone Level Experimental Results (Cont. ) Insult No Insult
 Insult No Insult")
Percentage Change in Testosterone Level Experimental Results (Cont. ) Insult No Insult

Causal Research/Experiments • In causal research, the emphasis is on specific hypotheses about the effects of changes of one variable on another variable. • Deals with cause-effect relationship. • Involves experiment where an independent variable is changed or manipulated to see how it affects a dependent variable by controlling the effects of extraneous variables. • Extraneous variables: – Different from dependent or independent variables – Variables that may have some affects upon a dependent variable but yet are not independent variables.

Types of Experimental Designs • Many Designs • “Quasi-” and “true” experimental designs – Quasi designs: designs which do not properly control for the effects of extraneous variables. – True designs: designs which properly control for the effects of extraneous variables and isolate the effects of independent variables on the dependent variables. • Three examples: – After only design – One Group, Before-After Design – Before-After with control group

Experimental design • A set of procedures for devising an experiment such that a change in a dependent variable may be attributed solely to the change in an independent variables. • Various notations used: O = The measurement or the process of observation of a dependent variable on the subjects or groups of subjects to be tested. O 1 and O 2 refer to different measurements made of the dependent variable. X = The manipulation, or change, of an independent variable. R = Random assignment of subjects (consumers, stores, and so on) to experimental and control groups. E = Experimental effect; that is, the change in the dependent variable due to the independent variable.

Quasi-Experimental Designs Three examples: 1. After-only design X O 1 Problems? • No comparison • No control of Extraneous Variables

Quasi-Experimental Designs 2. One-group pretest-posttest design: O 1 X O 2 • Comparison of same individuals before and after Problems? • Maturation, testing effect, mortality, no control group, history effects • Frequently used in marketing research

Quasi-Experimental Designs 3. Static Group Design Experimental Group: X O 1 Control Group: O 2 • Design relies on similarity of two control groups • Possible solution: matching characteristics of the two groups (not the same as random assignment)

Experimental Designs • All experimental designs involve random assignment of test units to treatment and control/comparison groups in the design • Random assignment eliminates selection bias

Posttest Only Control Group Design • Experimental Group: R X O 1 Control Group: R O 2 • Treatment effect = O 2 -O 1 • Testing, Test Interaction, Instrumentation problems eliminated • It is assumed that extraneous variables operate equally on both groups

Pretest-posttest Control Group Design • Experimental Group R O 1 X O 2 Control Group R O 3 O 4 • Treatment Effect= (O 2 -O 1)-(O 4 -O 3) • Assumption: Extraneous variables, history, maturation, testing effects, instrumentation, will affect both groups equally

Illustrated Example

Question: “Did the change from selling in packs of two to free selection from produce bins caused this sales increase? ”

Experimental Design: the mango example • Divide the 16 supermarkets in two equivalent groups of 8 one control group, the other experimental group. • In the shops in control group, DO NOT CHANGE the packaging style, in the experimental group, make the change. • Measure the sales for both groups before the experiment date and after the experiment date. • Assume that the difference in the two groups are as below: • • • After Before 30, 720 units [O 4] 27, 980 [O 3] Difference 2, 740 [O 4 - 27, 816 [O 1] 3, 872 [O 2 - Control group O 3] Experimental group 31, 688 [O 2] O 1] Changedue = (Oto O 1) --system (O 4 -- O 3 ) Sales increase 2 --new 1, 132

Solomon Four Group Design Experimental Group 1: R O 1 X O 2 Control Group 1: R O 3 O 4 Experimental Group 2: R X O 5 Control Group 2: R O 6 Treatment effect, test interaction effect, extraneous factors effect can all be measured with this design
 • The design provides several measures of the")
Solomon Four Group Design (Cont. ) • The design provides several measures of the treatment effect (O 2 -O 4, O 2 -O 1, O 4 -O 3, O 6 -O 5). • If there is agreement, concerns about the various types of errors are lessened.

Between-Subjects vs. Within-Subjects Design • Levels may differ between or within people • Within-subject experiment - different levels of the independent variable are applied to the same subject • Between-groups experiment - different levels of the independent variable are applied to different groups of subjects

Strengths and Weaknesses of Experimental Design • strengths – allows for causal conclusions to be made -- best test of theory • weaknesses – not all questions are amenable to experiments – concerns about generalizability

Methodological Challenges • expectancy effects • demand characteristics of the situation • social desirability concerns • ethical dilemmas

Difference between Surveys and Experimental Designs The fundamental difference concerns the manipulation of independent variables. • In surveys, an effect is observed and a search for a cause follows. • In experimental research, on the other hand, independent variables are manipulated to establish a cause-effect relationship.

Summary • Correlational research is more informative, but does not allow for causal explanations • Experiments are the best test of theories
- Slides: 46